#!/usr/bin/env python
# coding: utf-8
#  | [FREYA](https://www.project-freya.eu/en) WP2 [User Story 10](https://github.com/datacite/freya/issues/45) | As a funder, we want to be able to find all the outputs related to our awarded grants, including block grants such as doctoral training grants, for management info and looking at impact.
# :------------- | :------------- | :-------------
#
# Funders are interested in monitoring the output of grants they award - while the grant is active as well as retrospectively. The quality, quantity and types of the grant's outputs are useful proxies for the value obtained as a result of the funder's investment.
# This notebook uses the [DataCite GraphQL API](https://api.datacite.org/graphql) to retrieve all outputs of [FREYA grant award](https://cordis.europa.eu/project/id/777523) from [European Union](https://doi.org/10.13039/501100000780) to date.
#
# **Goal**: By the end of this notebook you should be able to:
# - Retrieve all outputs of a grant award from a specific funder;
# - Plot number of outputs per year-quarter of the grant award duration;
# - Display de-duplicated outputs in tabular format, including the number of their citations, views and downloads;
# - Plot a pie chart of the number of outputs per resource type;
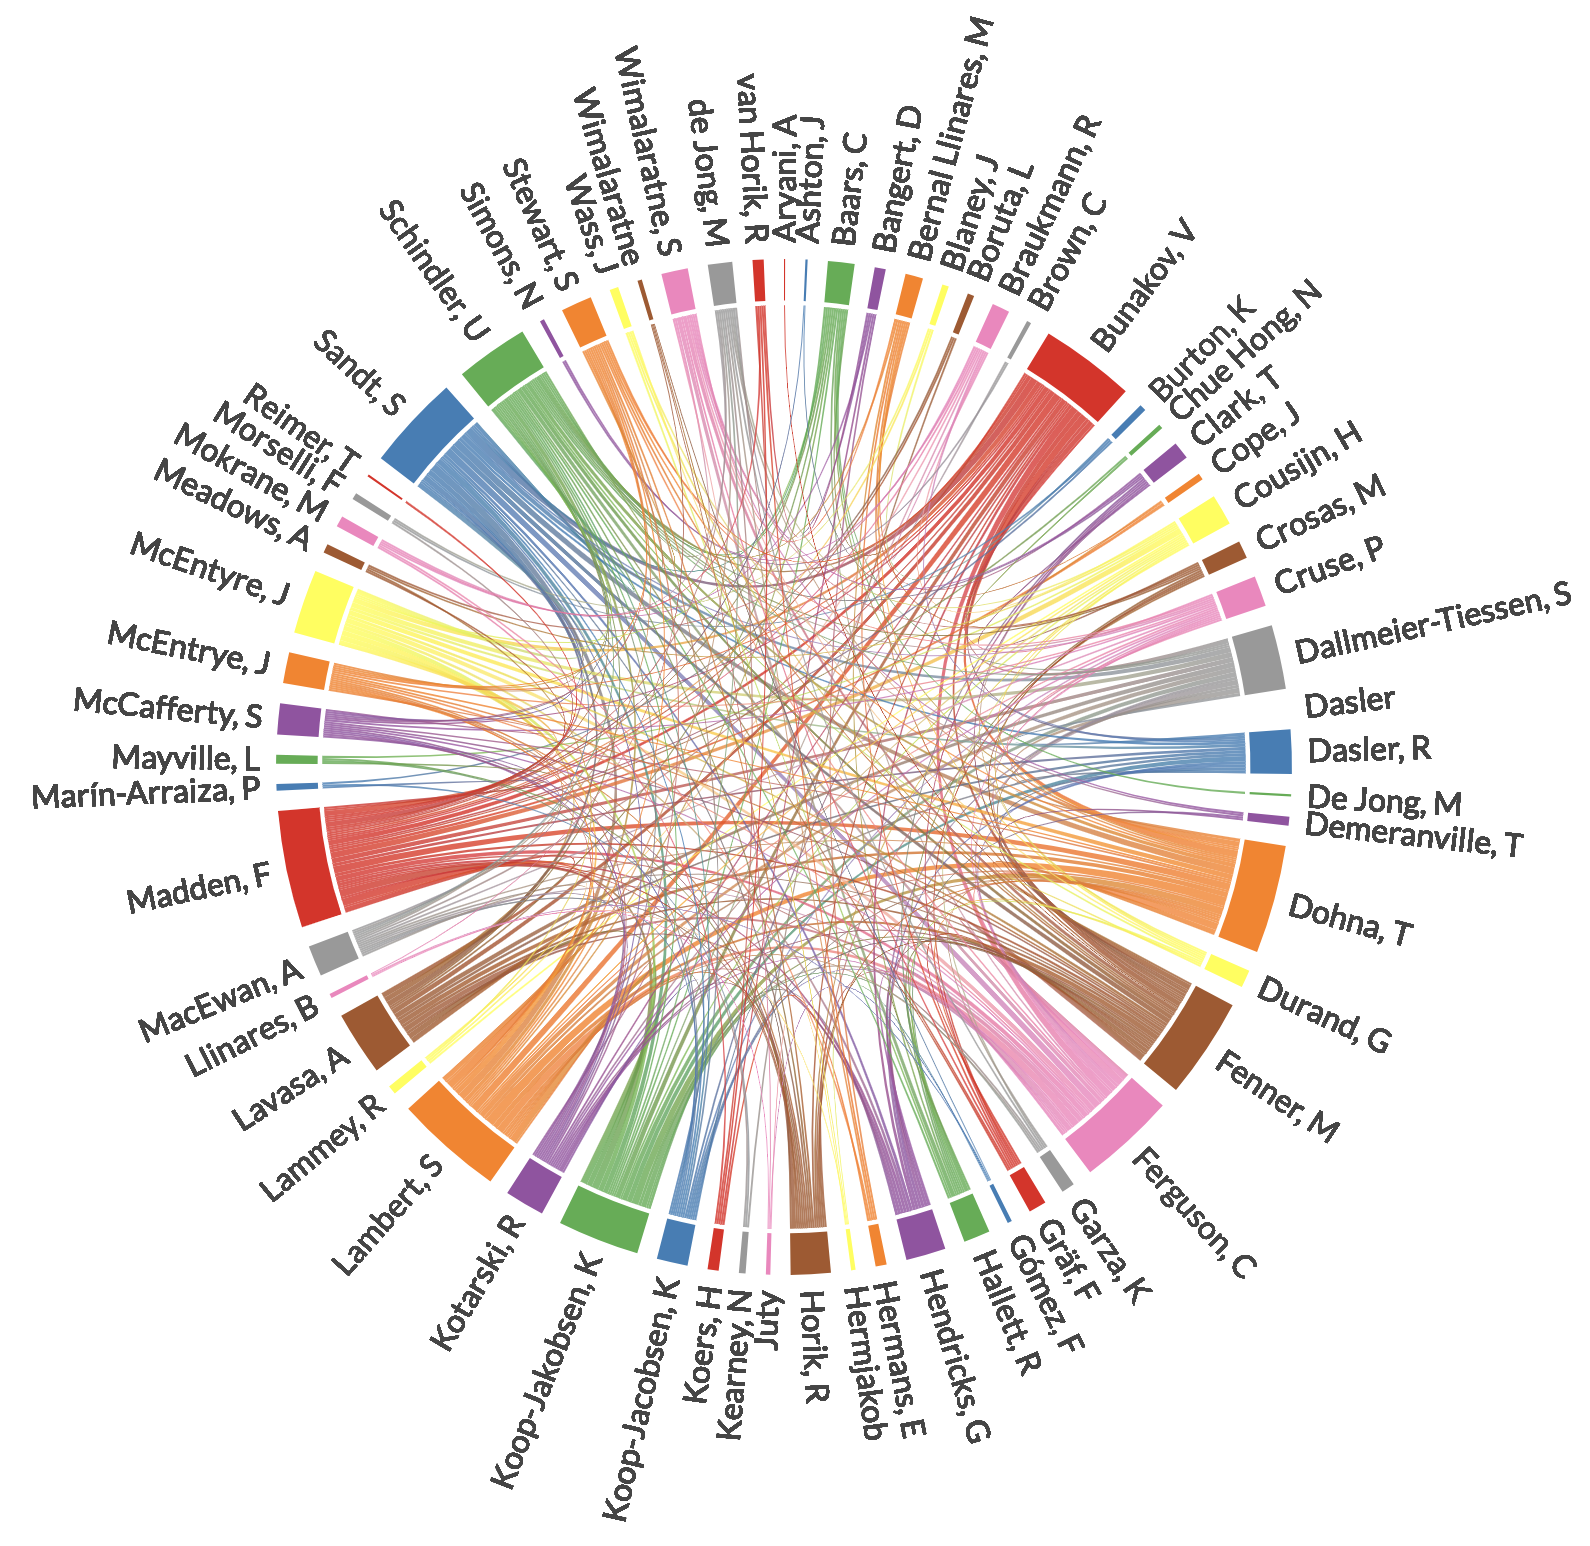
# - Display an interactive chord plot of co-authorship relationships across all outputs, e.g.
 # - Plot a pie chart of the number of outputs per license type;
# - Plot an interactive stacked bar plot showing the proportion of outputs of each type issued under a given license type.
# ## Install libraries and prepare GraphQL client
# In[29]:
get_ipython().run_cell_magic('capture', '', '# Install required Python packages\n!pip install gql requests chord==0.0.17 numpy\n')
# In[30]:
# Prepare the GraphQL client
import requests
from IPython.display import display, Markdown
from gql import gql, Client
from gql.transport.requests import RequestsHTTPTransport
_transport = RequestsHTTPTransport(
url='https://api.datacite.org/graphql',
use_json=True,
)
client = Client(
transport=_transport,
fetch_schema_from_transport=True,
)
# ## Define and run GraphQL query
# Define the GraphQL query to find all outputs of [FREYA grant award](https://cordis.europa.eu/project/id/777523) from [European Union](https://doi.org/10.13039/501100000780) to date.
# In[31]:
# Generate the GraphQL query: find all outputs of FREYA grant award (https://cordis.europa.eu/project/id/777523) from funder (EU) to date
query_params = {
"funderId" : "https://doi.org/10.13039/501100000780",
"funderAwardQuery" : "fundingReferences.awardNumber:777523",
"maxWorks" : 200
}
query = gql("""query getGrantOutputsForFunderAndAward($funderId: ID!, $funderAwardQuery: String!, $maxWorks: Int!)
{
funder(id: $funderId) {
name
works(query: $funderAwardQuery, first: $maxWorks) {
totalCount
nodes {
id
formattedCitation(style: "vancouver")
titles {
title
}
descriptions {
description
}
types {
resourceType
}
dates {
date
dateType
}
versionOfCount
rights {
rights
rightsIdentifier
rightsUri
}
creators {
id
name
}
fundingReferences {
funderIdentifier
funderName
awardNumber
awardTitle
}
citationCount
viewCount
downloadCount
}
}
}
}
""")
# Run the above query via the GraphQL client
# In[32]:
import json
data = client.execute(query, variable_values=json.dumps(query_params))
# ## Display total number of works
# Display the total number of [FREYA grant award](https://cordis.europa.eu/project/id/777523) outputs to date.
# In[33]:
# Get the total number of outputs to date
funder = data['funder']['works']
display(Markdown(str(funder['totalCount'])))
# ## Plot number of works per quarter
# Display a bar plot of number of [FREYA grant award](https://cordis.europa.eu/project/id/777523) outputs to date, per each quarter of project's duration.
# In[34]:
# Plot the number of FREYA outputs to date, by year
import matplotlib.pyplot as plt
from matplotlib.ticker import FormatStrFormatter
import numpy as np
# Return quarter (number) given month (number)
def get_quarter(month):
return (month - 1) // 3 + 1
# Return list of consecutive years between min_year_quarter and max_year_quarter inclusive
def get_consecutive_year_quarters(min_year_quarter, max_year_quarter):
year_quarters = ["%d Q%d" % (min_year_quarter[0],min_year_quarter[1])]
yq = min_year_quarter
while yq != max_year_quarter:
year = yq[0]
quarter = yq[1]
if quarter == 4:
year += 1
quarter = 1
else:
quarter += 1
yq = (year, quarter)
year_quarters.append("%d Q%d" % (year,quarter))
year_quarters.append("%d Q%d" % (max_year_quarter[0],max_year_quarter[1]))
return year_quarters
plt.rcdefaults()
# Retrieve works counts by year-quarter from nodes
# Pick out date of type: 'Issued'; failing that use 'Created' date.
num_outputs_dict = {}
funder = data['funder']['works']
for r in funder['nodes']:
node_date = None
for date_dict in r['dates']:
ym = date_dict['date'].split('-')[0:2]
if len(ym) < 2:
continue
yq = ym[0] + " Q" + str(get_quarter(int(ym[1])))
if node_date is None:
if date_dict['dateType'] in ['Issued', 'Created']:
node_date = yq
else:
if date_dict['dateType'] in ['Issued']:
node_date = yq
if node_date:
if node_date not in num_outputs_dict:
num_outputs_dict[node_date] = 0
num_outputs_dict[node_date] += 1;
# Sort works counts by year-quarter in chronological order
sorted_year_quarters = sorted(list(num_outputs_dict.keys()))
# Get all consecutive year-quarters FREYA-specific start-end year-quarter
year_quarters = get_consecutive_year_quarters((2017,4), (2020,4))
# Populate non-zero counts for year_quarters
num_outputs = []
for yq in year_quarters:
if yq in sorted_year_quarters:
num_outputs.append(num_outputs_dict[yq])
else:
num_outputs.append(0)
# Generate a plot of number of grant outputs by year - quarter
fig, ax = plt.subplots(1, 1, figsize = (10, 5))
x_pos = np.arange(len(year_quarters))
ax.bar(x_pos, num_outputs, align='center', color='blue', edgecolor='black', linewidth = 0.1, alpha=0.5)
ax.set_xticks(x_pos)
ax.set_xticklabels(year_quarters, rotation='vertical')
ax.set_ylabel('Number of outputs')
ax.set_xlabel('Year Quarter')
ax.set_title('Number of Grant Award Outputs per Year-Quarter')
plt.show()
# ## Display de-duplicated works in tabular format
# Display the outputs of [FREYA grant award](https://cordis.europa.eu/project/id/777523) in a html table, including the number of their citations, views and downloads. Note that the outputs are de-duplicated, i.e. outputs that are versions of another output are excluded.
# In[35]:
from IPython.core.display import display, HTML
import textwrap
xstr = lambda s: 'General' if s is None else str(s)
# Get details for each output
outputs = [['ID','Type','Publication Date','Formatted Citation','Descriptions', 'Number of Citations', 'Number of Views', 'Number of Downloads']]
# Since there is scope for duplicates in Zenodo, versions of previously seen nodes are considered duplicates and stored in duplicate_versions so that
# they can be excluded if seen later
for r in funder['nodes']:
id = '%s
# - Plot a pie chart of the number of outputs per license type;
# - Plot an interactive stacked bar plot showing the proportion of outputs of each type issued under a given license type.
# ## Install libraries and prepare GraphQL client
# In[29]:
get_ipython().run_cell_magic('capture', '', '# Install required Python packages\n!pip install gql requests chord==0.0.17 numpy\n')
# In[30]:
# Prepare the GraphQL client
import requests
from IPython.display import display, Markdown
from gql import gql, Client
from gql.transport.requests import RequestsHTTPTransport
_transport = RequestsHTTPTransport(
url='https://api.datacite.org/graphql',
use_json=True,
)
client = Client(
transport=_transport,
fetch_schema_from_transport=True,
)
# ## Define and run GraphQL query
# Define the GraphQL query to find all outputs of [FREYA grant award](https://cordis.europa.eu/project/id/777523) from [European Union](https://doi.org/10.13039/501100000780) to date.
# In[31]:
# Generate the GraphQL query: find all outputs of FREYA grant award (https://cordis.europa.eu/project/id/777523) from funder (EU) to date
query_params = {
"funderId" : "https://doi.org/10.13039/501100000780",
"funderAwardQuery" : "fundingReferences.awardNumber:777523",
"maxWorks" : 200
}
query = gql("""query getGrantOutputsForFunderAndAward($funderId: ID!, $funderAwardQuery: String!, $maxWorks: Int!)
{
funder(id: $funderId) {
name
works(query: $funderAwardQuery, first: $maxWorks) {
totalCount
nodes {
id
formattedCitation(style: "vancouver")
titles {
title
}
descriptions {
description
}
types {
resourceType
}
dates {
date
dateType
}
versionOfCount
rights {
rights
rightsIdentifier
rightsUri
}
creators {
id
name
}
fundingReferences {
funderIdentifier
funderName
awardNumber
awardTitle
}
citationCount
viewCount
downloadCount
}
}
}
}
""")
# Run the above query via the GraphQL client
# In[32]:
import json
data = client.execute(query, variable_values=json.dumps(query_params))
# ## Display total number of works
# Display the total number of [FREYA grant award](https://cordis.europa.eu/project/id/777523) outputs to date.
# In[33]:
# Get the total number of outputs to date
funder = data['funder']['works']
display(Markdown(str(funder['totalCount'])))
# ## Plot number of works per quarter
# Display a bar plot of number of [FREYA grant award](https://cordis.europa.eu/project/id/777523) outputs to date, per each quarter of project's duration.
# In[34]:
# Plot the number of FREYA outputs to date, by year
import matplotlib.pyplot as plt
from matplotlib.ticker import FormatStrFormatter
import numpy as np
# Return quarter (number) given month (number)
def get_quarter(month):
return (month - 1) // 3 + 1
# Return list of consecutive years between min_year_quarter and max_year_quarter inclusive
def get_consecutive_year_quarters(min_year_quarter, max_year_quarter):
year_quarters = ["%d Q%d" % (min_year_quarter[0],min_year_quarter[1])]
yq = min_year_quarter
while yq != max_year_quarter:
year = yq[0]
quarter = yq[1]
if quarter == 4:
year += 1
quarter = 1
else:
quarter += 1
yq = (year, quarter)
year_quarters.append("%d Q%d" % (year,quarter))
year_quarters.append("%d Q%d" % (max_year_quarter[0],max_year_quarter[1]))
return year_quarters
plt.rcdefaults()
# Retrieve works counts by year-quarter from nodes
# Pick out date of type: 'Issued'; failing that use 'Created' date.
num_outputs_dict = {}
funder = data['funder']['works']
for r in funder['nodes']:
node_date = None
for date_dict in r['dates']:
ym = date_dict['date'].split('-')[0:2]
if len(ym) < 2:
continue
yq = ym[0] + " Q" + str(get_quarter(int(ym[1])))
if node_date is None:
if date_dict['dateType'] in ['Issued', 'Created']:
node_date = yq
else:
if date_dict['dateType'] in ['Issued']:
node_date = yq
if node_date:
if node_date not in num_outputs_dict:
num_outputs_dict[node_date] = 0
num_outputs_dict[node_date] += 1;
# Sort works counts by year-quarter in chronological order
sorted_year_quarters = sorted(list(num_outputs_dict.keys()))
# Get all consecutive year-quarters FREYA-specific start-end year-quarter
year_quarters = get_consecutive_year_quarters((2017,4), (2020,4))
# Populate non-zero counts for year_quarters
num_outputs = []
for yq in year_quarters:
if yq in sorted_year_quarters:
num_outputs.append(num_outputs_dict[yq])
else:
num_outputs.append(0)
# Generate a plot of number of grant outputs by year - quarter
fig, ax = plt.subplots(1, 1, figsize = (10, 5))
x_pos = np.arange(len(year_quarters))
ax.bar(x_pos, num_outputs, align='center', color='blue', edgecolor='black', linewidth = 0.1, alpha=0.5)
ax.set_xticks(x_pos)
ax.set_xticklabels(year_quarters, rotation='vertical')
ax.set_ylabel('Number of outputs')
ax.set_xlabel('Year Quarter')
ax.set_title('Number of Grant Award Outputs per Year-Quarter')
plt.show()
# ## Display de-duplicated works in tabular format
# Display the outputs of [FREYA grant award](https://cordis.europa.eu/project/id/777523) in a html table, including the number of their citations, views and downloads. Note that the outputs are de-duplicated, i.e. outputs that are versions of another output are excluded.
# In[35]:
from IPython.core.display import display, HTML
import textwrap
xstr = lambda s: 'General' if s is None else str(s)
# Get details for each output
outputs = [['ID','Type','Publication Date','Formatted Citation','Descriptions', 'Number of Citations', 'Number of Views', 'Number of Downloads']]
# Since there is scope for duplicates in Zenodo, versions of previously seen nodes are considered duplicates and stored in duplicate_versions so that
# they can be excluded if seen later
for r in funder['nodes']:
id = '%s