#!/usr/bin/env python
# coding: utf-8
# #### New to Plotly?
# Plotly's Python library is free and open source! [Get started](https://plotly.com/python/getting-started/) by downloading the client and [reading the primer](https://plotly.com/python/getting-started/).
# You can set up Plotly to work in [online](https://plotly.com/python/getting-started/#initialization-for-online-plotting) or [offline](https://plotly.com/python/getting-started/#initialization-for-offline-plotting) mode, or in [jupyter notebooks](https://plotly.com/python/getting-started/#start-plotting-online).
# We also have a quick-reference [cheatsheet](https://images.plot.ly/plotly-documentation/images/python_cheat_sheet.pdf) (new!) to help you get started!
# #### Update Points Using a Click Callback
# In[ ]:
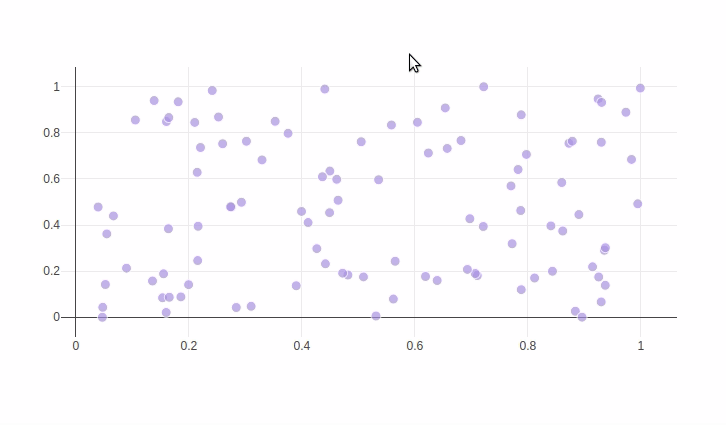
import plotly.graph_objs as go
import numpy as np
x = np.random.rand(100)
y = np.random.rand(100)
f = go.FigureWidget([go.Scatter(x=x, y=y, mode='markers')])
scatter = f.data[0]
colors = ['#a3a7e4'] * 100
scatter.marker.color = colors
scatter.marker.size = [10] * 100
f.layout.hovermode = 'closest'
# create our callback function
def update_point(trace, points, selector):
c = list(scatter.marker.color)
s = list(scatter.marker.size)
for i in points.point_inds:
c[i] = '#bae2be'
s[i] = 20
scatter.marker.color = c
scatter.marker.size = s
scatter.on_click(update_point)
f
#
# #### Reference
# See [these Jupyter notebooks](https://github.com/jonmmease/plotly_ipywidget_notebooks) for even more FigureWidget examples.
# In[3]:
help(scatter.on_click)
# In[1]:
from IPython.display import display, HTML
display(HTML(''))
display(HTML(''))
get_ipython().system(' pip install git+https://github.com/plotly/publisher.git --upgrade')
import publisher
publisher.publish(
'figurewidget-click-event.ipynb', 'python/click-events/', 'Click Events with go.FigureWidget',
'Click Events With FigureWidget',
title = 'Click Events',
name = 'Click Events',
has_thumbnail='true', thumbnail='thumbnail/figurewidget-click-events.gif',
language='python', page_type='example_index',
display_as='chart_events', order=24,
ipynb= '~notebook_demo/240')
# In[ ]:
 # #### Reference
# See [these Jupyter notebooks](https://github.com/jonmmease/plotly_ipywidget_notebooks) for even more FigureWidget examples.
# In[3]:
help(scatter.on_click)
# In[1]:
from IPython.display import display, HTML
display(HTML(''))
display(HTML(''))
get_ipython().system(' pip install git+https://github.com/plotly/publisher.git --upgrade')
import publisher
publisher.publish(
'figurewidget-click-event.ipynb', 'python/click-events/', 'Click Events with go.FigureWidget',
'Click Events With FigureWidget',
title = 'Click Events',
name = 'Click Events',
has_thumbnail='true', thumbnail='thumbnail/figurewidget-click-events.gif',
language='python', page_type='example_index',
display_as='chart_events', order=24,
ipynb= '~notebook_demo/240')
# In[ ]:
# #### Reference
# See [these Jupyter notebooks](https://github.com/jonmmease/plotly_ipywidget_notebooks) for even more FigureWidget examples.
# In[3]:
help(scatter.on_click)
# In[1]:
from IPython.display import display, HTML
display(HTML(''))
display(HTML(''))
get_ipython().system(' pip install git+https://github.com/plotly/publisher.git --upgrade')
import publisher
publisher.publish(
'figurewidget-click-event.ipynb', 'python/click-events/', 'Click Events with go.FigureWidget',
'Click Events With FigureWidget',
title = 'Click Events',
name = 'Click Events',
has_thumbnail='true', thumbnail='thumbnail/figurewidget-click-events.gif',
language='python', page_type='example_index',
display_as='chart_events', order=24,
ipynb= '~notebook_demo/240')
# In[ ]: