#!/usr/bin/env python
# coding: utf-8
# [Sebastian Raschka](http://www.sebastianraschka.com)
#
# [back](https://github.com/rasbt/matplotlib-gallery) to the `matplotlib-gallery` at [https://github.com/rasbt/matplotlib-gallery](https://github.com/rasbt/matplotlib-gallery)
# In[1]:
get_ipython().run_line_magic('load_ext', 'watermark')
# In[2]:
get_ipython().run_line_magic('watermark', '-u -v -d -p matplotlib,numpy')
# [More info](http://nbviewer.ipython.org/github/rasbt/python_reference/blob/master/ipython_magic/watermark.ipynb) about the `%watermark` extension
# In[3]:
get_ipython().run_line_magic('matplotlib', 'inline')
#
#
# # Matplotlib Tips and Tricks
# # Sections
# - [When to use the figure object](#When-to-use-the-figure-object)
# - [Fitting the margins](#fitting-the-margins)
#
#
#
#
#
#
# # When to use the figure object
# [[back to top](#Sections)]
# Often, we see code that explicitely instantiates a new `figure` object:
# In[5]:
import matplotlib.pyplot as plt
fig = plt.figure()
plt.plot([0, 1], [0, 1])
plt.show()
# If we are not planning to manipulate the figure object or add subplots to the figure, this may be redundant. Why?
# As nicely explained on [SO](http://stackoverflow.com/questions/31729220/when-is-matplotlibs-pyplot-figure-redundant/31730499#31730499), the `plot` function retrieves the current figure automatically via `gcf` ("get current figure") nested inside a `gca` ("get current axes") call. Thus, it really doesn't matter if we create a figure prior to `plot` unless we are planning to modify it in some way.
# In[6]:
import matplotlib.pyplot as plt
plt.plot([0, 1], [0, 1])
plt.show()
#
#
# # Fitting the margins
# [[back to top](#Sections)]
# Although a plot appears perfectly fine inline in a IPython notebook, sometimes we may notice that certain figure elements went missing if we save it to an image file via `savefig`. The `tight_layout()` function often helps to produce a "tighter" appearence of the plot, it is not sufficient if to fit our graph nicely into the figure boundaries if we plot outside it's margins. Consider the following example:
# 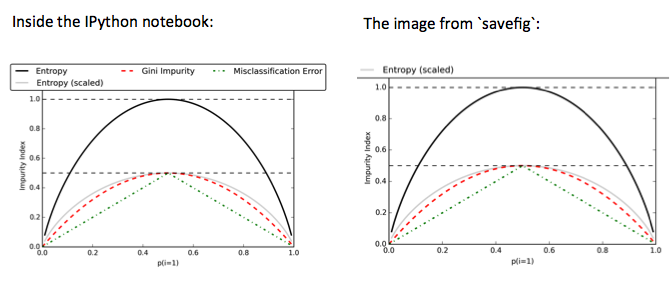
# Typically, this issue can be easily resolved by setting the `bbox_inches` attribute to `'tight'` inside `savefig`. You can find the complete code example for producing the plot below:
# In[1]:
import matplotlib.pyplot as plt
import numpy as np
get_ipython().run_line_magic('matplotlib', 'inline')
def gini(p):
return (p)*(1 - (p)) + (1-p)*(1 - (1-p))
def entropy(p):
return - p*np.log2(p) - (1 - p)*np.log2((1 - p))
def error(p):
return 1 - np.max([p, 1 - p])
x = np.arange(0.0, 1.0, 0.01)
ent = [entropy(p) if p != 0 else None for p in x]
sc_ent = [e*0.5 if e else None for e in ent]
err = [error(i) for i in x]
fig = plt.figure()
ax = plt.subplot(111)
for i, lab, ls, c, in zip([ent, sc_ent, gini(x), err],
['Entropy', 'Entropy (scaled)',
'Gini Impurity', 'Misclassification Error'],
['-', '-', '--', '-.'],
['black', 'lightgray', 'red', 'green', 'cyan']):
line = ax.plot(x, i, label=lab, linestyle=ls, lw=2, color=c)
ax.legend(loc='upper center', bbox_to_anchor=(0.5, 1.15),
ncol=3, fancybox=True, shadow=False)
ax.axhline(y=0.5, linewidth=1, color='k', linestyle='--')
ax.axhline(y=1.0, linewidth=1, color='k', linestyle='--')
plt.ylim([0, 1.1])
plt.xlabel('p(i=1)')
plt.ylabel('Impurity Index')
plt.tight_layout()
# uncomment the following line to save the image to disk
# plt.savefig('./impurity.png', dpi=300, bbox_inches='tight')
plt.show()
# In[ ]: