#!/usr/bin/env python
# coding: utf-8
# In[1]:
try:
import IPython
except:
get_ipython().system('pip install IPython')
import IPython
from IPython.core.display import HTML
HTML("""""")
# # Creating a John Ruskin StoryMap Visualisation using Linked Art
#
# This notebook demonstrates how a StoryMap visualisation of John Ruskin's artworks can be created using:
# - collections data transformed to Linked Art
# - a script to transform the Linked Art JSON-LD representation to a JSON input file
# - the KnightLab visualisation service
#
#
#
#
# #### Further Reading
#
# - [KnightLab visualisation service](https://knightlab.northwestern.edu/)
# - [KnightLab StoryMap visualisation service](https://storymap.knightlab.com/)
# - [Linked Art JSON-LD files for John Ruskin](./data/ruskin/output/json/)
#
#
#
#
# ## Create JSON input file for StoryMap
#
# The process to create the visualisation:
# - iterate over Linked Art JSON-LD files for John Ruskin
# - create JSON file that conformed to requirements for the StoryMap visualisation. The required JSON format is [described here](https://storymap.knightlab.com/advanced/#json-syntax).
#
# Example of JSON requirement is shown here:
#
# {
#     width: integer,                    // required for embed tool; width of StoryMap
#     height: integer,                   // required for embed tool; height of StoryMap
#     font_css: string,                  // optional; font set for UI controls/messages
#     calculate_zoom: true,              // optional; defaults to true *unless* map_as_image is true.
#     storymap: {
#         language: string,              // required; two-letter ISO language code
#         map_type: "zoomify",           // required
#         map_as_image: boolean,         // required; omit connecting lines between slide locations
#         map_background_color:  string, // optional; hexadecimal color value for map background
#         zoomify: {
#             path: string,              // required; URL path to zoomable image folder
#             width: integer,            // required; maximum width of image
#             height: integer,           // required; maximum height of image
#             tolerance: decimal         // required; display tolerance
#         }
#         slides: [object]               // required; array of slide objects (see below)
#     }
# }
#
#
#
#
# #### Further Reading
# - [StoryMap JSON file format](https://storymap.knightlab.com/advanced/#json-syntax)
# In[2]:
try:
import os
except:
get_ipython().system('pip install os')
import os
try:
import json
except:
get_ipython().system('pip install json')
import json
try:
import IPython
except:
get_ipython().system('pip install IPython')
import IPython
from IPython.display import display, IFrame, HTML
# ## Create JSON template file
# In[3]:
storymap = {
"storymap": {
"zoomify": False,
"attribution": "Tanya Gray",
"call_to_action": False,
"call_to_action_text": "",
"map_as_image": False,
"map_subdomains": "",
"map_type": "osm:standard",
"line_follows_path": True,
"line_color": "#c34528",
"line_color_inactive": "#CCC",
"line_join": "miter",
"line_weight": 3,
"line_opacity": 0.80,
"line_dash": "5,5",
"show_history_line": True,
"slides": [
{
"date": "",
"location": {
},
"media": {
"caption": "",
"credit": "Wikipedia",
"url": "https://en.wikipedia.org/wiki/John_Ruskin"
},
"text": {
"headline": "John Ruskin's Travels in Europe",
"text": ""
},
"type": "overview"
}]
}
}
# In[5]:
# dictionary holding values to be used in visualisation e.g. in styling
sources = {}
sources["https://www.nga.gov/collection/"] = {"name":"National Gallery of Art","colour": "#E8A798"}
sources["https://clevelandart.org/art/"] = {"name":"Cleveland Museum of Art", "colour":"#EDD59E"}
sources["https://www.philamuseum.org/collection/object/"] = {"name":"Philadelphia Museum of Art","colour":"#6B5876"}
sources["https://www.tate.org.uk/art/artworks/"] = {"name":"Tate Museum","colour":"#A09998"}
sources["https://www.harvardartmuseums.org/collections/object/"] = {"name":"Harvard Art Museum","colour":"#00758F"}
sources["ashmolean"] = {"name":"Ashmolean Museum","colour":"#3f83e8"}
sources["rijk"] = {"name":"Rijksmuseum","colour":"#94b7c3"}
months = { '01':'Janauary',
'02':'February',
'03':'March',
'04':'April',
'05':'May',
'06':'June',
'07':'July',
'08':'August',
'09':'September',
'10':'October',
'11':'November',
'12':'December'}
# filepath for JSON file created
storymap_file ="data/ruskin/storyvis/storymap.json"
# directory containing Linked Art JSON files describing John Ruskin artworks
storyvisdir="data/ruskin/storyvis/json"
file_list=os.listdir(storyvisdir)
# iterate through Linked Art files
for file in file_list:
with open( storyvisdir + "/" + file) as json_file:
# load file into json object
artwork = json.load(json_file)
# if does not have produced_by property do not include in visualisation
if "produced_by" not in artwork:
continue
# if does not have date value for begin date do not include in visualisation
if "begin_of_the_begin" not in artwork["produced_by"]["timespan"]:
continue
# if begin date is blank or == 1819, do not include
if artwork["produced_by"]["timespan"]["begin_of_the_begin"] in (1819,""):
continue
id = artwork["id"]
credit = ""
text = ""
imageurl = ""
bgcolour = ""
homepage = ""
# iterate over sources dict
for source in list(sources.keys()):
if source in id:
credit = sources[source]["name"]
bgcolour = sources[source]["colour"]
if "referred_to_by" in artwork and len(artwork["referred_to_by"]) > 0 and "content" in artwork["referred_to_by"][0]:
text = artwork["referred_to_by"][0]["content"]
if artwork["subject_of"][0]["classified_as"][1]["id"] == "http://vocab.getty.edu/aat/300266277":
homepage = artwork["subject_of"][0]["id"]
text = text + "
Artwork homepage"
if "representation" in artwork:
if artwork["representation"][0]["id"] != "":
imageurl = artwork["representation"][0]["id"]
if "Harvard" in credit:
imageurl = imageurl + "?width=500&height=800"
if "begin_of_the_begin" in artwork["produced_by"]["timespan"]:
begin = artwork["produced_by"]["timespan"]["begin_of_the_begin"]
try:
begin = int(begin)
timespan_label = artwork["produced_by"]["timespan"]["_label"]
for idx in months:
if months[idx] in timespan_label:
begin = str(begin) + "-" + idx
break
except:
continue
coords = artwork["shows"]["represents"][0]["approximated_by"][0]["defined_by"]
coords = coords.replace("POINT(", "")
coords = coords.replace(")","")
coords = coords.split()
storymap["storymap"]["slides"].append(
{
"background": {
"color": bgcolour,
"opacity": 100
},
"date": str(begin),
"location": {
"lat": float(coords[0]),
"lon": float(coords[1]),
"zoom": 4
},
"media": {
"caption": artwork["produced_by"]["timespan"]["_label"],
"credit": credit,
"url": imageurl
},
"text": {
"headline": artwork["_label"],
"text": text
}
})
storymap["storymap"]["slides"].sort(key=lambda x: x["date"])
text_file = open(storymap_file, 'wt')
n = text_file.write(json.dumps(storymap,indent=2))
text_file.close()
print(json.dumps(storymap,indent=2))
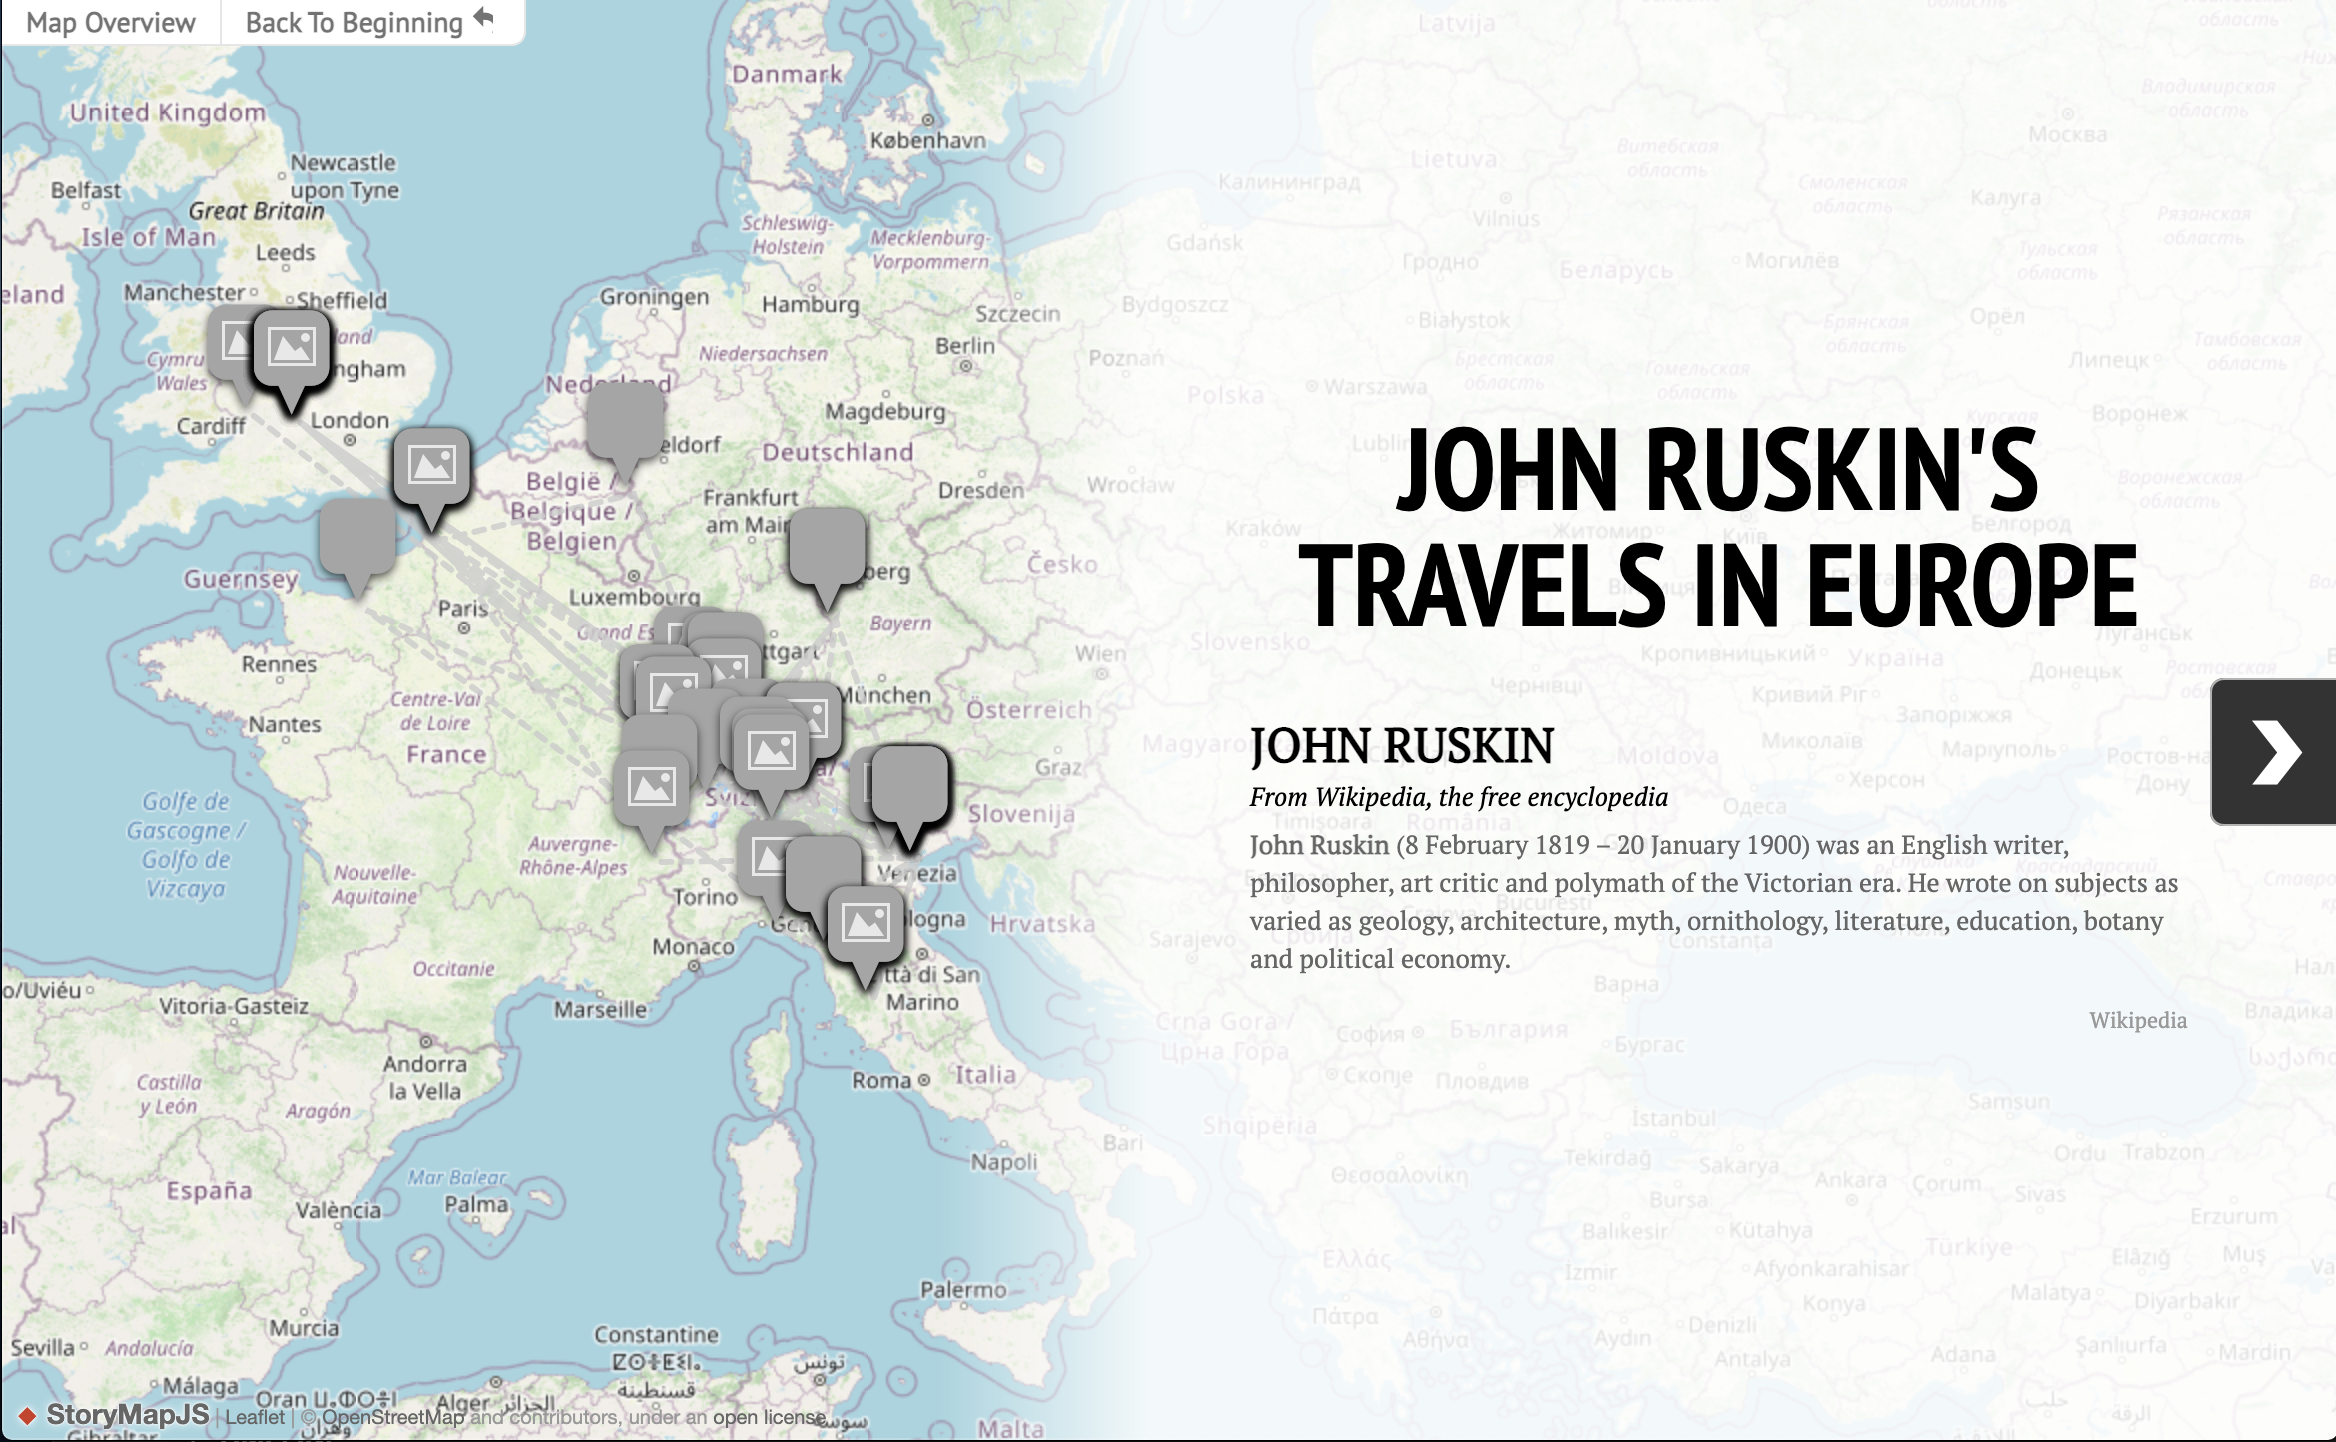
# ## Story Map Data Visualisation - John Ruskin's Travels in Europe
# ### Visualisation Screenshots
#
#
#
#
# ### Make Story Map Visualisation
# In[6]:
get_ipython().run_cell_magic('HTML', '', '\n\n\n\n\n\n\n')
# ## Online Visualisation
# The following visualisation uses KnightLabs online hosting service
#
# Ruskin StoryMap visualisation
#
# In[ ]:
# In[ ]:
 #
#
#
#  # ### Make Story Map Visualisation
# In[6]:
get_ipython().run_cell_magic('HTML', '', '\n\n\n\n\n\n\n')
# ## Online Visualisation
# The following visualisation uses KnightLabs online hosting service
#
# Ruskin StoryMap visualisation
#
# In[ ]:
# In[ ]:
# ### Make Story Map Visualisation
# In[6]:
get_ipython().run_cell_magic('HTML', '', '\n\n\n\n\n\n\n')
# ## Online Visualisation
# The following visualisation uses KnightLabs online hosting service
#
# Ruskin StoryMap visualisation
#
# In[ ]:
# In[ ]: