Slide 0: Instructions
- These are not ordinary slides: many are interactive and fully executable
- You'll want to be on a laptop or desktop. (For mobile, wait until I finish writing the blog version of this.)
- Make sure your browser is in full screen mode (F11) and zoom=100%
- Press the space bar to advance to the next slide
- To exit the slideshow and see the code, press
Alt-Ror click the "x"
The Joy of 3D 🎉
Visualizations for Teaching about Classification
Scott H. Hawley
Department of Chemistry & Physics
College of Sciences and Mathematics
Re:Teaching PHY/BSA 3895: "Deep Learning and AI Ethics," Fall 2021.
Scholarship of Teaching & Learning Symposium, Belmont University, April 28, 2021
Motivation
I like & teach machine learning (ML), esp. deep learning (DL). Lots of ML is classification. How humans & machines do it differently is the topic of my popular-level eBook-in-progess that uses interactive visualizations (instead of "math").

Recently many research papers (e.g., ML-audio) use "contrastive losses" -- ??
Turns out you can relate these to traditional (DL-based) classification if you view the latter a certain way -- "view" being the operative word!
Teaching ML: Viz, and Why 3D
*see my blog post "Naughty by Numbers: Classifications at Christmas"

I said "no math," but:
${\rm softmax}(x_i) = {e^{x_i} \over \sum\limits_j e^{x_j}} $.
3D gives you all of softmax's complexity & you can still picture it!
Viz Matters for Teaching
Data/sound viz has been an big part of my career, further influenced by Yang Hann Kim's 2016 Rossing Prize Lecture in Acoustics Education on viz in teaching STEM.

Viz for > 3D = 😢
 My blog post, "PCA from Scratch"
In 3D the representations are exact!
New Code Library: mrspuff
For teaching via visualization and running on Google Colab, and leveraging fast.ai.
Dimensions and Embeddings
Traditionally, we use triplets of numbers to denote 3 classes.
"Ground truth" values are "one-hot encoded":
cat: (1,0,0) dog: (0,1,0) horse: (0,0,1)
Model predictics class probabilities for images:


"Embedding": treat each triplet as the (x,y,z) coordinates of a point in 3D space:
# All the 3D plots in this talk are interactive. Use your mouse to rotate, etc!
TrianglePlot3D_Plotly(data, targ=None, labels=labels*2, show_bounds=False).do_plot()
Let's plot LOTS of points...
prob, targ = calc_prob(n=400)
TrianglePlot3D_Plotly(prob, targ=None, labels=labels, show_bounds=False).do_plot()
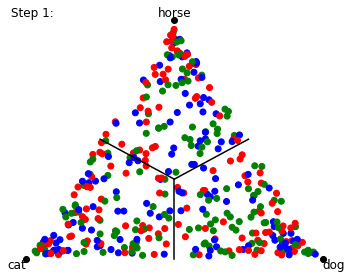
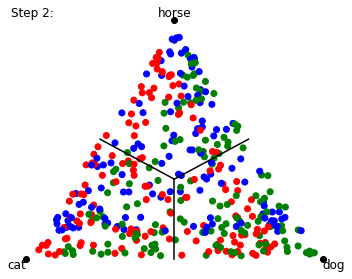
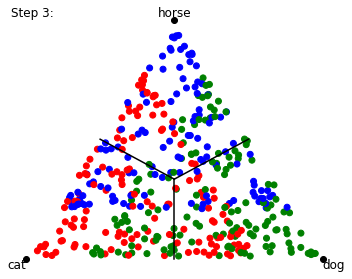
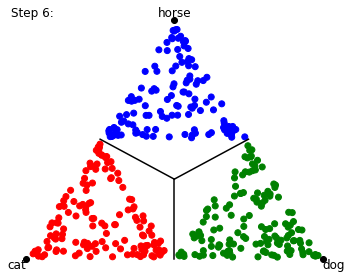
Let's color them by their target value / label, and show class boundaries:
TrianglePlot3D_Plotly(prob, targ=targ, labels=labels, show_bounds=True).do_plot()
3 Classes in 2D
Since points lie in a plane, we can change coord's & plot in 2D instead
(mouse hover = show image!)
urls = exhibit_urls(targ, labels)
TrianglePlot2D_Bokeh(prob, targ=targ, labels=labels, show_bounds=True, urls=urls).do_plot()


Loss vs. Accuracy
Loss: distance from target (continuous)
Accuracy: % of points on the correct side of decision boundary (discontinuous)
**Nearly identical losses:**


4 Classes in 3D: form a pyramid!
plot = TrianglePlot3D_Plotly(prob3, targ=targ4, labels=labels+['bird'], show_labels=True, show_axes=False, poles_included=True)
plot.fig.update_layout(scene_camera=dict( eye=dict(x=1.5, y=1, z=0.7)))
plot.do_plot()
Metric-Based Embedding Methods, OTOH...
...map similar points near each other, dissimilar points far away. => Clusters:
clusters = plot_clusters()
Contrastive Loss
Like attracts like; "Opposites" repel:
![]()
Tends to group things in "semantically meaningful" ways.
Siamese Networks
Identical twin network branches map to points ("feature vectors") in N-dim space:

Example of a Siamese Network (source: Sundin et al)
How well do they work?
Traditional vs. zero(/few)-shot methods: which one wins? It depends.
From high-scoring Kaggle competition entry using "entity embeddings":
"Entity embedding not only reduces memory usage and speeds up neural networks compared with one-hot encoding, but more importantly by mapping similar values close to each other in the embedding space it reveals the intrinsic properties of the categorical variables."
Let's look at "PETS," via my mod of FastAI's tutorial on Siamese Networks...


Final thoughts
- 3D for teaching: robust yet viz-able, can help re. loss & accuracy
- Embeddings are just mappings to points in space
- Contrastive losses help give semantically meaningful embeddings
- Note that real-world embeddings often require >> 3D (e.g. 128D)
mrspufflib TODO:- Live tracking of data points during training
- Real images for points
- Add URLs to FastAI image data type / bunch / loader
Acknowledgements
Thanks to Zach Mueller, Tanishq Abraham and Isaac Flath for help with fastai!
References:
- "Siamese and triplet learning with online pair/triplet mining" by Adam Bielski
- Example of new `Pipeline` class to create data for a Siamese model," by Jeremy Howard
- "Siamese Network & Triplet Loss" by Rohith Gandhi
- pytorch-metric-learning by Kevin Musgrave
- "Contrastive Loss Explained" by Brian Williams
- "Bootstrap Your Own Latent (BYOL)" by Grill et al
- "Siamese Neural Networks for One-shot Image Recognition" by Koch et al
- "Few Shot Learning" by msiam
- "Learning to learn, Low shot learning" by Katerina Fragkiadaki
- "Embarassingly Simple": "We describe azero-shot learning approach that can be implemented in just one line of code, yet it is able to outperform state of the art approaches on standard datasets"