Machine learning
$$ \newcommand{\eg}{{\it e.g.}} \newcommand{\ie}{{\it i.e.}} \newcommand{\argmin}{\operatornamewithlimits{argmin}} \newcommand{\mc}{\mathcal} \newcommand{\mb}{\mathbb} \newcommand{\mf}{\mathbf} \newcommand{\minimize}{{\text{minimize}}} \newcommand{\diag}{{\text{diag}}} \newcommand{\cond}{{\text{cond}}} \newcommand{\rank}{{\text{rank }}} \newcommand{\range}{{\mathcal{R}}} \newcommand{\null}{{\mathcal{N}}} \newcommand{\tr}{{\text{trace}}} \newcommand{\dom}{{\text{dom}}} \newcommand{\dist}{{\text{dist}}} \newcommand{\R}{\mathbf{R}} \newcommand{\SM}{\mathbf{S}} \newcommand{\ball}{\mathcal{B}} \newcommand{\bmat}[1]{\begin{bmatrix}#1\end{bmatrix}} \newcommand{\loss}{\ell} \newcommand{\eloss}{\mathbf{L}} \newcommand{\abs}[1]{| #1 |} \newcommand{\norm}[1]{\| #1 \|} \newcommand{\tp}{T} $$Data fitting
- we think $y\in\R$ and $x\in\R^d$ are (approximately) related by
$x$ is called the independent variable or feature vector
$y$ is called the outcome or response
or target or label or dependent variable
often $y$ is something we want to predict
we don't know the "true" relationship between $x$ and $y$
Features
Often $x$ is a vector of features:
Documents:
- $x$ is word count histogram for a document
Patient data:
- $x$ are patient attributes, test results, symptoms
Customers:
- $x$ is purchase history and other attributes of a customer
Where features come from
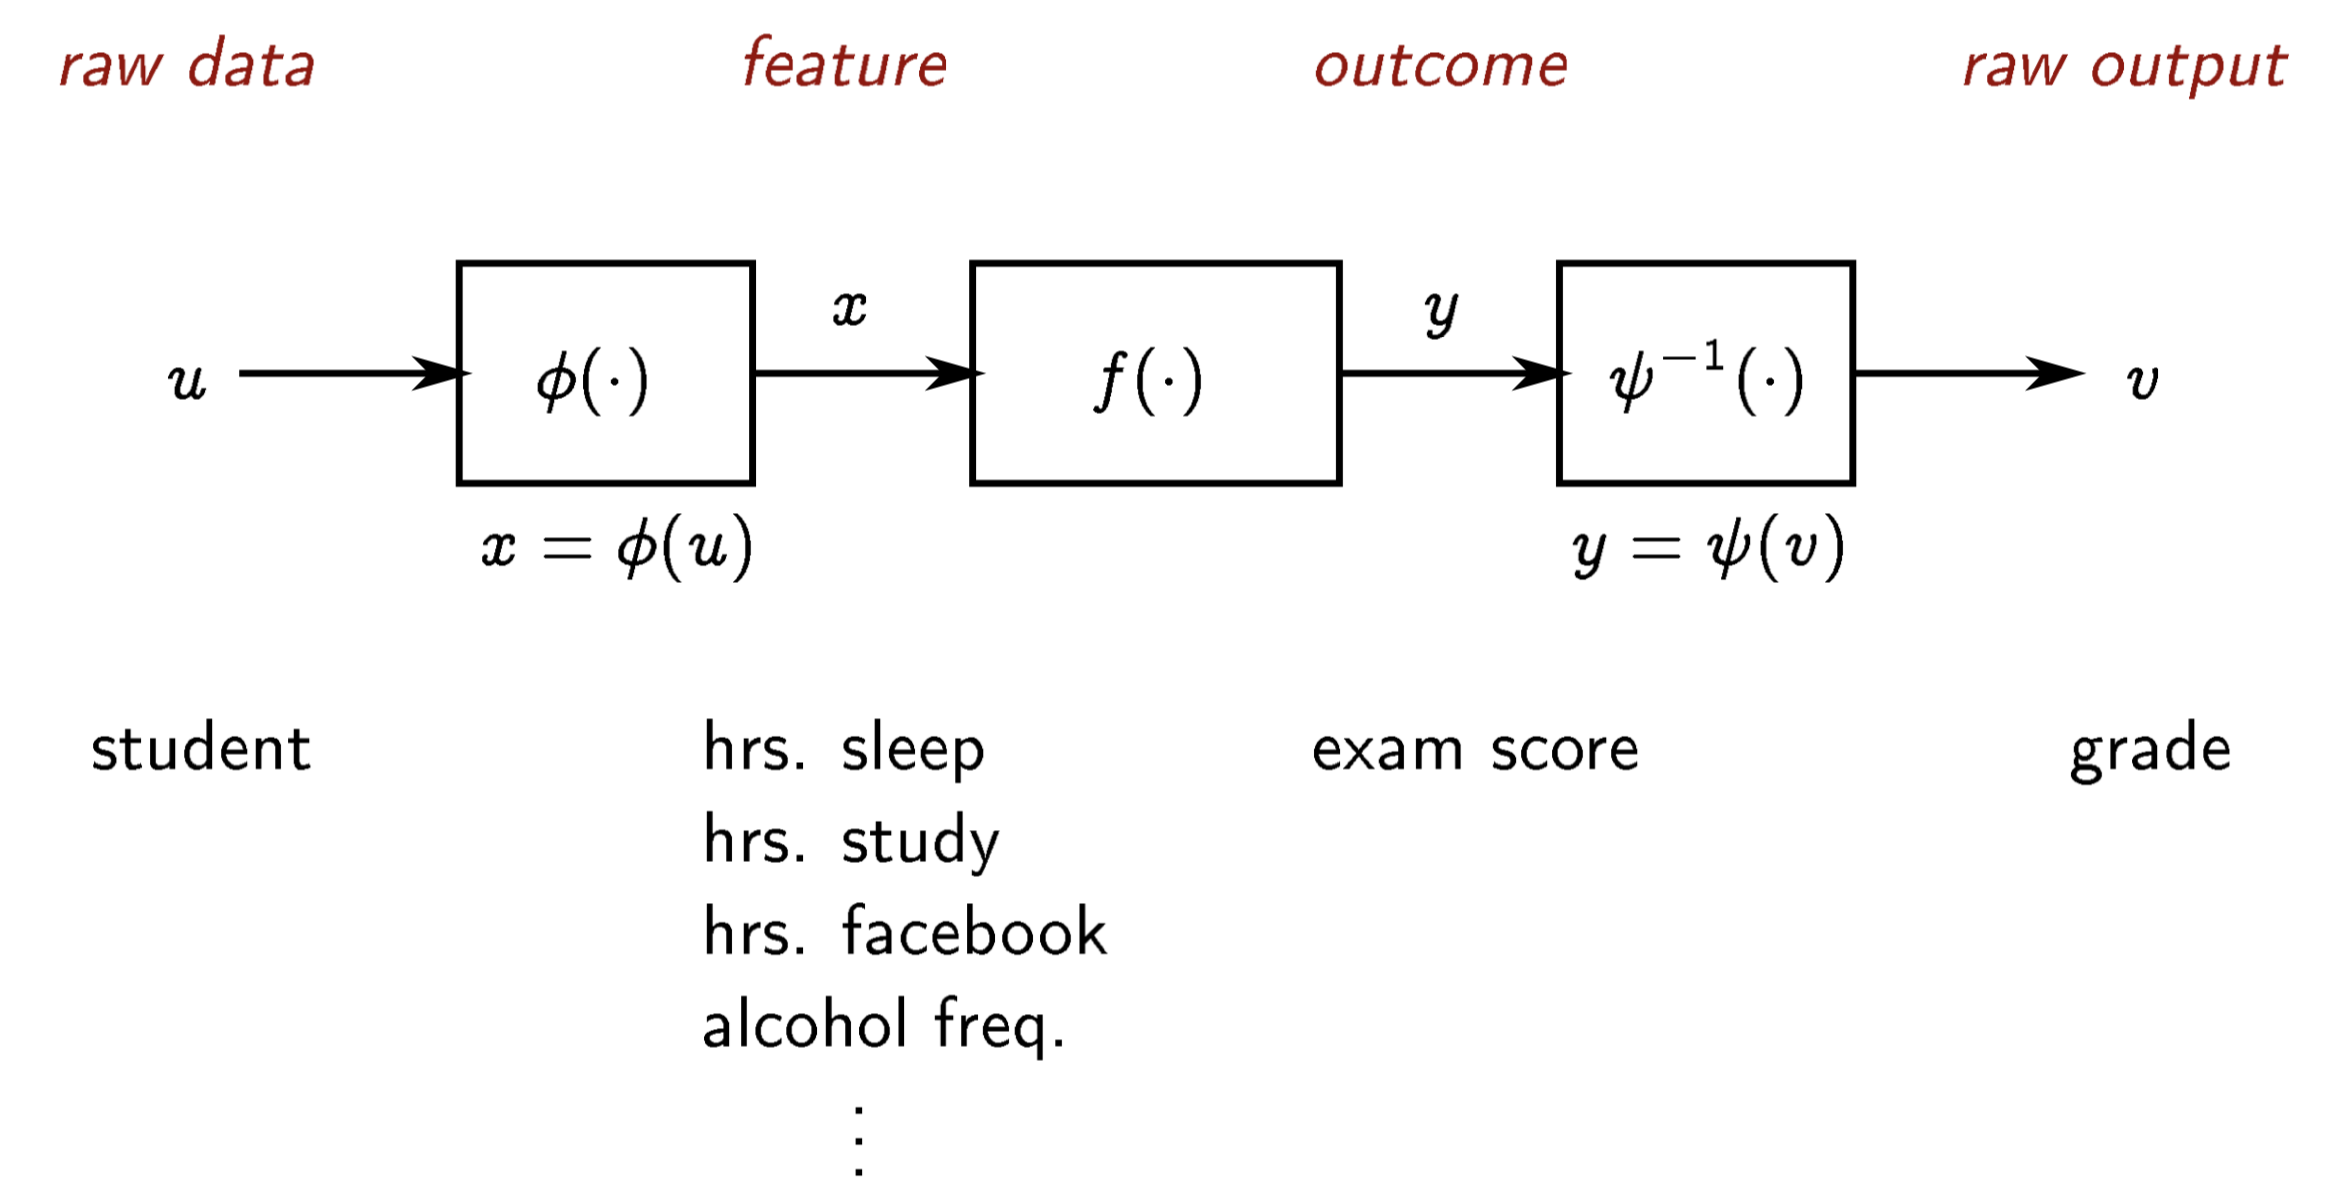
- we use $u$ to denote the raw input data, such as a vector, word or text,
image, video, audio, ...
$x = \phi(u)$ is the corresponding feature vector
the function $\phi$ is called the embedding or feature function
$\phi$ might be very simple or quite complicated
similarly, the raw output data $v$ can be featurized as $y=\psi(v)$
often we take $\phi(u)_1=x_1=1$, the constant feature
Data and prior knowledge
we are given data $x^1,\dots,x^n \in \R^d$ and $y^1,\dots,y^n \in \R$
$(x^i,y^i)$ is the $i$th data pair or observation or example
we also (might) have prior knowledge about what $f$ might look like, e.g., $f$ is smooth or continuous: $f(x) \approx f(\tilde x)$ when $x$ is near $\tilde x$, or we might know $y\geq 0$
Predictor
we seek a predictor or model $g:\R^d \rightarrow \R$
for feature vector $x$, our prediction (of $y$) is $\hat y = g(x)$
predictor $g$ is chosen based on both data and prior knowledge
in terms of raw data, our predictor is
$\hat y^i \approx y^i$ means our predictor does well on $i$th data pair
but **our real goal is to have $\hat y \approx y$
for $(x,y)$ pairs we have not seen**


Linear predictor
predictors that are linear functions of $x$ are widely used
a linear predictor has the form
for some vector $\theta\in \R^d$, called the predictor parameter vector
also called a regression model
$x_j$ is the $j$th feature, so the prediction is a linear combination of features
we get to choose the predictor parameter vector $\theta \in \R^d$
sometimes we write $g_\theta(x)$ to emphasize the dependence on $\theta$
Interpreting a linear predictor
$$ \hat y = g(x) = \theta_1 x_1 + \cdots + \theta_d x_d $$$\theta_3$ is the amount that prediction $\hat y = g(x)$ increases when $x_3$ increases by $1$
$\theta_7=0$ means that the prediction does not depend on $x_7$
$\theta$ small means predictor is insensitive to changes in $x$:
Affine predictor
suppose the first feature is constant, $x_1=1$
the linear predictor $g$ is then an affine function of $x_{2:d}$, i.e., linear plus a constant
- $\theta_1$ is called the offset or constant term
in the predictor
- $\theta_1$ is the prediction when all
features (except the constant) are zero
Loss function
a loss or risk function $\loss:\R \times \R \to \R$ quantifies how well (more accurately, how badly) $\hat y$ approximates $y$
smaller values of $\loss(\hat y, y)$ indicate that $\hat y$ is a good
approximation of $y$
- typically $\loss(y,y)=0$ and $\loss(\hat y,y)\geq 0$ for all $\hat y$, $y$
Examples
- quadratic loss:
- absolute loss:
- fractional error: for $\hat y, y >0$,
(often scaled by 100 to become percentage error)
Empirical risk
how well does the predictor $g$ fit a data set $(x^i,y^i)$, $i=1, \ldots, n$, with loss $\ell(\cdot,\cdot)$?
- the empirical risk is the average loss over the data points,
if $\eloss$ is small, the predictor predicts the given data well
when the predictor is parametrized by $\theta$, we write
to show the dependence on the predictor parameter $\theta$
Mean square error
- for square loss $\loss (\hat y, y) = (\hat y-y)^2$, empirical risk is
mean-square error (MSE)
$$ \eloss = \text{MSE} = \frac{1}{n} \sum_{i=1}^n \left(g(x^i)- y^i\right)^2 $$- often we use root-mean-square error,
$\text{RMSE} = \sqrt{\text{MSE}}$, which has same units/scale as outcomes $y^i$
Mean absolute error
- for absolute value $\loss (\hat y, y) = |\hat y-y|$, empirical risk is mean-absolute error
- has same units/scale as outcomes $y^i$
- similar to, but not the same as, mean-square error
Empirical risk minimization
how do we pick our prediction rule $g$?
- choosing the parameter $\theta$ in a parametrized
predictor $g_\theta(x)$ is called fitting the predictor (to data)
empirical risk minimization (ERM) is a general method for fitting a parametrized predictor
ERM: _choose $\theta$ to minimize
empirical risk $\eloss(\theta)$_
thus, ERM chooses $\theta$ by attempting to match given data
for the linear predictor $g_\theta(x)=\theta^T x$, we have
- often there is no analytic solution to this minimization problem, so we use numerical optimization to find $\theta$ that minimizes $\eloss(\theta)$
linear predictor $\hat y = g_\theta(x) = \theta^\tp x$
$\theta \in \R^d$ is the model parameter
we'll use square loss function $\loss(\hat y, y) = (\hat y - y)^2$
empirical risk is MSE
ERM: choose model parameter $\theta$ to minimize MSE
called linear least squares fitting
or linear regression
Least squares formulation
- express MSE in matrix notation as
where $X\in\R^{n \times d}$ and $y\in\R^n$ are
$$ X = \bmat{(x^1)^\tp \\ \vdots \\ (x^n)^\tp} \qquad y = \bmat{y^1 \\ \vdots \\ y^n} $$- ERM is a least squares problem: choose $\theta$ to minimize $\|X \theta - y\|^2$
(factor $1/n$ doesn't affect choice of $\theta$)
Least squares solution
the least squares problem: choose $\theta$ to minimize $\norm{X\theta-y}^2$
$X \in\R^{n \times d}$ is square or tall ($d \leq n$)
$\norm{X\theta-y}^2$ is called the objective function
assuming $X$ has linearly independent columns (which implies $n \geq d$), there is a unique optimal $\theta$
you are not recommended to explicitly form $X^\dagger=(X^\tp X)^{-1}X^\tp$; there are more efficient algorithms computing the least squares solution without explicitly using the above
for example in Python, a
numpyfunctionnumpy.linalg.lstsqefficiently solves it
import numpy as np
import matplotlib.pyplot as plt

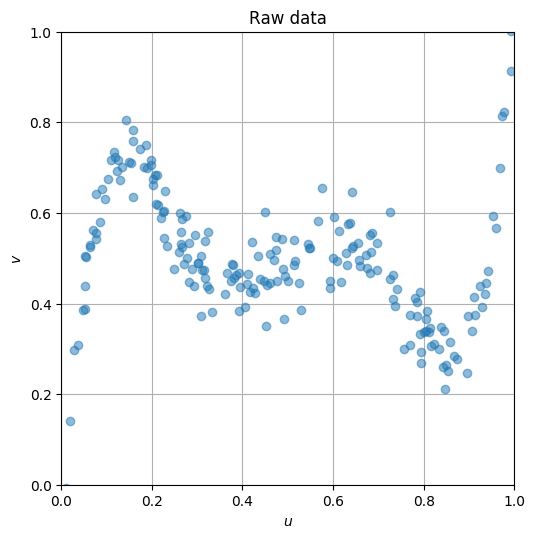
data = np.loadtxt('https://jonghank.github.io/ase3001/files/fit_data.csv', \
                  delimiter=',')
u, v = data[:,0], data[:,1]

plt.figure(figsize=(6,6), dpi=100)
plt.plot(u, v, 'o', alpha=0.5)
plt.grid()
plt.axis('square')
plt.xlim(0, 1)
plt.ylim(0, 1)
plt.xlabel(r'$u$')
plt.ylabel(r'$v$')
plt.title('Raw data')
plt.show()
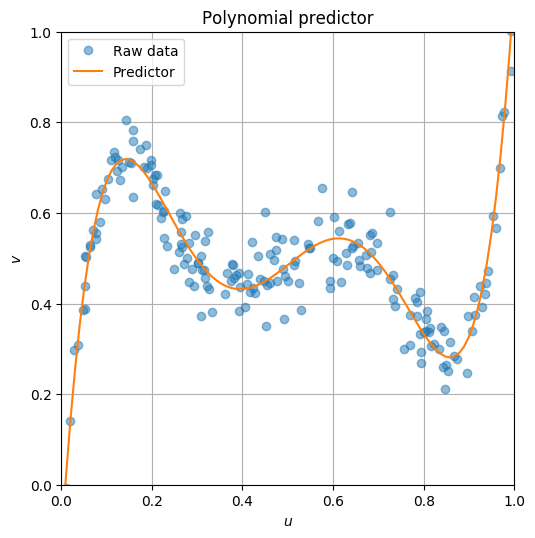
We will fit the data to a 5th order polynomial model,
\begin{align*} \hat{v} &= \theta_0 + \theta_1 u + \theta_2 u^2 + \theta_3 u^3 + \theta_4 u^4 + \theta_5 u^5 \\ &= \bmat{1 & u & u^2 & u^3 & u^4 & u^5 }\bmat{\theta_0 \\ \theta_1 \\ \theta_2 \\ \theta_3 \\ \theta_4 \\ \theta_5} \end{align*}so we will find $\theta = \bmat{\theta_0 & \cdots & \theta_5}^T$ such that $\hat{v}$ is overall close enough to $v$ for all given data points. In other words we'd like to find $\theta$ that minimizes
\begin{align*} \eloss\left(\theta\right) &= \sum_{i=1}^{n} \left(\hat{v}^i-v^i\right)^2 \\ &= \sum_{i=1}^{n} \left( \bmat{1 & u^i & (u^i)^2 & (u^i)^3 & (u^i)^4 & (u^i)^5} \bmat{\theta_0 \\ \theta_1 \\ \theta_2 \\ \theta_3 \\ \theta_4 \\ \theta_5} - v^i \right)^2 \\ &= \left\| \bmat{1 & u^1 & (u^1)^2 & (u^1)^3 & (u^1)^4 & (u^1)^5 \\ 1 & u^2 & (u^2)^2 & (u^2)^3 & (u^2)^4 & (u^2)^5 \\ \vdots & \vdots & \vdots & \vdots & \vdots & \vdots \\ 1 & u^n & (u^n)^2 & (u^n)^3 & (u^n)^4 & (u^n)^5 } \bmat{\theta_0 \\ \theta_1 \\ \theta_2 \\ \theta_3 \\ \theta_4 \\ \theta_5} - v^i \right\|_2^2 \\ &= \left\| X \theta - y \right\|_2^2 \end{align*}where
$$ X = \bmat{1 & u^1 & (u^1)^2 & (u^1)^3 & (u^1)^4 & (u^1)^5 \\ 1 & u^2 & (u^2)^2 & (u^2)^3 & (u^2)^4 & (u^2)^5 \\ \vdots & \vdots & \vdots & \vdots & \vdots & \vdots \\ 1 & u^n & (u^n)^2 & (u^n)^3 & (u^n)^4 & (u^n)^5 } , \qquad y = \bmat{v^1 \\ v^2 \\ \vdots \\ v^n} $$n = len(u)
d = 6
X = np.zeros((n,d))
for i in range(d):
X[:,i] = u**i
y = v
theta_opt = np.linalg.lstsq(X, y, rcond=None)[0]
print(f'Optimal theta: {theta_opt}')
vp = np.linspace(0, 1, 100)
X_vp = np.zeros((len(vp),d))
for i in range(d):
X_vp[:,i] = vp**i;
plt.figure(figsize=(6,6), dpi=100)
plt.plot(u, v, 'o', alpha=0.5, label='Raw data')
plt.plot(vp, np.dot(X_vp, theta_opt), label='Predictor')
plt.grid()
plt.axis('square')
plt.xlim(0, 1)
plt.ylim(0, 1)
plt.xlabel(r'$u$')
plt.ylabel(r'$v$')
plt.title("Polynomial predictor")
plt.legend()
plt.show()
Optimal theta: [-1.08775601e-01  1.51579304e+01 -9.49190641e+01  2.39806312e+02
 -2.64399727e+02  1.05545151e+02]
Diabete progression
The following loads a list of medical records collected from 442 patients, where each row corresponds to a patient's medical record, with the first 10 columns standing for the 10 explanatory variables (age, bmi, bp, ... ), and the last column being the outcome $y$, the measure of diabetes pregression over a year.
import pandas as pd

df = pd.read_csv('https://jonghank.github.io/ase3001/files/diabetes_data.txt', \
                 delimiter='\t')

df
| AGE | SEX | BMI | BP | S1 | S2 | S3 | S4 | S5 | S6 | Y | |
|---|---|---|---|---|---|---|---|---|---|---|---|
| 0 | 59 | 2 | 32.1 | 101.00 | 157 | 93.2 | 38.0 | 4.00 | 4.8598 | 87 | 151 |
| 1 | 48 | 1 | 21.6 | 87.00 | 183 | 103.2 | 70.0 | 3.00 | 3.8918 | 69 | 75 |
| 2 | 72 | 2 | 30.5 | 93.00 | 156 | 93.6 | 41.0 | 4.00 | 4.6728 | 85 | 141 |
| 3 | 24 | 1 | 25.3 | 84.00 | 198 | 131.4 | 40.0 | 5.00 | 4.8903 | 89 | 206 |
| 4 | 50 | 1 | 23.0 | 101.00 | 192 | 125.4 | 52.0 | 4.00 | 4.2905 | 80 | 135 |
| ... | ... | ... | ... | ... | ... | ... | ... | ... | ... | ... | ... |
| 437 | 60 | 2 | 28.2 | 112.00 | 185 | 113.8 | 42.0 | 4.00 | 4.9836 | 93 | 178 |
| 438 | 47 | 2 | 24.9 | 75.00 | 225 | 166.0 | 42.0 | 5.00 | 4.4427 | 102 | 104 |
| 439 | 60 | 2 | 24.9 | 99.67 | 162 | 106.6 | 43.0 | 3.77 | 4.1271 | 95 | 132 |
| 440 | 36 | 1 | 30.0 | 95.00 | 201 | 125.2 | 42.0 | 4.79 | 5.1299 | 85 | 220 |
| 441 | 36 | 1 | 19.6 | 71.00 | 250 | 133.2 | 97.0 | 3.00 | 4.5951 | 92 | 57 |
442 rows × 11 columns
We'd like to fit a linear model that predicts the measure of diabete progression over a year, from those 10 features (plus a constant feature).
n, d = df.shape
X = np.hstack((np.ones((n,1)), df.values[:,:-1]))
y = df.values[:,-1]

theta_opt = np.linalg.lstsq(X, y, rcond=None)[0]

MSE = np.linalg.norm(X.dot(theta_opt)-y)**2/n

print(f'MSE: {MSE}')
MSE: 2859.6963475867506
The following shows the prediction performance where the scatter points on the black line ($\hat{y}=y$) imply perfect prediction.
plt.figure(figsize=(6,6), dpi=100)
plt.plot(y, y, 'k')
plt.plot(y, X.dot(theta_opt), 'o', alpha=0.5)
plt.xlabel('y')
plt.ylabel(r'$\hat{y}$')
plt.axis('square')
plt.grid()
Now suppose we got a new medical record ($X_\text{new}$) from a new patient. The predicted diabete progress for the patient over the next year can be easily assed by the following, $\hat{y}_\text{new}=X_\text{new}\theta^*$. So you can get a rough idea on how much for this patient the diabetes will progress.
# note that each feature represents
# u1:  age
# u2:  sex
# u3:  bmi         body mass index
# u4:  map	       mean arterial pressure
# u5:  s1 (tc) :   total cholesterol
# u6:  s2 (ldl):   low density lipoprotein
# u7:  s3 (hdl):   high density lipoprotein
# u8:  s4 (tch):
# u9:  s5 (ltg):
# u10: s6 (glu):
# features:      age  sex      bmi   map      tc      ldl     hdl   tch       ltg    glu
X_JHK = np.array([41,   1,    18.3,   90,    171,    80.0,   74.9,    2,     4.75,  90.0])
X_JHK = np.hstack((1, X_JHK))

y_JHK = X_JHK.dot(theta_opt)

plt.figure(figsize=(6,6), dpi=100)
plt.plot(y, y, 'k')
plt.plot(y, X.dot(theta_opt), 'o', alpha=0.5)
plt.plot(y_JHK, y_JHK, 'ro', label='JHK')
plt.xlabel('y')
plt.ylabel(r'$\hat{y}$')
plt.legend()
plt.axis('square')
plt.grid()
Classification
Binary classification problem
We are given a set of data points $\left(x^{(i)},y^{(i)}\right)$, $i=1,\ldots, n$. The $x^{(i)} \in\R^d$ are feature vectors, while the $y^{(i)} \in \{\pm 1\}$ are associated boolean outcomes.
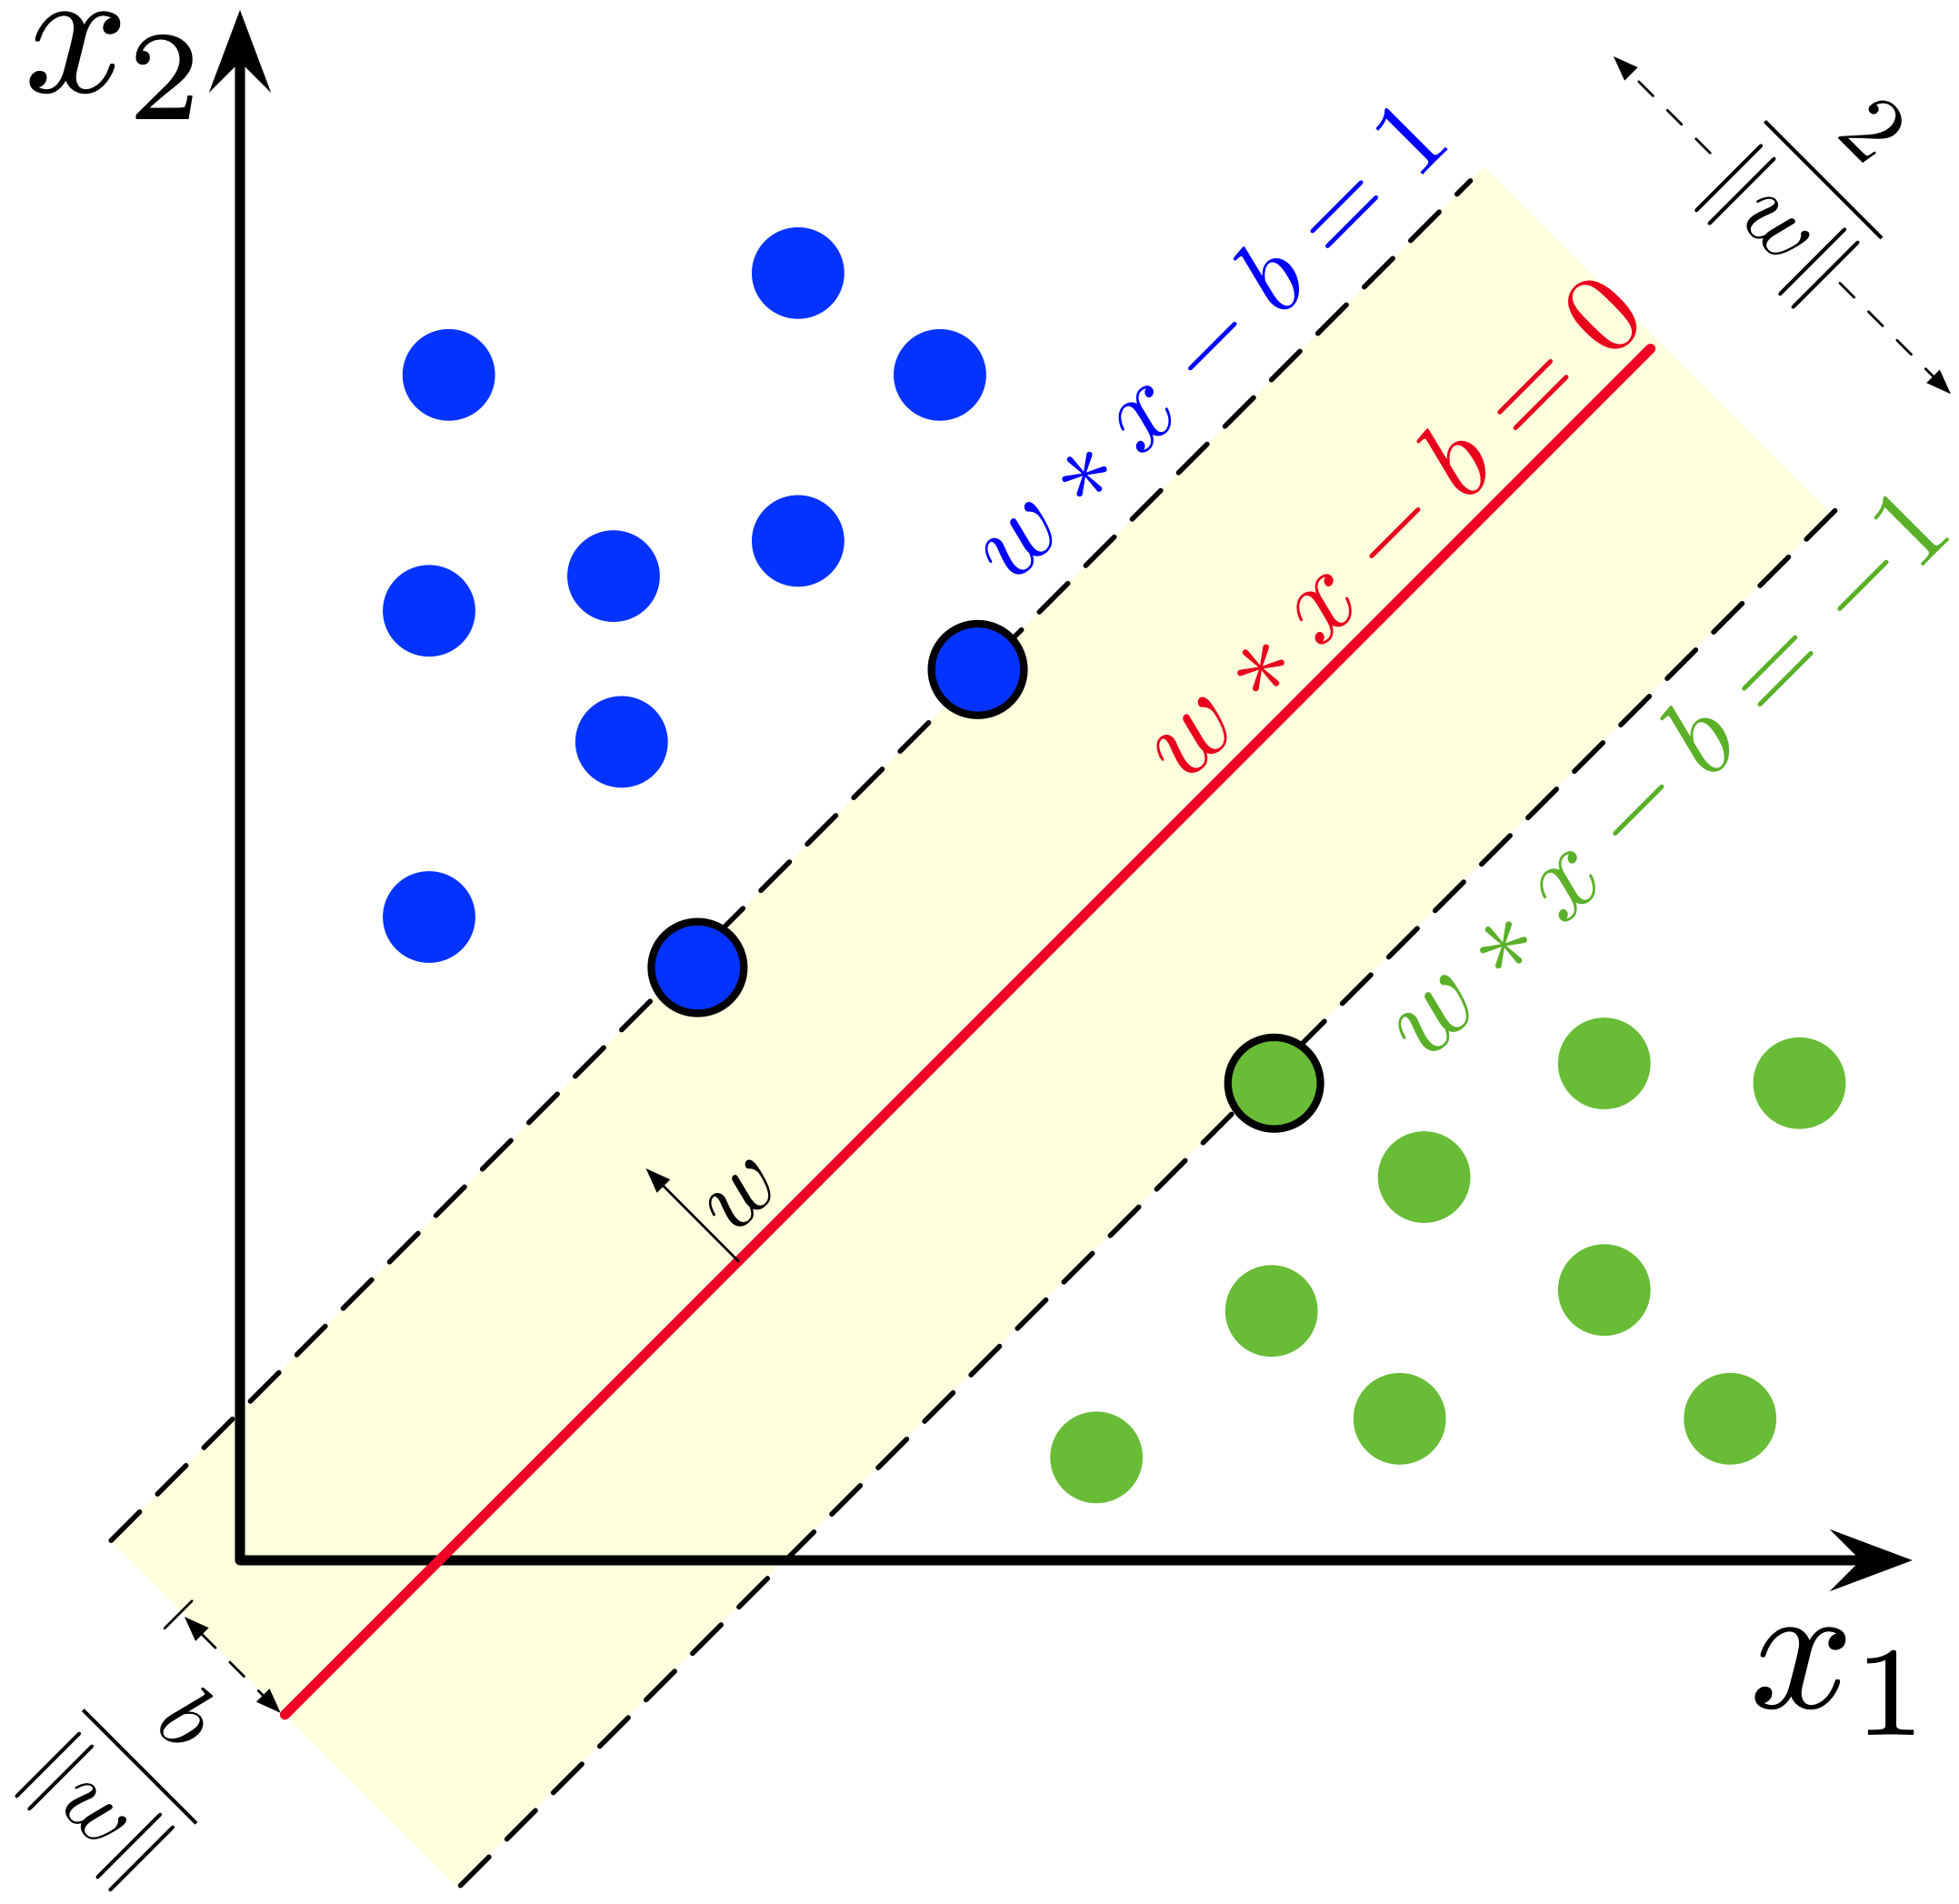
Our goal is to construct a good linear classifier $\hat{y}={\rm sign}(\tilde{y})$ based on the affine function $\tilde y = (w^T x - b)$, and we would like to find the classifier parameters $w$ and $b$ that make $\hat{y}^{(i)}$ and $y^{(i)}$ as close as possible for all $i$.
For this purpose, we define the loss function $\ell\left(\tilde{y}^{(i)}\right)$ that roughly tells how much $\hat{y}^{(i)}$ is close to ${y}^{(i)}$, and finally we find the optimal $w$ and $b$ that minimize the sum of the loss functions over all the given data set, $\left(x^{(i)},y^{(i)}\right)$, $i=1,\ldots, n$.
\begin{aligned} \underset{w,b}{\minimize} \quad& \sum_i \ell \left(\tilde{y}^{(i)}\right) \end{aligned}Support vector machine
For this purpose, we define the following two different loss functions for each class.
- For negative data, $y^{(i)}=-1$,
- For positive data, $y^{(i)}=1$,
The following cell displays these.
import numpy as np
import matplotlib.pyplot as plt

yhat = np.arange(-3, 3, 0.01)

plt.figure(figsize=(12,5))
plt.subplot(121)
plt.plot(yhat, (yhat>0), label='Neymann Pearson loss')
plt.plot(yhat, np.maximum(1+yhat,0), alpha=0.5, linewidth=4, label='Hinge loss')
plt.grid(), plt.legend(), plt.axis('equal'), plt.xlim(-3, 3)
plt.xlabel(r'$\tilde{y}$'), plt.ylabel('Loss')
plt.title('Loss for $y^{(i)}=-1$')
plt.subplot(122)
plt.plot(yhat, (yhat<0), label='Neymann Pearson loss')
plt.plot(yhat, np.maximum(1-yhat,0), alpha=0.5, linewidth=4, label='Hinge loss')
plt.grid(), plt.legend(), plt.axis('equal'), plt.xlim(-3, 3)
plt.xlabel(r'$\tilde{y}$'), plt.ylabel('Loss')
plt.title('Loss for $y^{(i)}=1$')
plt.show()
The classification problem was
\begin{aligned} \underset{w,b}{\minimize} \quad& \sum_i \ell \left(\tilde{y}^{(i)}\right) \end{aligned}which is identical to
\begin{aligned} \underset{w,b}{\minimize} \quad& \sum_{i:y^{(i)}=-1} \left(1+\tilde{y}^{(i)}\right)_+ + \sum_{i:y^{(i)}=1} \left(1-\tilde{y}^{(i)}\right)_+ \end{aligned}This is again equal to
\begin{aligned} \underset{w,b}{\minimize} \quad& \sum_i \left(1 - y^{(i)} \left( w^T x^{(i)}-b\right) \right)_+ \end{aligned}and with a 2-norm regularizer, we have the following problem.
\begin{aligned} \underset{w,b}{\minimize} \quad& \sum_i \left(1 - y^{(i)} \left( w^T x^{(i)}-b\right) \right)_+ + \lambda \| w\|_2^2 \end{aligned}The first term is the sum of the hinge loss values. The second term shrinks $w$ so that the margin of the classifier is maximized. The scalar $\lambda \geq 0$ is a (regularization) parameter. The above convex programming simultaneously selects features and fits the classifier.

The following presents an example with a 2 dimensional linearly separable dataset. Note that the loss term
$$\sum_i \left(1 - y^{(i)} \left( w^T x^{(i)}-b\right) \right)_+$$can be made zero, while maximizing the classifier margin.
np.random.seed(7030)
xp = np.random.randn(2,100)
xp[0,:] += 0.2*xp[1,:]
xp += 6*np.random.rand(2,1)
yp = np.ones(xp.shape[1])

xn = np.random.randn(2,200)
xn[0,:] -= 1*xn[1,:]
xn += -6*np.random.rand(2,1)
yn = -np.ones(xn.shape[1])

X = np.vstack((xp.T, xn.T))
y = np.hstack((yp, yn))

plt.figure(figsize=(6,6), dpi=100)
plt.plot(xp[0,:], xp[1,:], 'o', alpha=0.5, label=r'$y=1$')
plt.plot(xn[0,:], xn[1,:], 'o', alpha=0.5, label=r'$y=-1$')
plt.xlabel(r'$x_1$'), plt.ylabel(r'$x_2$')
plt.xlim([-6, 6]), plt.ylim([-6, 6])
plt.legend(), plt.grid()
plt.show()
def solve_svm(X, y, lam=1):

  import cvxpy as cp

  w = cp.Variable(X.shape[1])
  b = cp.Variable()

  obj = cp.sum(cp.pos(1-cp.multiply(y,(X@w-b))))
  reg = cp.sum_squares(w)
  problem = cp.Problem(cp.Minimize(obj + lam*reg))
  problem.solve(solver=cp.CLARABEL)

  return w.value, b.value, obj.value, reg.value
w_svm, b_svm, obj, reg = solve_svm(X, y, 1)

v1 = np.arange(-8, 8, 0.01)
v2 = (b_svm     - w_svm[0]*v1)/w_svm[1]
vp = (b_svm + 1 - w_svm[0]*v1)/w_svm[1]
vn = (b_svm - 1 - w_svm[0]*v1)/w_svm[1]

plt.figure(figsize=(6,6), dpi=100)
plt.plot(xp[0,:], xp[1,:], 'o', alpha=0.5, label=r'$y=1$')
plt.plot(xn[0,:], xn[1,:], 'o', alpha=0.5, label=r'$y=-1$')
plt.plot(v1, vp, '--', label=r'$w^Tx-b=1$')
plt.plot(v1, v2,       label=r'$w^Tx-b=0$')
plt.plot(v1, vn, '--', label=r'$w^Tx-b=-1$')
plt.xlabel(r'$x_1$'), plt.ylabel(r'$x_2$')
plt.title('Support vector machine on a linearly separable set')
plt.xlim([-6, 6]), plt.ylim([-6, 6])
plt.legend(), plt.grid()
plt.show()

print(f'Loss: {obj}')
print(f'Margin: {1/np.sqrt(reg)}')
Loss: 1.0398348848639216e-12
Margin: 1.1709001048371943
The same approach will do a good job on a linearly non-separable dataset, however in this case the loss is always positive.
np.random.seed(7030)
xp = np.random.randn(2,100)
xp[0,:] += 0.2*xp[1,:]
xp += 3*np.random.rand(2,1)
yp = np.ones(xp.shape[1])

xn = np.random.randn(2,200)
xn[0,:] -= 1*xn[1,:]
xn += -3*np.random.rand(2,1)
yn = -np.ones(xn.shape[1])

X = np.vstack((xp.T, xn.T))
y = np.hstack((yp, yn))

w_svm, b_svm, obj, reg = solve_svm(X, y, 1)

v1 = np.arange(-8, 8, 0.01)
v2 = (b_svm     - w_svm[0]*v1)/w_svm[1]
vp = (b_svm + 1 - w_svm[0]*v1)/w_svm[1]
vn = (b_svm - 1 - w_svm[0]*v1)/w_svm[1]

plt.figure(figsize=(6,6), dpi=100)
plt.plot(xp[0,:], xp[1,:], 'o', alpha=0.5, label=r'$y=1$')
plt.plot(xn[0,:], xn[1,:], 'o', alpha=0.5, label=r'$y=-1$')
plt.plot(v1, vp, '--', label=r'$w^Tx-b=1$')
plt.plot(v1, v2,       label=r'$w^Tx-b=0$')
plt.plot(v1, vn, '--', label=r'$w^Tx-b=-1$')
plt.xlabel(r'$x_1$'), plt.ylabel(r'$x_2$')
plt.title('Support vector machine on a linearly non-separable set')
plt.xlim([-6, 6]), plt.ylim([-6, 6])
plt.legend(), plt.grid()
plt.show()

print(f'Loss: {obj}')
print(f'Margin: {1/np.sqrt(reg)}')
Loss: 20.320000262722843
Margin: 0.4945546934313733
Logistic regression
Another popular classifier called the logistic regression can be obtained via the logistic loss function,
- For negative data, $y^{(i)}=-1$,
- For positive data, $y^{(i)}=1$,
Hence the logistic regression problem is:
\begin{aligned} \underset{w,b}{\minimize} \quad& \sum_i \log \left(1 + e^{-y^{(i)}\left( w^T x^{(i)}-b\right)} \right) + \lambda \| w\|_2^2 \end{aligned}The following cell displays the logistic loss functions.
import numpy as np
import matplotlib.pyplot as plt

ytilde = np.arange(-3, 3, 0.01)

plt.figure(figsize=(12,5), dpi=100)
plt.subplot(121)
plt.plot(ytilde, (ytilde>0), label='Neymann Pearson loss')
plt.plot(ytilde, np.maximum(1+ytilde,0), alpha=0.5, linewidth=4, label='Hinge loss')
plt.plot(ytilde, np.log(1+np.exp(ytilde)), alpha=0.5, linewidth=4, label='Logistic loss')
plt.grid(), plt.legend(), plt.axis('equal'), plt.xlim(-3, 3)
plt.xlabel(r'$\tilde{y}$'), plt.ylabel('Loss')
plt.title('Loss for $y^{(i)}=-1$')
plt.subplot(122)
plt.plot(ytilde, (ytilde<0), label='Neymann Pearson loss')
plt.plot(ytilde, np.maximum(1-ytilde,0), alpha=0.5, linewidth=4, label='Hinge loss')
plt.plot(ytilde, np.log(1+np.exp(-ytilde)), alpha=0.5, linewidth=4, label='Logistic loss')
plt.grid(), plt.legend(), plt.axis('equal'), plt.xlim(-3, 3)
plt.xlabel(r'$\tilde{y}$'), plt.ylabel('Loss')
plt.title('Loss for $y^{(i)}=1$')
plt.show()
def solve_logistic_regression(X, y, lam=1):

  import cvxpy as cp

  w = cp.Variable(X.shape[1])
  b = cp.Variable()

  obj = cp.sum(cp.logistic(-cp.multiply(y,(X@w-b))))
  reg = cp.sum_squares(w)
  problem = cp.Problem(cp.Minimize(obj + lam*reg))
  problem.solve(solver=cp.CLARABEL)

  return w.value, b.value, obj.value, reg.value
Results from the support vector machine and the logistic classifier on the same data set are compared below.
np.random.seed(7030)
xp = np.random.randn(2,100)
xp[0,:] += 0.5*xp[1,:]
xp += 5*np.random.rand(2,1)
yp = np.ones(xp.shape[1])

xn = np.random.randn(2,200)
xn[0,:] -= xn[1,:]
xn += -5*np.random.rand(2,1)
yn = -np.ones(xn.shape[1])

X = np.vstack((xp.T, xn.T))
y = np.hstack((yp, yn))

plt.figure(figsize=(6,6), dpi=100)
plt.plot(xp[0,:], xp[1,:], 'o', alpha=0.5, label=r'$y=1$')
plt.plot(xn[0,:], xn[1,:], 'o', alpha=0.5, label=r'$y=-1$')
plt.xlabel(r'$x_1$'), plt.ylabel(r'$x_2$')
plt.xlim([-6, 6]), plt.ylim([-6, 6])
plt.legend(), plt.grid()
plt.show()
w_svm, b_svm, obj_svm, reg_svm, = solve_svm(X, y, 1)
w_log, b_log, obj_log, reg_log, = solve_logistic_regression(X, y, 1)

v1_svm = np.arange(-8, 8, 0.01)
v2_svm = (b_svm - w_svm[0]*v1_svm)/w_svm[1]

v1_log = np.arange(-8, 8, 0.01)
v2_log = (b_log - w_log[0]*v1_log)/w_log[1]

plt.figure(figsize=(6,6), dpi=100)
plt.plot(xp[0,:], xp[1,:], 'o', alpha=0.5, label=r'$y=1$')
plt.plot(xn[0,:], xn[1,:], 'o', alpha=0.5, label=r'$y=-1$')
plt.plot(v1_svm, v2_svm, label='Support vector machine')
plt.plot(v1_log, v2_log, label='Logistic regression')
plt.xlabel(r'$x_1$'), plt.ylabel(r'$x_2$')
plt.title('Binary classifiers')
plt.xlim([-6, 6]), plt.ylim([-6, 6])
plt.legend(), plt.grid()
plt.show()
