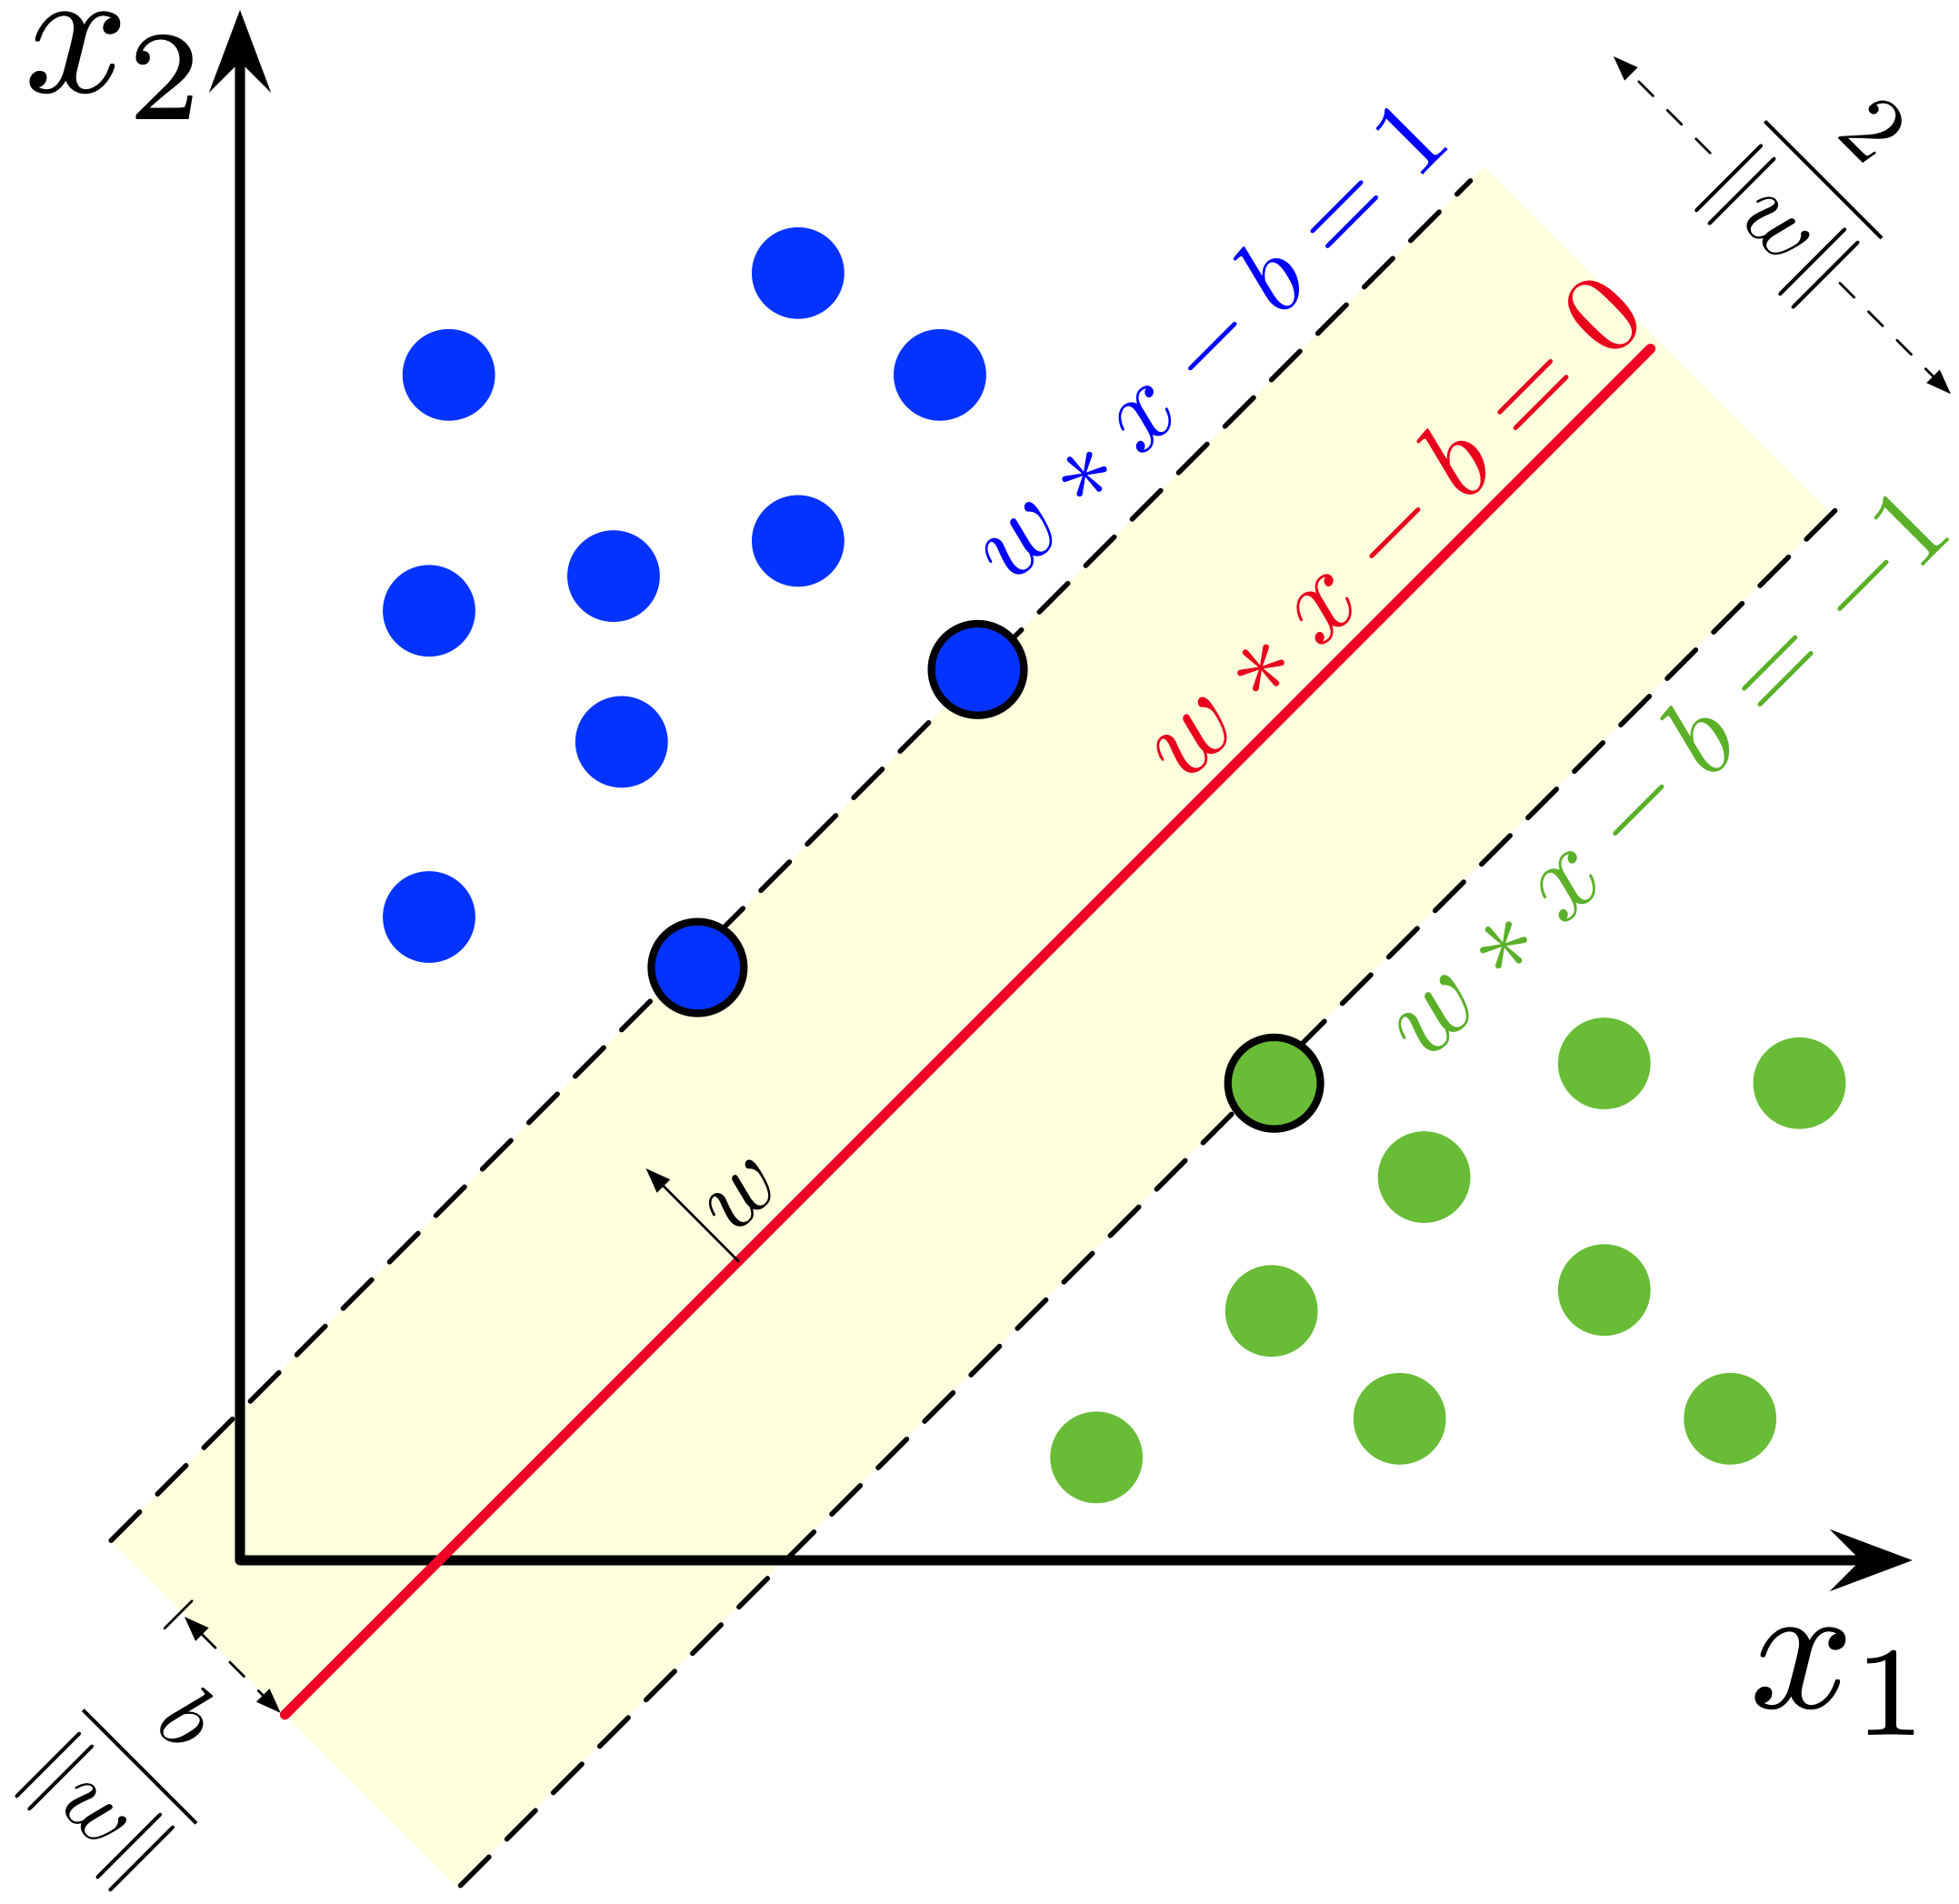
Support vector machine
$$ \newcommand{\eg}{{\it e.g.}} \newcommand{\ie}{{\it i.e.}} \newcommand{\argmin}{\operatornamewithlimits{argmin}} \newcommand{\mc}{\mathcal} \newcommand{\mb}{\mathbb} \newcommand{\mf}{\mathbf} \newcommand{\minimize}{{\text{minimize}}} \newcommand{\argmin}{{\text{argmin}}} \newcommand{\diag}{{\text{diag}}} \newcommand{\cond}{{\text{cond}}} \newcommand{\rank}{{\text{rank }}} \newcommand{\range}{{\mathcal{R}}} \newcommand{\null}{{\mathcal{N}}} \newcommand{\tr}{{\text{trace}}} \newcommand{\dom}{{\text{dom}}} \newcommand{\dist}{{\text{dist}}} \newcommand{\E}{\mathbf{E}} \newcommand{\var}{\mathbf{var}} \newcommand{\R}{\mathbf{R}} \newcommand{\B}{\mathbf{B}} \newcommand{\SM}{\mathbf{S}} \newcommand{\ball}{\mathcal{B}} \newcommand{\onev}{\mathbf{1}} \newcommand{\bmat}[1]{\begin{bmatrix}#1\end{bmatrix}} $$Binary classification problem
We are given a set of data points $\left(x^{(i)},y^{(i)}\right)$, $i=1,\ldots, n$. The $x^{(i)} \in\R^d$ are feature vectors, while the $y^{(i)} \in \{\pm 1\}$ are associated boolean outcomes.
Our goal is to construct a good linear classifier $\hat{y}={\rm sign}(\tilde{y})$ based on the affine function $\tilde y = (w^T x - b)$, and we would like to find the classifier parameters $w$ and $b$ that make $\hat{y}^{(i)}$ and $y^{(i)}$ as close as possible for all $i$.
For this purpose, we define the loss function $\ell\left(\tilde{y}^{(i)}\right)$ that roughly tells how much $\hat{y}^{(i)}$ is close to ${y}^{(i)}$, and finally we find the optimal $w$ and $b$ that minimize the sum of the loss functions over all the given data set, $\left(x^{(i)},y^{(i)}\right)$, $i=1,\ldots, n$.
\begin{aligned} \underset{w,b}{\minimize} \quad& \sum_i \ell \left(\tilde{y}^{(i)}\right) \end{aligned}Support vector machine
For this purpose, we define the following two different loss functions for each class.
- For negative data, $y^{(i)}=-1$,
- For positive data, $y^{(i)}=1$,
The following cell displays these.
import numpy as np
import matplotlib.pyplot as plt

yhat = np.arange(-3, 3, 0.01)

plt.figure(figsize=(12,5))
plt.subplot(121)
plt.plot(yhat, (yhat>0), label='Neymann Pearson loss')
plt.plot(yhat, np.maximum(1+yhat,0), alpha=0.5, linewidth=4, label='Hinge loss')
plt.grid(), plt.legend(), plt.axis('equal'), plt.xlim(-3, 3)
plt.xlabel(r'$\tilde{y}$'), plt.ylabel('Loss')
plt.title('Loss for $y^{(i)}=-1$')
plt.subplot(122)
plt.plot(yhat, (yhat<0), label='Neymann Pearson loss')
plt.plot(yhat, np.maximum(1-yhat,0), alpha=0.5, linewidth=4, label='Hinge loss')
plt.grid(), plt.legend(), plt.axis('equal'), plt.xlim(-3, 3)
plt.xlabel(r'$\tilde{y}$'), plt.ylabel('Loss')
plt.title('Loss for $y^{(i)}=1$')
plt.show()
The classification problem was
\begin{aligned} \underset{w,b}{\minimize} \quad& \sum_i \ell \left(\tilde{y}^{(i)}\right) \end{aligned}which is identical to
\begin{aligned} \underset{w,b}{\minimize} \quad& \sum_{i:y^{(i)}=-1} \left(1+\tilde{y}^{(i)}\right)_+ + \sum_{i:y^{(i)}=1} \left(1-\tilde{y}^{(i)}\right)_+ \end{aligned}This is again equal to
\begin{aligned} \underset{w,b}{\minimize} \quad& \sum_i \left(1 - y^{(i)} \left( w^T x^{(i)}-b\right) \right)_+ \end{aligned}and with a 2-norm regularizer, we have the following problem.
\begin{aligned} \underset{w,b}{\minimize} \quad& \sum_i \left(1 - y^{(i)} \left( w^T x^{(i)}-b\right) \right)_+ + \lambda \| w\|_2^2 \end{aligned}The first term is the sum of the hinge loss values. The second term shrinks $w$ so that the margin of the classifier is maximized. The scalar $\lambda \geq 0$ is a (regularization) parameter. The above convex programming simultaneously selects features and fits the classifier.

The following presents an example with a 2 dimensional linearly separable dataset. Note that the loss term
$$\sum_i \left(1 - y^{(i)} \left( w^T x^{(i)}-b\right) \right)_+$$can be made zero, while maximizing the classifier margin.
np.random.seed(7030)
xp = np.random.randn(2,100)
xp[0,:] += 0.2*xp[1,:]
xp += 6*np.random.rand(2,1)
yp = np.ones(xp.shape[1])

xn = np.random.randn(2,200)
xn[0,:] -= 1*xn[1,:]
xn += -6*np.random.rand(2,1)
yn = -np.ones(xn.shape[1])

plt.figure(figsize=(8,8), dpi=100)
plt.plot(xp[0,:], xp[1,:], 'o', alpha=0.5, label=r'$y=1$')
plt.plot(xn[0,:], xn[1,:], 'o', alpha=0.5, label=r'$y=-1$')
plt.xlabel(r'$x_1$'), plt.ylabel(r'$x_2$')
plt.xlim([-6, 6]), plt.ylim([-6, 6])
plt.legend(), plt.grid()
plt.show()
import cvxpy as cp

X = np.vstack((xp.T, xn.T))
y = np.hstack((yp, yn))
onev = np.ones(len(y))

w = cp.Variable(2)
b = cp.Variable()

obj = cp.sum(cp.pos(1-cp.multiply(y,(X@w-onev*b))))

reg = cp.sum_squares(w)
problem = cp.Problem(cp.Minimize(obj + reg))
problem.solve()
w_svm = w.value
b_svm = b.value

v1 = np.arange(-8, 8, 0.01)
v2 = (b_svm     - w_svm[0]*v1)/w_svm[1]
vp = (b_svm + 1 - w_svm[0]*v1)/w_svm[1]
vn = (b_svm - 1 - w_svm[0]*v1)/w_svm[1]

plt.figure(figsize=(8,8), dpi=100)
plt.plot(xp[0,:], xp[1,:], 'o', alpha=0.5, label=r'$y=1$')
plt.plot(xn[0,:], xn[1,:], 'o', alpha=0.5, label=r'$y=-1$')
plt.plot(v1, vp, '--', label=r'$w^Tx-b=1$')
plt.plot(v1, v2,       label=r'$w^Tx-b=0$')
plt.plot(v1, vn, '--', label=r'$w^Tx-b=-1$')
plt.xlabel(r'$x_1$'), plt.ylabel(r'$x_2$')
plt.title('Support vector machine on a linearly separable set')
plt.xlim([-6, 6]), plt.ylim([-6, 6])
plt.legend(), plt.grid()
plt.show()

print(f'Loss: {obj.value}')
print(f'Margin: {1/np.sqrt(reg.value)}')
Loss: 0.0
Margin: 1.1709001048370913
The same approach will do a good job on a linearly non-separable dataset, however in this case the loss is always positive.
np.random.seed(7030)
xp = np.random.randn(2,100)
xp[0,:] += 0.2*xp[1,:]
xp += 3*np.random.rand(2,1)
yp = np.ones(xp.shape[1])

xn = np.random.randn(2,200)
xn[0,:] -= 1*xn[1,:]
xn += -3*np.random.rand(2,1)
yn = -np.ones(xn.shape[1])

import cvxpy as cp

X = np.vstack((xp.T, xn.T))
y = np.hstack((yp, yn))
onev = np.ones(len(y))

w = cp.Variable(2)
b = cp.Variable()

obj = cp.sum(cp.pos(1-cp.multiply(y,(X@w-onev*b))))
reg = cp.sum_squares(w)
problem = cp.Problem(cp.Minimize(obj + reg))
problem.solve()
w_svm = w.value
b_svm = b.value

v1 = np.arange(-8, 8, 0.01)
v2 = (b_svm     - w_svm[0]*v1)/w_svm[1]
vp = (b_svm + 1 - w_svm[0]*v1)/w_svm[1]
vn = (b_svm - 1 - w_svm[0]*v1)/w_svm[1]

plt.figure(figsize=(8,8), dpi=100)
plt.plot(xp[0,:], xp[1,:], 'o', alpha=0.5, label=r'$y=1$')
plt.plot(xn[0,:], xn[1,:], 'o', alpha=0.5, label=r'$y=-1$')
plt.plot(v1, vp, '--', label=r'$w^Tx-b=1$')
plt.plot(v1, v2,       label=r'$w^Tx-b=0$')
plt.plot(v1, vn, '--', label=r'$w^Tx-b=-1$')
plt.xlabel(r'$x_1$'), plt.ylabel(r'$x_2$')
plt.title('Support vector machine on a linearly non-separable set')
plt.xlim([-6, 6]), plt.ylim([-6, 6])
plt.legend(), plt.grid()
plt.show()

print(f'Loss: {obj.value}')
print(f'Margin: {1/np.sqrt(reg.value)}')
Loss: 20.32000096685046
Margin: 0.49455473606178324
Logistic regression
Another popular classifier called the logistic regression can be obtained via the logistic loss function,
- For negative data, $y^{(i)}=-1$,
- For positive data, $y^{(i)}=1$,
Hence the logistic regression problem is:
\begin{aligned} \underset{w,b}{\minimize} \quad& \sum_i \log \left(1 + e^{-y^{(i)}\left( w^T x^{(i)}-b\right)} \right) + \lambda \| w\|_2^2 \end{aligned}The following cell displays the logistic loss functions.
import numpy as np
import matplotlib.pyplot as plt

ytilde = np.arange(-3, 3, 0.01)

plt.figure(figsize=(14,8), dpi=100)
plt.subplot(121)
plt.plot(ytilde, (ytilde>0), label='Neymann Pearson loss')
plt.plot(ytilde, np.maximum(1+ytilde,0), alpha=0.5, linewidth=4, label='Hinge loss')
plt.plot(ytilde, np.log(1+np.exp(ytilde)), alpha=0.5, linewidth=4, label='Logistic loss')
plt.grid(), plt.legend(), plt.axis('equal'), plt.xlim(-3, 3)
plt.xlabel(r'$\tilde{y}$'), plt.ylabel('Loss')
plt.title('Loss for $y^{(i)}=-1$')
plt.subplot(122)
plt.plot(ytilde, (ytilde<0), label='Neymann Pearson loss')
plt.plot(ytilde, np.maximum(1-ytilde,0), alpha=0.5, linewidth=4, label='Hinge loss')
plt.plot(ytilde, np.log(1+np.exp(-ytilde)), alpha=0.5, linewidth=4, label='Logistic loss')
plt.grid(), plt.legend(), plt.axis('equal'), plt.xlim(-3, 3)
plt.xlabel(r'$\tilde{y}$'), plt.ylabel('Loss')
plt.title('Loss for $y^{(i)}=1$')
plt.show()
Results from the support vector machine and the logistic classifier on the same data set are compared below.
np.random.seed(7030)
xp = np.random.randn(2,100)
xp[0,:] += 0.5*xp[1,:]
xp += 5*np.random.rand(2,1)
yp = np.ones(xp.shape[1])

xn = np.random.randn(2,200)
xn[0,:] -= xn[1,:]
xn += -5*np.random.rand(2,1)
yn = -np.ones(xn.shape[1])

X = np.vstack((xp.T, xn.T))
y = np.hstack((yp, yn))
onev = np.ones(len(y))

w = cp.Variable(2)
b = cp.Variable()

obj_svm = cp.sum(cp.pos(1-cp.multiply(y,(X@w-onev*b))))
obj_log = cp.sum(cp.logistic(-cp.multiply(y,(X@w-onev*b))))

reg = cp.sum_squares(w)

problem = cp.Problem(cp.Minimize(obj_svm + reg)).solve()
w_svm, b_svm = w.value, b.value

problem = cp.Problem(cp.Minimize(obj_log + reg)).solve()
w_log, b_log = w.value, b.value

v1_svm = np.arange(-8, 8, 0.01)
v2_svm = (b_svm - w_svm[0]*v1_svm)/w_svm[1]

v1_log = np.arange(-8, 8, 0.01)
v2_log = (b_log - w_log[0]*v1_log)/w_log[1]

plt.figure(figsize=(8,8), dpi=100)
plt.plot(xp[0,:], xp[1,:], 'o', alpha=0.5, label=r'$y=1$')
plt.plot(xn[0,:], xn[1,:], 'o', alpha=0.5, label=r'$y=-1$')
plt.plot(v1_svm, v2_svm, label='Support vector machine')
plt.plot(v1_log, v2_log, label='Logistic regression')
plt.xlabel(r'$x_1$'), plt.ylabel(r'$x_2$')
plt.title('Binary classifiers')
plt.xlim([-6, 6]), plt.ylim([-6, 6])
plt.legend(), plt.grid()
plt.show()