![]()
ASE1302 - Final exam
$$ \newcommand{\eg}{{\it e.g.}} \newcommand{\ie}{{\it i.e.}} \newcommand{\argmin}{\operatornamewithlimits{argmin}} \newcommand{\mc}{\mathcal} \newcommand{\mb}{\mathbb} \newcommand{\mf}{\mathbf} \newcommand{\minimize}{{\text{minimize}}} \newcommand{\diag}{{\text{diag}}} \newcommand{\cond}{{\text{cond}}} \newcommand{\rank}{{\text{rank }}} \newcommand{\range}{{\mathcal{R}}} \newcommand{\null}{{\mathcal{N}}} \newcommand{\tr}{{\text{trace}}} \newcommand{\dom}{{\text{dom}}} \newcommand{\dist}{{\text{dist}}} \newcommand{\R}{\mathbf{R}} \newcommand{\Z}{\mathbf{Z}} \newcommand{\SM}{\mathbf{S}} \newcommand{\ball}{\mathcal{B}} \newcommand{\bmat}[1]{\begin{bmatrix}#1\end{bmatrix}} $$시험 시작 전, 다음의 ’학생 명예선서(Honor Code)’를 아래에 옮겨 적고 학번과 이름을 적어 서명하시오.
학생 명예선서:
“나는 타인의 도움을 받지 않고 정직하게 시험에 응할 것을 서약합니다.”
“By signing this pledge, I promise to adhere to exam requirements and maintain the highest level of ethical principles during the exam period.”
학생 명예선서:
- (한글/영문 중 하나를 옮겨 적으시오)
학번:
이름:
(Problem 1) 다음의 웹링크는 2020년 1월부터 2021년 11월까지 수집된 세계 각국의 코로나-19 관련 통계자료를 담고 있다. 출처: Our World in Data (https://ourworldindata.org)
https://jonghank.github.io/ase1302/files/owid-covid-data-nov-2021.csv
이 파일을 pandas dataframe으로 로드하여 다음의 질문에 답하시오.
import numpy as np
import pandas as pd
import matplotlib.pyplot as plt

df = pd.read_csv('https://jonghank.github.io/ase1302/files/owid-covid-data-nov2021-noindex.csv', index_col=3)
df
| iso_code | continent | location | total_cases | new_cases | new_cases_smoothed | total_deaths | new_deaths | new_deaths_smoothed | total_cases_per_million | new_cases_per_million | new_cases_smoothed_per_million | total_deaths_per_million | new_deaths_per_million | new_deaths_smoothed_per_million | reproduction_rate | icu_patients | icu_patients_per_million | hosp_patients | hosp_patients_per_million | weekly_icu_admissions | weekly_icu_admissions_per_million | weekly_hosp_admissions | weekly_hosp_admissions_per_million | new_tests | total_tests | total_tests_per_thousand | new_tests_per_thousand | new_tests_smoothed | new_tests_smoothed_per_thousand | positive_rate | tests_per_case | tests_units | total_vaccinations | people_vaccinated | people_fully_vaccinated | total_boosters | new_vaccinations | new_vaccinations_smoothed | total_vaccinations_per_hundred | people_vaccinated_per_hundred | people_fully_vaccinated_per_hundred | total_boosters_per_hundred | new_vaccinations_smoothed_per_million | new_people_vaccinated_smoothed | new_people_vaccinated_smoothed_per_hundred | stringency_index | population | population_density | median_age | aged_65_older | aged_70_older | gdp_per_capita | extreme_poverty | cardiovasc_death_rate | diabetes_prevalence | female_smokers | male_smokers | handwashing_facilities | hospital_beds_per_thousand | life_expectancy | human_development_index | excess_mortality_cumulative_absolute | excess_mortality_cumulative | excess_mortality | excess_mortality_cumulative_per_million | |
|---|---|---|---|---|---|---|---|---|---|---|---|---|---|---|---|---|---|---|---|---|---|---|---|---|---|---|---|---|---|---|---|---|---|---|---|---|---|---|---|---|---|---|---|---|---|---|---|---|---|---|---|---|---|---|---|---|---|---|---|---|---|---|---|---|---|---|
| date | ||||||||||||||||||||||||||||||||||||||||||||||||||||||||||||||||||
| 2020-02-24 | AFG | Asia | Afghanistan | 5.0 | 5.0 | NaN | NaN | NaN | NaN | 0.126 | 0.126 | NaN | NaN | NaN | NaN | NaN | NaN | NaN | NaN | NaN | NaN | NaN | NaN | NaN | NaN | NaN | NaN | NaN | NaN | NaN | NaN | NaN | NaN | NaN | NaN | NaN | NaN | NaN | NaN | NaN | NaN | NaN | NaN | NaN | NaN | NaN | 8.33 | 39835428.0 | 54.422 | 18.6 | 2.581 | 1.337 | 1803.987 | NaN | 597.029 | 9.59 | NaN | NaN | 37.746 | 0.5 | 64.83 | 0.511 | NaN | NaN | NaN | NaN |
| 2020-02-25 | AFG | Asia | Afghanistan | 5.0 | 0.0 | NaN | NaN | NaN | NaN | 0.126 | 0.000 | NaN | NaN | NaN | NaN | NaN | NaN | NaN | NaN | NaN | NaN | NaN | NaN | NaN | NaN | NaN | NaN | NaN | NaN | NaN | NaN | NaN | NaN | NaN | NaN | NaN | NaN | NaN | NaN | NaN | NaN | NaN | NaN | NaN | NaN | NaN | 8.33 | 39835428.0 | 54.422 | 18.6 | 2.581 | 1.337 | 1803.987 | NaN | 597.029 | 9.59 | NaN | NaN | 37.746 | 0.5 | 64.83 | 0.511 | NaN | NaN | NaN | NaN |
| 2020-02-26 | AFG | Asia | Afghanistan | 5.0 | 0.0 | NaN | NaN | NaN | NaN | 0.126 | 0.000 | NaN | NaN | NaN | NaN | NaN | NaN | NaN | NaN | NaN | NaN | NaN | NaN | NaN | NaN | NaN | NaN | NaN | NaN | NaN | NaN | NaN | NaN | NaN | NaN | NaN | NaN | NaN | NaN | NaN | NaN | NaN | NaN | NaN | NaN | NaN | 8.33 | 39835428.0 | 54.422 | 18.6 | 2.581 | 1.337 | 1803.987 | NaN | 597.029 | 9.59 | NaN | NaN | 37.746 | 0.5 | 64.83 | 0.511 | NaN | NaN | NaN | NaN |
| 2020-02-27 | AFG | Asia | Afghanistan | 5.0 | 0.0 | NaN | NaN | NaN | NaN | 0.126 | 0.000 | NaN | NaN | NaN | NaN | NaN | NaN | NaN | NaN | NaN | NaN | NaN | NaN | NaN | NaN | NaN | NaN | NaN | NaN | NaN | NaN | NaN | NaN | NaN | NaN | NaN | NaN | NaN | NaN | NaN | NaN | NaN | NaN | NaN | NaN | NaN | 8.33 | 39835428.0 | 54.422 | 18.6 | 2.581 | 1.337 | 1803.987 | NaN | 597.029 | 9.59 | NaN | NaN | 37.746 | 0.5 | 64.83 | 0.511 | NaN | NaN | NaN | NaN |
| 2020-02-28 | AFG | Asia | Afghanistan | 5.0 | 0.0 | NaN | NaN | NaN | NaN | 0.126 | 0.000 | NaN | NaN | NaN | NaN | NaN | NaN | NaN | NaN | NaN | NaN | NaN | NaN | NaN | NaN | NaN | NaN | NaN | NaN | NaN | NaN | NaN | NaN | NaN | NaN | NaN | NaN | NaN | NaN | NaN | NaN | NaN | NaN | NaN | NaN | NaN | 8.33 | 39835428.0 | 54.422 | 18.6 | 2.581 | 1.337 | 1803.987 | NaN | 597.029 | 9.59 | NaN | NaN | 37.746 | 0.5 | 64.83 | 0.511 | NaN | NaN | NaN | NaN |
| ... | ... | ... | ... | ... | ... | ... | ... | ... | ... | ... | ... | ... | ... | ... | ... | ... | ... | ... | ... | ... | ... | ... | ... | ... | ... | ... | ... | ... | ... | ... | ... | ... | ... | ... | ... | ... | ... | ... | ... | ... | ... | ... | ... | ... | ... | ... | ... | ... | ... | ... | ... | ... | ... | ... | ... | ... | ... | ... | ... | ... | ... | ... | ... | ... | ... | ... |
| 2021-11-26 | ZWE | Africa | Zimbabwe | 133836.0 | 62.0 | 34.714 | 4704.0 | 0.0 | 0.714 | 8867.909 | 4.108 | 2.300 | 311.685 | 0.000 | 0.047 | 2.21 | NaN | NaN | NaN | NaN | NaN | NaN | NaN | NaN | 2719.0 | 1444921.0 | 95.740 | 0.180 | 2541.0 | 0.168 | 0.0137 | 73.2 | tests performed | 6544331.0 | 3757352.0 | 2786979.0 | NaN | 31285.0 | 25976.0 | 43.36 | 24.90 | 18.47 | NaN | 1721.0 | 18876.0 | 0.125 | 47.22 | 15092171.0 | 42.729 | 19.6 | 2.822 | 1.882 | 1899.775 | 21.4 | 307.846 | 1.82 | 1.6 | 30.7 | 36.791 | 1.7 | 61.49 | 0.571 | NaN | NaN | NaN | NaN |
| 2021-11-27 | ZWE | Africa | Zimbabwe | 133836.0 | 0.0 | 31.571 | 4704.0 | 0.0 | 0.714 | 8867.909 | 0.000 | 2.092 | 311.685 | 0.000 | 0.047 | 2.42 | NaN | NaN | NaN | NaN | NaN | NaN | NaN | NaN | 4152.0 | 1449073.0 | 96.015 | 0.275 | 2788.0 | 0.185 | 0.0113 | 88.3 | tests performed | 6560442.0 | 3765392.0 | 2795050.0 | NaN | 16111.0 | 23490.0 | 43.47 | 24.95 | 18.52 | NaN | 1556.0 | 16225.0 | 0.108 | 47.22 | 15092171.0 | 42.729 | 19.6 | 2.822 | 1.882 | 1899.775 | 21.4 | 307.846 | 1.82 | 1.6 | 30.7 | 36.791 | 1.7 | 61.49 | 0.571 | NaN | NaN | NaN | NaN |
| 2021-11-28 | ZWE | Africa | Zimbabwe | 133951.0 | 115.0 | 43.429 | 4705.0 | 1.0 | 0.857 | 8875.529 | 7.620 | 2.878 | 311.751 | 0.066 | 0.057 | 2.69 | NaN | NaN | NaN | NaN | NaN | NaN | NaN | NaN | 1044.0 | 1450117.0 | 96.084 | 0.069 | 2764.0 | 0.183 | 0.0157 | 63.6 | tests performed | 6568694.0 | 3770886.0 | 2797808.0 | NaN | 8252.0 | 21284.0 | 43.52 | 24.99 | 18.54 | NaN | 1410.0 | 14125.0 | 0.094 | 47.22 | 15092171.0 | 42.729 | 19.6 | 2.822 | 1.882 | 1899.775 | 21.4 | 307.846 | 1.82 | 1.6 | 30.7 | 36.791 | 1.7 | 61.49 | 0.571 | NaN | NaN | NaN | NaN |
| 2021-11-29 | ZWE | Africa | Zimbabwe | 134226.0 | 275.0 | 78.857 | 4706.0 | 1.0 | 1.000 | 8893.750 | 18.221 | 5.225 | 311.817 | 0.066 | 0.066 | 2.92 | NaN | NaN | NaN | NaN | NaN | NaN | NaN | NaN | 3067.0 | 1453184.0 | 96.287 | 0.203 | 2746.0 | 0.182 | 0.0287 | 34.8 | tests performed | 6586503.0 | 3782038.0 | 2804465.0 | NaN | 17809.0 | 21809.0 | 43.64 | 25.06 | 18.58 | NaN | 1445.0 | 14364.0 | 0.095 | 47.22 | 15092171.0 | 42.729 | 19.6 | 2.822 | 1.882 | 1899.775 | 21.4 | 307.846 | 1.82 | 1.6 | 30.7 | 36.791 | 1.7 | 61.49 | 0.571 | NaN | NaN | NaN | NaN |
| 2021-11-30 | ZWE | Africa | Zimbabwe | 134625.0 | 399.0 | 135.857 | 4707.0 | 1.0 | 1.143 | 8920.188 | 26.438 | 9.002 | 311.884 | 0.066 | 0.076 | 3.03 | NaN | NaN | NaN | NaN | NaN | NaN | NaN | NaN | 4679.0 | 1457863.0 | 96.597 | 0.310 | 2974.0 | 0.197 | 0.0457 | 21.9 | tests performed | 6611942.0 | 3795401.0 | 2816541.0 | NaN | 25439.0 | 22460.0 | 43.81 | 25.15 | 18.66 | NaN | 1488.0 | 14024.0 | 0.093 | 49.07 | 15092171.0 | 42.729 | 19.6 | 2.822 | 1.882 | 1899.775 | 21.4 | 307.846 | 1.82 | 1.6 | 30.7 | 36.791 | 1.7 | 61.49 | 0.571 | NaN | NaN | NaN | NaN |
136992 rows × 66 columns
(Problem 1a) 이 파일은 몇 개 국가의 데이타를 담고 있나? 국가명들을 알파벳 순서로 정렬하여 출력하시오.
# your code here

location_set = set(df['location'])
number_of_countries = len(location_set)
location_list = sorted(list(location_set))

print(f'number of countries: {number_of_countries}')

count = 0
for country in location_list:
  print(country, end=' | ')
  count += 1
  if count%6==0:
    print()
print('\n')
number of countries: 237
Afghanistan | Africa | Albania | Algeria | Andorra | Angola |
Anguilla | Antigua and Barbuda | Argentina | Armenia | Aruba | Asia |
Australia | Austria | Azerbaijan | Bahamas | Bahrain | Bangladesh |
Barbados | Belarus | Belgium | Belize | Benin | Bermuda |
Bhutan | Bolivia | Bonaire Sint Eustatius and Saba | Bosnia and Herzegovina | Botswana | Brazil |
British Virgin Islands | Brunei | Bulgaria | Burkina Faso | Burundi | Cambodia |
Cameroon | Canada | Cape Verde | Cayman Islands | Central African Republic | Chad |
Chile | China | Colombia | Comoros | Congo | Cook Islands |
Costa Rica | Cote d'Ivoire | Croatia | Cuba | Curacao | Cyprus |
Czechia | Democratic Republic of Congo | Denmark | Djibouti | Dominica | Dominican Republic |
Ecuador | Egypt | El Salvador | Equatorial Guinea | Eritrea | Estonia |
Eswatini | Ethiopia | Europe | European Union | Faeroe Islands | Falkland Islands |
Fiji | Finland | France | French Polynesia | Gabon | Gambia |
Georgia | Germany | Ghana | Gibraltar | Greece | Greenland |
Grenada | Guatemala | Guernsey | Guinea | Guinea-Bissau | Guyana |
Haiti | High income | Honduras | Hong Kong | Hungary | Iceland |
India | Indonesia | International | Iran | Iraq | Ireland |
Isle of Man | Israel | Italy | Jamaica | Japan | Jersey |
Jordan | Kazakhstan | Kenya | Kiribati | Kosovo | Kuwait |
Kyrgyzstan | Laos | Latvia | Lebanon | Lesotho | Liberia |
Libya | Liechtenstein | Lithuania | Low income | Lower middle income | Luxembourg |
Macao | Madagascar | Malawi | Malaysia | Maldives | Mali |
Malta | Marshall Islands | Mauritania | Mauritius | Mexico | Micronesia (country) |
Moldova | Monaco | Mongolia | Montenegro | Montserrat | Morocco |
Mozambique | Myanmar | Namibia | Nauru | Nepal | Netherlands |
New Caledonia | New Zealand | Nicaragua | Niger | Nigeria | Niue |
North America | North Macedonia | Northern Cyprus | Norway | Oceania | Oman |
Pakistan | Palau | Palestine | Panama | Papua New Guinea | Paraguay |
Peru | Philippines | Pitcairn | Poland | Portugal | Qatar |
Romania | Russia | Rwanda | Saint Helena | Saint Kitts and Nevis | Saint Lucia |
Saint Vincent and the Grenadines | Samoa | San Marino | Sao Tome and Principe | Saudi Arabia | Senegal |
Serbia | Seychelles | Sierra Leone | Singapore | Sint Maarten (Dutch part) | Slovakia |
Slovenia | Solomon Islands | Somalia | South Africa | South America | South Korea |
South Sudan | Spain | Sri Lanka | Sudan | Suriname | Sweden |
Switzerland | Syria | Taiwan | Tajikistan | Tanzania | Thailand |
Timor | Togo | Tokelau | Tonga | Trinidad and Tobago | Tunisia |
Turkey | Turkmenistan | Turks and Caicos Islands | Tuvalu | Uganda | Ukraine |
United Arab Emirates | United Kingdom | United States | Upper middle income | Uruguay | Uzbekistan |
Vanuatu | Vatican | Venezuela | Vietnam | Wallis and Futuna | World |
Yemen | Zambia | Zimbabwe |
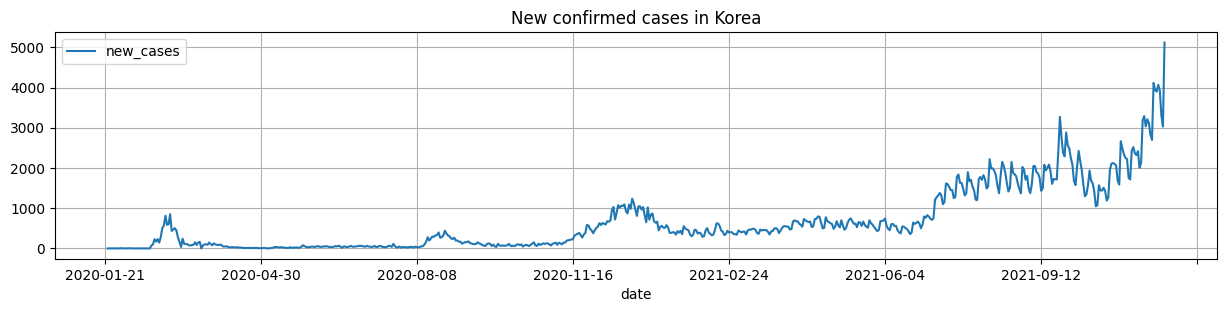
(Problem 1b) 우리나라의 1) 일일 신규 확진자(new_cases), 2) 일일 사망자(new_deaths), 2) 누적 확진자(total_cases)와 4)누적 사망자(total_deaths) 추이를 그래프로 그려 살펴보시오.
# your code here

kor_df = df[df['location']=='South Korea']

plt.figure(figsize=(15,3), dpi=100)
kor_df['new_cases'].plot()
plt.legend()
plt.title('New confirmed cases in Korea')
plt.grid()
plt.show()

plt.figure(figsize=(15,3), dpi=100)
kor_df['new_deaths'].plot()
plt.legend()
plt.title('New deaths in Korea')
plt.grid()
plt.show()

plt.figure(figsize=(15,3), dpi=100)
kor_df['total_cases'].plot()
plt.title('Total confirmed cases in Korea')
plt.grid()
plt.show()

plt.figure(figsize=(15,3), dpi=100)
kor_df['total_deaths'].plot()
plt.title('Total deaths in Korea')
plt.grid()
plt.show()


(Problem 1c) 어떤 병에 걸린 전체 환자 중에서 그 병으로 사망한 환자의 수의 비율을 치명률(case fatality rate)이라고 한다.
데이타에 주어진 전체 기간에 대해, G20 국가들의 코로나-19 치명률 추이를 한 그래프에 겹쳐 그려 비교해 보시오. 특별히, 우리나라의 치명률 추이는 선을 두껍게 그려, 다른 나라들과 잘 구별되도록 표시하시오.
2021년 11월 30일을 기준으로, G20 국가들의 코로나-19 치명률을 한 눈에 비교할 수 있도록 Bar 그래프로 도시하시오.
참고로, G20 국가 리스트는 다음 셀에 주어져 있다.
G20_countries = ['Australia', 'Canada', 'Saudi Arabia', 'United States', \
                 'India', 'Russia', 'South Africa', 'Turkey', \
                 'Argentina', 'Brazil', 'Mexico', 'Spain', \
                 'France', 'Germany', 'Italy', 'United Kingdom', \
                 'China', 'Indonesia', 'Japan', 'South Korea']
# your code here

df['case_fatality_rate'] = df['total_deaths']/df['total_cases']

cfr_20211130 = []

plt.figure(figsize=(15,8), dpi=100)
for country in G20_countries[:-1]:
  df[df['location']==country]['case_fatality_rate'].plot(label=country, alpha=0.5)
  cfr_20211130.append(df[df['location']==country]['case_fatality_rate'][-1])
df[df['location']=='South Korea']['case_fatality_rate'].plot(label='South Korea', linewidth=3, color='k')
cfr_20211130.append(df[df['location']=='South Korea']['case_fatality_rate'][-1])
plt.title('Case fatality rate of G20 countries')
plt.legend()
plt.grid()
plt.show()

# your code here

plt.figure(figsize=(15,6), dpi=100)
plt.bar(G20_countries, cfr_20211130)
plt.xticks(rotation='vertical')
plt.title('Case fatality rate as of Nov. 30th, 2021')
plt.grid()
plt.show()

(Problem 1d) 우리나라의 일일 신규 확진자 그래프를 다시 한 번 살펴보자.
처리되지 않은 신규 확진자 발생 자료는 요일별 특성과 검사건수 등에 의해 일주일 주기로 오르락내리락 하는 특성을 보여 분석에 어려움이 있을 수 있으므로, 통상적으로 7일-평균치 또는 30일-평균치를 새롭게 정의하여 추이 분석에 사용한다.
예를 들어, $T$-일 동안 주어진 신규 확진자 수를 $y_1, y_2, \dots, y_T$라 하면 ($T$는 7보다 크다고 가정하자), 7일-평균치 $x_1, x_2, \dots, x_T$는 다음과 같이 정의된다.
$$ x_t = \begin{cases} \left( y_1 + \cdots + y_{t}\right)/t &\quad \text{if}\quad t\le 7\\ \left( y_{t-6} + y_{t-5} + \cdots + y_t\right)/7 &\quad \text{otherwise } \end{cases} $$쉽게 말해, 7일 평균치는 과거 7일 자료의 평균치가 된다.
우리나라의 일일 신규 확진자 자료를 활용하여 7일-평균치와 30일-평균치를 계산해 보고, 신규 확진자 그래프에 겹쳐서 플롯하시오.
# your code here

kor_df = kor_df.assign(new_cases_7=np.nan, new_cases_30=np.nan)

for i in range(len(kor_df['new_cases'])):
  if i<7:
    kor_df['new_cases_7'].iloc[i] = kor_df['new_cases'][:i].mean()
  else:
    kor_df['new_cases_7'].iloc[i] = kor_df['new_cases'][i-7:i].mean()
  if i<30:
    kor_df['new_cases_30'].iloc[i] = kor_df['new_cases'][:i].mean()
  else:
    kor_df['new_cases_30'].iloc[i] = kor_df['new_cases'][i-30:i].mean()

plt.figure(figsize=(15,6), dpi=100)
kor_df['new_cases'].plot(alpha=0.5, label='New confirmed cases')
kor_df['new_cases_7'].plot(linewidth=2, label='New confirmed cases (week averaged)')
kor_df['new_cases_30'].plot(linewidth=2, label='New confirmed cases (month averaged)')
plt.legend()
plt.grid()
plt.xticks(rotation='vertical')
plt.show()
/usr/local/lib/python3.7/dist-packages/pandas/core/indexing.py:670: SettingWithCopyWarning:
A value is trying to be set on a copy of a slice from a DataFrame

See the caveats in the documentation: https://pandas.pydata.org/pandas-docs/stable/user_guide/indexing.html#returning-a-view-versus-a-copy
  iloc._setitem_with_indexer(indexer, value)

(Problem 2) 아래의 셀은 올해 4월부터 9월까지 미국에서 접종된 세 가지 코로나-19 백신에 대해, 각 백신을 접종받은 인구 수와 코로나-19로 인한 사망자 중 해당 백신 접종자의 수를 이용하여, 각 백신이 코로나-19의 치명률을 얼마나 낮출 수 있는지 분석한다.
df_us = pd.read_csv('https://jonghank.github.io/ase1302/files/Rates_of_COVID-19_Cases_or_Deaths_by_Age_Group_and_Vaccination_Status.csv', index_col=3)
df_us_vac = df_us[ (df_us['outcome']=='death') & (df_us['Age group']=='all_ages_adj') ]

df_us_phz = df_us_vac[df_us_vac['Vaccine product']=='Pfizer']
df_us_mod = df_us_vac[df_us_vac['Vaccine product']=='Moderna']
df_us_jan = df_us_vac[df_us_vac['Vaccine product']=='Janssen']

plt.figure(figsize=(15,6), dpi=100)
phz = df_us_phz['Vaccinated with outcome']/df_us_phz['Fully vaccinated population']*1000000
mod = df_us_mod['Vaccinated with outcome']/df_us_mod['Fully vaccinated population']*1000000
jan = df_us_jan['Vaccinated with outcome']/df_us_jan['Fully vaccinated population']*1000000
unv = df_us_phz['Unvaccinated with outcome']/df_us_phz['Unvaccinated population']*1000000
phz.plot(label='Vaccinated (Pfizer)')
mod.plot(label='Vaccinated (Moderna)')
jan.plot(label='Vaccinated (Janssen)')
unv.plot(label='Unvaccinated')
plt.ylabel('Deaths per million')
plt.title('Vaccine effectiveness (United States)')
plt.legend()
plt.grid()
plt.show()

위의 그래프는 모든 연령대의 인구에 대한 치명률을 나타내며, 다운받은 csv 파일 내부에는 여러분들 나이 또래인 18세-29세 연령 그룹에만 한정된 자료도 구분되어 포함되어 있다.
위의 셀과 다운받은 데이타프레임을 잘 살펴보고, 18세-29세 연령 그룹에 한정하여 백신 미접종자와 백신 접종자의 치명률 추이를 함께 그려 비교해 보시오 (여기에서 백신 접종자는 세 가지 백신 접종자를 모두 포함한다).
# your code here

df_us = pd.read_csv('https://jonghank.github.io/ase1302/files/Rates_of_COVID-19_Cases_or_Deaths_by_Age_Group_and_Vaccination_Status.csv', index_col=3)
df_us_vac = df_us[ (df_us['outcome']=='death') & (df_us['Age group']=='18-29') ]

plt.figure(figsize=(15,6), dpi=100)
vac = df_us_vac['Vaccinated with outcome']/df_us_vac['Fully vaccinated population']*1000000
unv = df_us_vac['Unvaccinated with outcome']/df_us_vac['Unvaccinated population']*1000000
vac.plot(label='Vaccinated')
unv.plot(label='Unvaccinated')
plt.ylabel('Deaths per million')
plt.title('Vaccine effectiveness (United States)')
plt.legend()
plt.grid()
plt.show()
