Global Forecasting System - Meteorological forecast
In [1]:
from datetime import datetime, timedelta
import xarray
import numpy as np
import pandas as pd
from mikeio import Dfs2
Let's try to download yesterday's forecast from the OpenDAP server.
In [2]:
now = datetime.now()
forecast = datetime(now.year,now.month,now.day) - timedelta(days=1)
dtstr = forecast.strftime("%Y%m%d")
hour = "12" # valid options are 00,06,12,18
url = f"https://nomads.ncep.noaa.gov/dods/gfs_0p25/gfs{dtstr}/gfs_0p25_{hour}z"
In [3]:
# code used to generate the example file '../tests/testdata/gfs_wind.nc'

# ds = xarray.open_dataset(url)  # use this instead if you want new data
# ds = ds.sel(lon=slice(10,15), lat=slice(30,40)).isel(time=slice(0,3)) # small subset for illustration
# ds = ds[['msletmsl','ugrd10m','vgrd10m']].load()
# ds.to_netcdf("../tests/testdata/gfs_wind.nc") # save to disk as netcdf
In [4]:
fn = '../tests/testdata/gfs_wind.nc'
ds = xarray.open_dataset(fn)
#ds = xarray.open_dataset(url)  # use this instead if you want new dataa
In [5]:
ds.time.values[0],ds.time.values[-1]
Out[5]:
(numpy.datetime64('2021-09-02T12:00:00.000000000'),
 numpy.datetime64('2021-09-02T18:00:00.000000000'))
In [6]:
(ds.time.values[-1]- ds.time.values[0]).astype('timedelta64[D]')
Out[6]:
numpy.timedelta64(0,'D')
The forecast contains data for the coming 10 days.
Running a Mike 21 HD model, needs at least three variables of meteorlogical forcing
- Mean Sea Level Pressure
- U 10m
- V 10m
In [7]:
ds.msletmsl
Out[7]:
<xarray.DataArray 'msletmsl' (time: 3, lat: 41, lon: 21)>
array([[[101116.35 , 101134.555, ..., 101474.15 , 101485.35 ],
        [101122.95 , 101141.75 , ..., 101498.35 , 101509.15 ],
        ...,
        [101972.555, 102048.35 , ..., 101975.15 , 101966.15 ],
        [102029.555, 102074.95 , ..., 101970.75 , 101953.15 ]],

       [[100923.02 , 100932.43 , ..., 101305.43 , 101316.43 ],
        [100940.625, 100945.625, ..., 101329.83 , 101343.625],
        ...,
        [101875.43 , 101861.83 , ..., 101870.83 , 101875.83 ],
        [101912.43 , 101898.02 , ..., 101860.83 , 101876.83 ]],

       [[101001.36 , 101014.555, ..., 101453.76 , 101465.555],
        [101002.96 , 101017.96 , ..., 101513.36 , 101522.76 ],
        ...,
        [101853.36 , 101859.16 , ..., 101855.555, 101863.555],
        [101870.36 , 101869.96 , ..., 101866.36 , 101870.96 ]]], dtype=float32)
Coordinates:
  * time     (time) datetime64[ns] 2021-09-02T12:00:00 ... 2021-09-02T18:00:00
  * lat      (lat) float64 30.0 30.25 30.5 30.75 31.0 ... 39.25 39.5 39.75 40.0
  * lon      (lon) float64 10.0 10.25 10.5 10.75 11.0 ... 14.25 14.5 14.75 15.0
Attributes:
    long_name:  ** mean sea level mslp (eta model reduction) [pa]
xarray.DataArray
'msletmsl'
- time: 3
- lat: 41
- lon: 21
- 1.011e+05 1.011e+05 1.011e+05 ... 1.018e+05 1.019e+05 1.019e+05
array([[[101116.35 , 101134.555, ..., 101474.15 , 101485.35 ], [101122.95 , 101141.75 , ..., 101498.35 , 101509.15 ], ..., [101972.555, 102048.35 , ..., 101975.15 , 101966.15 ], [102029.555, 102074.95 , ..., 101970.75 , 101953.15 ]], [[100923.02 , 100932.43 , ..., 101305.43 , 101316.43 ], [100940.625, 100945.625, ..., 101329.83 , 101343.625], ..., [101875.43 , 101861.83 , ..., 101870.83 , 101875.83 ], [101912.43 , 101898.02 , ..., 101860.83 , 101876.83 ]], [[101001.36 , 101014.555, ..., 101453.76 , 101465.555], [101002.96 , 101017.96 , ..., 101513.36 , 101522.76 ], ..., [101853.36 , 101859.16 , ..., 101855.555, 101863.555], [101870.36 , 101869.96 , ..., 101866.36 , 101870.96 ]]], dtype=float32) - time(time)datetime64[ns]2021-09-02T12:00:00 ... 2021-09-...
- grads_dim :
- t
- grads_mapping :
- linear
- grads_size :
- 129
- grads_min :
- 12z02sep2021
- grads_step :
- 3hr
- long_name :
- time
- minimum :
- 12z02sep2021
- maximum :
- 12z18sep2021
- resolution :
- 0.125
array(['2021-09-02T12:00:00.000000000', '2021-09-02T15:00:00.000000000', '2021-09-02T18:00:00.000000000'], dtype='datetime64[ns]') - lat(lat)float6430.0 30.25 30.5 ... 39.5 39.75 40.0
- grads_dim :
- y
- grads_mapping :
- linear
- grads_size :
- 721
- units :
- degrees_north
- long_name :
- latitude
- minimum :
- -90.0
- maximum :
- 90.0
- resolution :
- 0.25
array([30. , 30.25, 30.5 , 30.75, 31. , 31.25, 31.5 , 31.75, 32. , 32.25, 32.5 , 32.75, 33. , 33.25, 33.5 , 33.75, 34. , 34.25, 34.5 , 34.75, 35. , 35.25, 35.5 , 35.75, 36. , 36.25, 36.5 , 36.75, 37. , 37.25, 37.5 , 37.75, 38. , 38.25, 38.5 , 38.75, 39. , 39.25, 39.5 , 39.75, 40. ]) - lon(lon)float6410.0 10.25 10.5 ... 14.5 14.75 15.0
- grads_dim :
- x
- grads_mapping :
- linear
- grads_size :
- 1440
- units :
- degrees_east
- long_name :
- longitude
- minimum :
- 0.0
- maximum :
- 359.75
- resolution :
- 0.25
array([10.  , 10.25, 10.5 , 10.75, 11.  , 11.25, 11.5 , 11.75, 12.  , 12.25,
       12.5 , 12.75, 13.  , 13.25, 13.5 , 13.75, 14.  , 14.25, 14.5 , 14.75,
       15.  ])
- long_name :
- ** mean sea level mslp (eta model reduction) [pa]
In [8]:
ds.ugrd10m
Out[8]:
<xarray.DataArray 'ugrd10m' (time: 3, lat: 41, lon: 21)>
array([[[ 1.021836,  1.151836, ..., -4.318164, -4.228164],
        [ 1.731836,  1.361836, ..., -4.408164, -4.138164],
        ...,
        [-2.328164, -0.578164, ...,  0.111836,  1.381836],
        [-1.368164, -0.248164, ...,  2.521836,  3.361836]],

       [[-1.186663, -0.896663, ..., -4.376663, -4.216662],
        [-0.516663, -0.106663, ..., -4.476663, -4.386662],
        ...,
        [-2.176662, -3.376662, ...,  2.673337,  3.193337],
        [-1.596663, -2.376662, ...,  2.923337,  3.493337]],

       [[-3.289988, -3.199988, ..., -5.399988, -5.479988],
        [-3.449988, -3.719988, ..., -7.419988, -6.809988],
        ...,
        [-2.629988, -3.189988, ...,  2.280012,  2.160012],
        [-1.719988, -2.939988, ...,  2.620012,  2.800012]]], dtype=float32)
Coordinates:
  * time     (time) datetime64[ns] 2021-09-02T12:00:00 ... 2021-09-02T18:00:00
  * lat      (lat) float64 30.0 30.25 30.5 30.75 31.0 ... 39.25 39.5 39.75 40.0
  * lon      (lon) float64 10.0 10.25 10.5 10.75 11.0 ... 14.25 14.5 14.75 15.0
Attributes:
    long_name:  ** 10 m above ground u-component of wind [m/s]
xarray.DataArray
'ugrd10m'
- time: 3
- lat: 41
- lon: 21
- 1.022 1.152 2.212 1.782 0.8518 1.172 ... 2.79 3.63 3.99 2.93 2.62 2.8
array([[[ 1.021836, 1.151836, ..., -4.318164, -4.228164], [ 1.731836, 1.361836, ..., -4.408164, -4.138164], ..., [-2.328164, -0.578164, ..., 0.111836, 1.381836], [-1.368164, -0.248164, ..., 2.521836, 3.361836]], [[-1.186663, -0.896663, ..., -4.376663, -4.216662], [-0.516663, -0.106663, ..., -4.476663, -4.386662], ..., [-2.176662, -3.376662, ..., 2.673337, 3.193337], [-1.596663, -2.376662, ..., 2.923337, 3.493337]], [[-3.289988, -3.199988, ..., -5.399988, -5.479988], [-3.449988, -3.719988, ..., -7.419988, -6.809988], ..., [-2.629988, -3.189988, ..., 2.280012, 2.160012], [-1.719988, -2.939988, ..., 2.620012, 2.800012]]], dtype=float32) - time(time)datetime64[ns]2021-09-02T12:00:00 ... 2021-09-...
- grads_dim :
- t
- grads_mapping :
- linear
- grads_size :
- 129
- grads_min :
- 12z02sep2021
- grads_step :
- 3hr
- long_name :
- time
- minimum :
- 12z02sep2021
- maximum :
- 12z18sep2021
- resolution :
- 0.125
array(['2021-09-02T12:00:00.000000000', '2021-09-02T15:00:00.000000000', '2021-09-02T18:00:00.000000000'], dtype='datetime64[ns]') - lat(lat)float6430.0 30.25 30.5 ... 39.5 39.75 40.0
- grads_dim :
- y
- grads_mapping :
- linear
- grads_size :
- 721
- units :
- degrees_north
- long_name :
- latitude
- minimum :
- -90.0
- maximum :
- 90.0
- resolution :
- 0.25
array([30. , 30.25, 30.5 , 30.75, 31. , 31.25, 31.5 , 31.75, 32. , 32.25, 32.5 , 32.75, 33. , 33.25, 33.5 , 33.75, 34. , 34.25, 34.5 , 34.75, 35. , 35.25, 35.5 , 35.75, 36. , 36.25, 36.5 , 36.75, 37. , 37.25, 37.5 , 37.75, 38. , 38.25, 38.5 , 38.75, 39. , 39.25, 39.5 , 39.75, 40. ]) - lon(lon)float6410.0 10.25 10.5 ... 14.5 14.75 15.0
- grads_dim :
- x
- grads_mapping :
- linear
- grads_size :
- 1440
- units :
- degrees_east
- long_name :
- longitude
- minimum :
- 0.0
- maximum :
- 359.75
- resolution :
- 0.25
array([10.  , 10.25, 10.5 , 10.75, 11.  , 11.25, 11.5 , 11.75, 12.  , 12.25,
       12.5 , 12.75, 13.  , 13.25, 13.5 , 13.75, 14.  , 14.25, 14.5 , 14.75,
       15.  ])
- long_name :
- ** 10 m above ground u-component of wind [m/s]
In [9]:
ds.vgrd10m
Out[9]:
<xarray.DataArray 'vgrd10m' (time: 3, lat: 41, lon: 21)>
array([[[-0.474941, -0.634941, ..., -1.244941, -1.254941],
        [-1.124941, -0.504941, ..., -1.014941, -1.224941],
        ...,
        [-0.454941,  1.145059, ...,  1.505059,  1.635059],
        [ 1.695059,  2.595058, ...,  1.645059,  1.805059]],

       [[-4.673393, -3.993393, ..., -2.993393, -3.323394],
        [-4.393394, -4.633393, ..., -2.723393, -3.213393],
        ...,
        [-0.593394,  0.456606, ...,  0.616606, -0.323394],
        [ 0.046606,  1.156606, ...,  0.066606, -1.213394]],

       [[-2.777568, -3.487568, ..., -4.187568, -4.807568],
        [-1.427568, -1.767568, ..., -5.827568, -6.177568],
        ...,
        [-1.707568, -1.177568, ..., -2.307568, -2.357568],
        [-2.577568, -1.327568, ..., -2.947568, -3.897568]]], dtype=float32)
Coordinates:
  * time     (time) datetime64[ns] 2021-09-02T12:00:00 ... 2021-09-02T18:00:00
  * lat      (lat) float64 30.0 30.25 30.5 30.75 31.0 ... 39.25 39.5 39.75 40.0
  * lon      (lon) float64 10.0 10.25 10.5 10.75 11.0 ... 14.25 14.5 14.75 15.0
Attributes:
    long_name:  ** 10 m above ground v-component of wind [m/s]
xarray.DataArray
'vgrd10m'
- time: 3
- lat: 41
- lon: 21
- -0.4749 -0.6349 -0.9649 -0.3649 1.155 ... -0.9676 -1.868 -2.948 -3.898
array([[[-0.474941, -0.634941, ..., -1.244941, -1.254941], [-1.124941, -0.504941, ..., -1.014941, -1.224941], ..., [-0.454941, 1.145059, ..., 1.505059, 1.635059], [ 1.695059, 2.595058, ..., 1.645059, 1.805059]], [[-4.673393, -3.993393, ..., -2.993393, -3.323394], [-4.393394, -4.633393, ..., -2.723393, -3.213393], ..., [-0.593394, 0.456606, ..., 0.616606, -0.323394], [ 0.046606, 1.156606, ..., 0.066606, -1.213394]], [[-2.777568, -3.487568, ..., -4.187568, -4.807568], [-1.427568, -1.767568, ..., -5.827568, -6.177568], ..., [-1.707568, -1.177568, ..., -2.307568, -2.357568], [-2.577568, -1.327568, ..., -2.947568, -3.897568]]], dtype=float32) - time(time)datetime64[ns]2021-09-02T12:00:00 ... 2021-09-...
- grads_dim :
- t
- grads_mapping :
- linear
- grads_size :
- 129
- grads_min :
- 12z02sep2021
- grads_step :
- 3hr
- long_name :
- time
- minimum :
- 12z02sep2021
- maximum :
- 12z18sep2021
- resolution :
- 0.125
array(['2021-09-02T12:00:00.000000000', '2021-09-02T15:00:00.000000000', '2021-09-02T18:00:00.000000000'], dtype='datetime64[ns]') - lat(lat)float6430.0 30.25 30.5 ... 39.5 39.75 40.0
- grads_dim :
- y
- grads_mapping :
- linear
- grads_size :
- 721
- units :
- degrees_north
- long_name :
- latitude
- minimum :
- -90.0
- maximum :
- 90.0
- resolution :
- 0.25
array([30. , 30.25, 30.5 , 30.75, 31. , 31.25, 31.5 , 31.75, 32. , 32.25, 32.5 , 32.75, 33. , 33.25, 33.5 , 33.75, 34. , 34.25, 34.5 , 34.75, 35. , 35.25, 35.5 , 35.75, 36. , 36.25, 36.5 , 36.75, 37. , 37.25, 37.5 , 37.75, 38. , 38.25, 38.5 , 38.75, 39. , 39.25, 39.5 , 39.75, 40. ]) - lon(lon)float6410.0 10.25 10.5 ... 14.5 14.75 15.0
- grads_dim :
- x
- grads_mapping :
- linear
- grads_size :
- 1440
- units :
- degrees_east
- long_name :
- longitude
- minimum :
- 0.0
- maximum :
- 359.75
- resolution :
- 0.25
array([10.  , 10.25, 10.5 , 10.75, 11.  , 11.25, 11.5 , 11.75, 12.  , 12.25,
       12.5 , 12.75, 13.  , 13.25, 13.5 , 13.75, 14.  , 14.25, 14.5 , 14.75,
       15.  ])
- long_name :
- ** 10 m above ground v-component of wind [m/s]
In [10]:
ds.ugrd10m[0].plot()
Out[10]:
<matplotlib.collections.QuadMesh at 0x1ea084e91f0>
In [11]:
ds.msletmsl[0].plot(cmap='jet')
Out[11]:
<matplotlib.collections.QuadMesh at 0x1ea08688520>
Convert to dfs2
In [12]:
lat = ds.lat.values
lon = ds.lon.values

nx = len(lon)
ny = len(lat)

x0 = lon[0]
y0 = lat[0]

dx = np.round((lon[-1] - lon[0]) / nx,2)
dy = np.round((lat[-1] - lat[0]) / ny,2)

x0, y0, nx, ny, dx, dy
Out[12]:
(10.0, 30.0, 21, 41, 0.24, 0.24)
Time
In [13]:
t = ds.time.values
print(t[0])
start_time = pd.to_datetime(t).to_pydatetime()[0]
2021-09-02T12:00:00.000000000
Variable types
In [14]:
from mikeio.eum import EUMType
EUMType.Air_Pressure
Out[14]:
Air Pressure
In [15]:
EUMType.Air_Pressure.units
Out[15]:
[hectopascal, millibar]
In [16]:
EUMType.Wind_Velocity
Out[16]:
Wind Velocity
In [17]:
EUMType.Wind_Velocity.units
Out[17]:
[meter per sec, feet per sec, miles per hour, km per hour, knot]
This example extracts the first 10 timesteps. Note that in order to download the entire forecast, you have to handle the non-equidistant time axis.
In [18]:
ds = ds.isel(time=slice(0,10))

mslp = ds.msletmsl.values / 100 # conversion from Pa to hPa
u = ds.ugrd10m.values
v = ds.vgrd10m.values
Flip data upside down
In [19]:
mslp = np.flip(mslp, axis=1)
u = np.flip(u, axis=1)
v = np.flip(v, axis=1)
In [20]:
from mikeio.eum import EUMUnit

EUMUnit.hectopascal
Out[20]:
hectopascal
In [21]:
from mikeio.eum import ItemInfo, EUMUnit
d = [mslp, u, v]
dfsfilename = f"gfs_{dtstr}_{hour}.dfs2"
coordinate = ['LONG/LAT', x0, y0, 0]
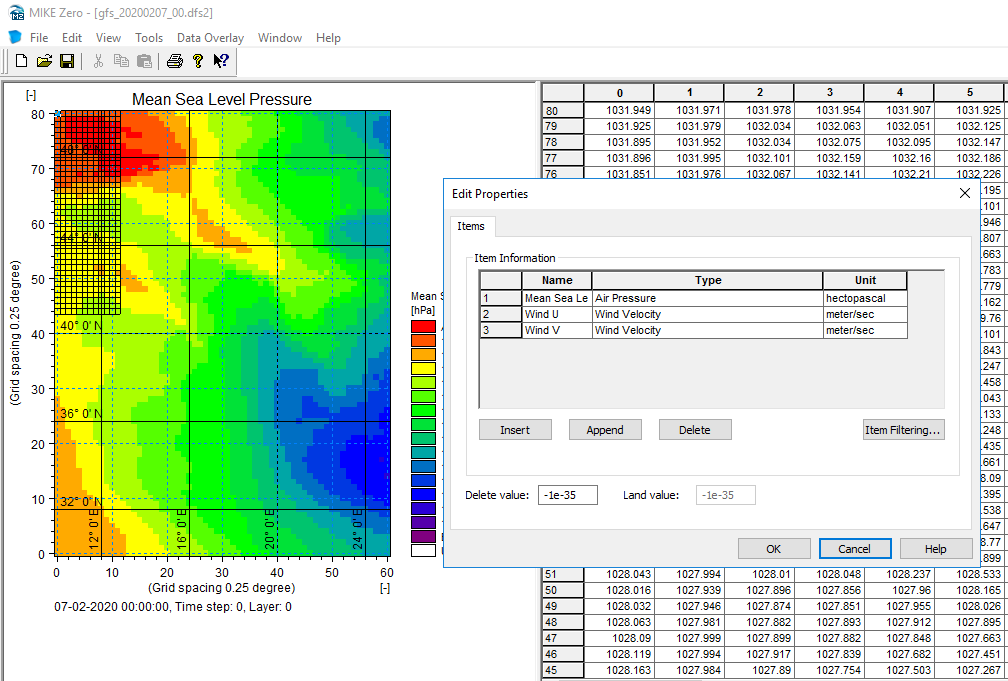
items = [ItemInfo("Mean Sea Level Pressure", EUMType.Air_Pressure, EUMUnit.hectopascal),
ItemInfo("Wind U", EUMType.Wind_Velocity, EUMUnit.meter_per_sec),
ItemInfo("Wind V", EUMType.Wind_Velocity, EUMUnit.meter_per_sec)]
dfs = Dfs2()
dfs.write(filename=dfsfilename,
data=d,
start_time = start_time,
dt=3600,
items=items,
coordinate=coordinate, dx=dx, dy=dy
)
Clean up (don't run this)
In [22]:
import os
os.remove(dfsfilename)