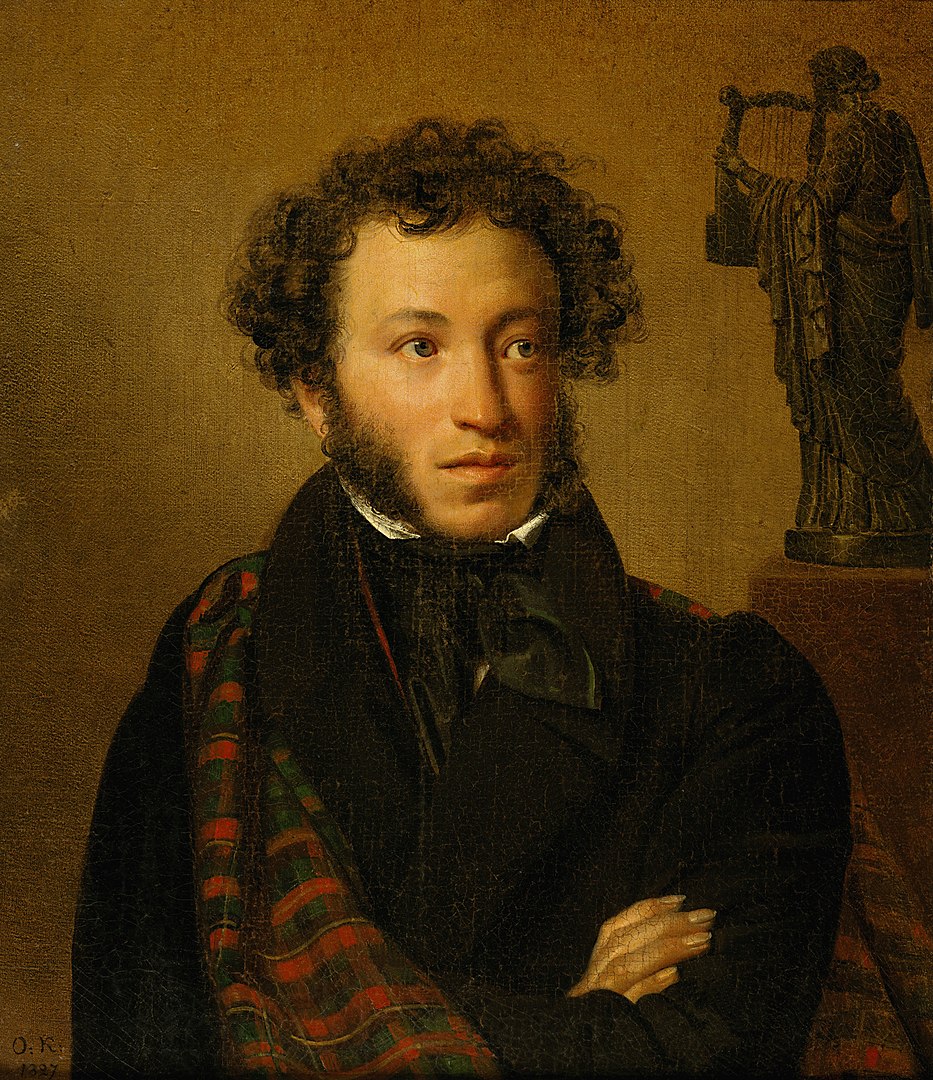
Pushkin as a Traveller
Pushkin grew up in Moscow and St. Petersburg. In 1819 he was exiled, at the age of nineteen, to a small town called Kishinev and then he was moved to his family estate in Ekaterinoslav. He remained in exile for nearly seven years until 1826 when Tsar Nicholas came to power. Below you can see a map of his travels throughout Russia.

Original version of the graph that you can see below.
Also, see the short journey through his biography.
Some data was collected from other sources, such as:
In [1]:
%useLatestDescriptors
%use dataframe
%use lets-plot
%use lets-plot-gt(gt="[30,)")
In [2]:
@file:DependsOn("org.geotools:gt-shapefile:[30,)")
@file:DependsOn("org.geotools:gt-cql:[30,)")
In [3]:
import org.geotools.data.shapefile.ShapefileDataStoreFactory
import org.geotools.data.simple.SimpleFeatureCollection
import java.net.URL

import org.geotools.filter.text.cql2.CQL
In [4]:
val factory = ShapefileDataStoreFactory()

val worldFeatures : SimpleFeatureCollection = with("naturalearth_lowres") {
    val url = "https://raw.githubusercontent.com/JetBrains/lets-plot-kotlin/master/docs/examples/shp/${this}/${this}.shp"
    factory.createDataStore(URL(url)).featureSource.features
}
val currentZone = worldFeatures.subCollection(CQL.toFilter("continent = 'Europe' OR continent = 'Asia' or continent = 'Africa'"))
In [5]:
fun <T> appendStayTime(placesDf: DataFrame<T>, movesDf: DataFrame<T>): DataFrame<T> {
    fun cityNameToYears(name: String): String {
        val departureYears: List<Int> = movesDf.sortBy("year").filter { it["departure"] == name }["year"].toList() as List<Int>
        val rawArrivalYears: List<Int> = movesDf.sortBy("year").filter { it["arrival"] == name }["year"].toList() as List<Int>
        val arrivalYears: List<Int> = if (!departureYears.isEmpty() && departureYears.min() < rawArrivalYears.min()) {
            listOf(departureYears.min()) + rawArrivalYears
        } else {
            rawArrivalYears
        }
        val allYearRanges: List<Pair<Int, Int>> = arrivalYears.map { arrivalYear ->
            val departureYear = if (departureYears.isEmpty()) {
                arrivalYear
            } else {
                departureYears.firstOrNull { it >= arrivalYear } ?: arrivalYear
            }
            Pair(arrivalYear, departureYear)
        }.sortedByDescending { it.second - it.first }
        val yearRanges: MutableList<Pair<Int, Int>> = mutableListOf()
        for (yearRange in allYearRanges) {
            val outerRange = yearRanges.firstOrNull { bigYearRange: Pair<Int, Int> -> bigYearRange.first <= yearRange.first && yearRange.second <= bigYearRange.second }
            if (outerRange == null) yearRanges.add(yearRange)
        }
        return yearRanges.sortedBy { it.first }.map { yearRange ->
            if (yearRange.first == yearRange.second) {
                yearRange.first.toString()
            } else {
                "${yearRange.first}-${yearRange.second}"
            }
        }.joinToString(", ")
    }
    return placesDf.add("years") { cityNameToYears(it["name"] as String) }
}
In [6]:
val citySize = 3
val bigCitySize = 6
val bigCities = listOf("Moscow", "Petersburg")

val rawPlacesDf = DataFrame.readCSV("https://raw.githubusercontent.com/JetBrains/lets-plot-docs/master/data/pushkin/places.csv")

val rawMovesDf = DataFrame.readCSV("https://raw.githubusercontent.com/JetBrains/lets-plot-docs/master/data/pushkin/moves.csv")

val movesDf = rawMovesDf.join(rawPlacesDf) { "departure" match "name" }
    .rename("longitude" to "from_lon").rename("latitude" to "from_lat")
    .join(rawPlacesDf) { "arrival" match "name" }
    .rename("longitude" to "to_lon").rename("latitude" to "to_lat")
    .add("size_start") { if (it["departure"] in bigCities) { bigCitySize } else { citySize } }
    .add("size_end") { if (it["arrival"] in bigCities) { bigCitySize } else { citySize } }

val placesDf = appendStayTime(rawPlacesDf, rawMovesDf)
    .add("size") { if (it["name"] in bigCities) { bigCitySize } else { citySize } }

val moscowDf = rawPlacesDf.filter { it["name"] in bigCities }
val labelsDf1 = rawPlacesDf.filter { it["name"] in listOf("Nizhny Novgorod", "Novocherkassk", "Orenburg", "Stavropol", "Tiflis", "Vladikavkaz") }
val labelsDf2 = rawPlacesDf.filter { it["name"] in listOf("Chișinău", "Erzurum", "Kiev", "Pskov", "Simferopol", "Uralsk", "Vitebsk", "Oryol", "Ekaterinoslav") }
In [7]:
val xmin = 24.0
val xmax = 64.0
val ymin = 38.0
val ymax = 62.0

letsPlot() +
    geomRect(xmin = xmin, xmax = xmax, ymin = ymin, ymax = ymax, size = 0, fill = "#eef8ff") +
    geomMap(data = currentZone.toSpatialDataset(), size = 0.1, color = "#636363", fill = "#fcfffc") +
    geomCurve(data = movesDf.toMap(), curvature = -.15, size = .75,
              arrow = arrow(type = "closed", length = 10, angle = 14))
        { x = "from_lon"; y = "from_lat"; xend = "to_lon"; yend = "to_lat"; color = "path";
          sizeStart = "size_start"; sizeEnd = "size_end" } + // It is necessary for the arrows not to overlap the points
    geomPoint(data = placesDf.toMap(), shape = 21, fill = "white",
              tooltips = layerTooltips().title("@name").line("Visited in @years"))
        { x = "longitude"; y = "latitude"; size = "size" } +
    geomText(data = moscowDf.toMap(), size = 8, fontface = "bold", hjust = 0, nudgeY = 0.75)
        { x = "longitude"; y = "latitude"; label = "name" } +
    geomText(data = labelsDf1.toMap(), size = 6, hjust = 0, nudgeX = 0.25, nudgeY = 0.5)
        { x = "longitude"; y = "latitude"; label = "name" } +
    geomText(data = labelsDf2.toMap(), size = 6, hjust = 1, nudgeX = -0.35, nudgeY = -0.1)
        { x = "longitude"; y = "latitude"; label = "name" } +
    scaleColorManual(values = listOf("#addd8e", "#e34a33", "#8856a7", "#2c7fb8",
                                     "#1c9099", "#006d2c", "#fec44f", "#636363")) +
    scaleSizeIdentity(guide = "none") +
    coordMap(xlim = xmin to xmax, ylim = ymin to ymax) +
    ggsize(800, 800) +
    ggtitle("Alexander Pushkin's Trips") +
    themeVoid() +
    theme(plotTitle = elementText(size = 20, margin = listOf(20, 0, 0, 0)), legendTitle = elementBlank())
        .legendPosition(1, 1)
        .legendJustification(1, 1)
Out[7]: