Who am I?
PhD student at University of York & Culham Culham Centre for Fusion Energy
Member of xarray's core development team
Outline
Multidimensional data analysis
What is xarray?
xarray basic features:
- Labelled multidimensional data
- Lazy loading into memory
- Plotting convenience
xarray + dask:
- Memory chunking
- Parallel analysis
Future of scientific data analysis
Multidimensional data analysis
Most plasma physicists have some similar data analysis requirements:
- Relatively large datasets (up to 100's GBs)
- Multidimensional
- Warped-grid
- Several plasma quantities (density, temperature, ...)
- Lots of metadata to attach (simulation input file, shot number ...)
- Visualise multiple dimensions easily
- Apply mathematical operations over many dimensions easily and clearly
What is xarray?
Open-source python library.
Labelling, visualisation & analysis functionality for N-dimensional data.
Developed by atmospheric physicists, who have similar data analysis needs to us.
They also have relatively large, multidimensional, warped-grid, fluid turbulence datasets to visualise and analyse.
Sponsored by NumFocus, who also support NumPy, MatPlotLib, Pandas, Jupyter, IPython, Julia...
xarray basic features:
- Labelled multidimensional data
- Clear syntax for operations
- Lazy loading into memory
- Plotting convenience
xarray: Labelled multidimensional data
xarray wraps numpy arrays with their dims as DataArrays.
Can also select data via special variables called coords.
Coordinates can be multidimensional (e.g. for mapping Orthogonal toroidal coordinates -> field-aligned coordinates)
Multiple DataArrays are stored in same Dataset.
For example, imagine we had some output from an atmospheric fluid simulation...

<xarray.Dataset>
Dimensions:        (t: 8, x: 8, y: 8)
Coordinates:
  * t              (t) int64 0 1 2 3 4 5 6 7 8
  * x              (x) int64 0 1 2 3 4 5 6 7 8
  * y              (y) int64 0 1 2 3 4 5 6 7 8
    latitude       (x, y) float32 numpy.array(8, 8)
    longitude      (x, y) float32 numpy.array(8, 8)
Data variables:
    temperature    (t, x, y) float32 numpy.array(8, 8, 8)
    precipitation  (t, x, y) float32 numpy.array(8, 8, 8)

Attributes:
    reference_time 123.0
    input          {'solver': {'mxstep': 100000000, 'type': 'cvode'}, 'timeste...
Also carries around a dictionary of "attributes". I use that to store units, normalisations etc, as well as to store my entire input file for my simulation.
numpy vs xarray: Clearer syntax for typical operations
Problem:
We have some data $n(t,x,y,z)$, and we want to find the maximum over time of the spatially-averaged density at the separatrix.
i.e. find $\text{max}(<n(t,x=\text{separatrix})>)$, where $<...>$ is an average over $y$ & $z$.
Bare numpy:
max_separatrix_density = np.max(np.mean(n[:, sep_x, ...], axis=(2,3)), axis=0)
xarray:
max_separatrix_density = ds['n'].isel(x=sep_x).mean(dim=('y', 'z')).max(dim='t')
The xarray code is clearer, more general, contains less magic numbers, and the order of operations applied reads left-to-right.
Copycats in other languages
Similar libraries implemented in at least 2 other languages, who credit inspiration to xarray.
C++ - xframe
Julia - AxisArrays.jl
xarray: Lazy loading into memory
xarray is based on using the netCDF file format.
Lazily loads data values - never waste RAM on unneeded values.
import xarray as xr

# Open a 100GB file
ds = xr.open_dataset('BOUT_data.nc')

# Select a 1GB subset of the data
data = ds.isel(y=0)

# Data is only loaded into memory here, when we actually need it
result = some_maths(data)
xarray: Plotting convenience
xarray provides plotting functions which wrap matplotlib.
data_slice = ds['phi'].isel(y=34, t=-1)

data_slice.plot()

Automatically use right type of plot for the dimension of the data (1D, 2D etc.)
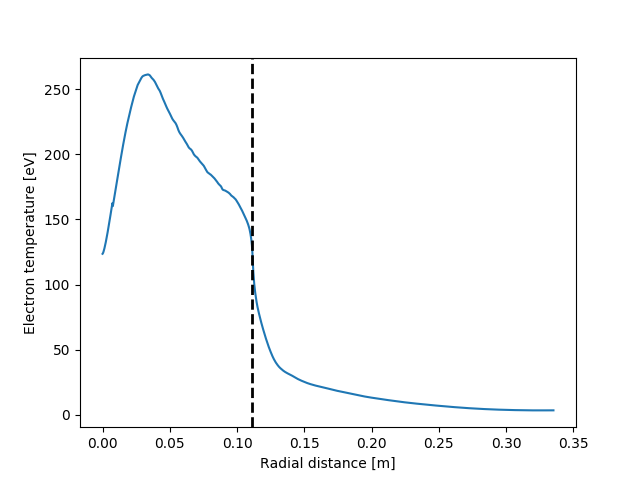
data = ds['T'].mean(dim=('t', 'y', 'z'))

fig, ax = plt.subplots()
data.plot.line(ax=ax)

plot_separatrix(data, sep_position, ax=ax)

I've used this to write functions which plot 2D animated gifs which can animate over any dimension.
data = ds['T'].isel(y=16)

data.plot(animate='time', x='radial', y='binormal', robust=True, fps=10)
plot_separatrix()

(I'm working on integrating animated plots into xarray centrally)
Accessors for domain-specific functionality
"accessors" provided for attaching your own methods to xarray objects
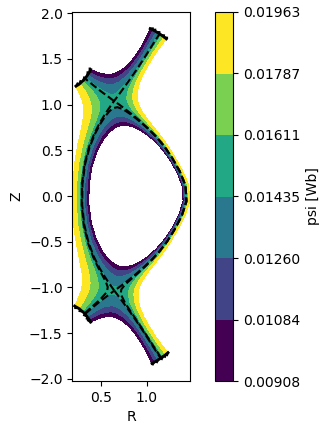
ds['psi'].bout.contourf(x='R', y='Z')

Use this neatly attach any domain-specific functionality
ds.mcf.calc_EL M_growth_rate()
xarray + dask: Memory chunking
If you also install the dask library (literally that's it, no other compiling or anything required), xarray will provide the option to load data into memory in chunks.
ds = xr.open_dataset('example-data.nc', chunks={'time': 10})

print(ds)
<xarray.Dataset>
Dimensions:      (latitude: 180, longitude: 360, time: 365)
Coordinates:
  * time         (time) datetime64[ns] 2015-01-01 2015-01-02 2015-01-03 ...
  * longitude    (longitude) int64 0 1 2 3 4 5 6 7 8 9 10 11 12 13 14 15 16 ...
  * latitude     (latitude) float64 89.5 88.5 87.5 86.5 85.5 84.5 83.5 82.5 ...
Data variables:
    temperature  (time, latitude, longitude) float64 dask.array<shape=(365, 180, 360), chunksize=(10, 180, 360)>
Now if you apply any xarray or any "embarrassingly parallel" numpy function to this dataset then it will compute the result only on one chunk at a time, and combine the results at the end.
This is very useful when you have "medium data": data larger than your system's RAM but not "big data".
xarray + dask: Parallel analysis
dask can also automatically parallelize the operation of any xarray function, and most numpy and scipy functions, using the apply_ufunc helper function:
result = xr.apply_ufunc(some_numpy_analysis_fn, ds, dask='parallelized', output=[float])
Chunking and parallelization through dask integration should allow you to easily scale up whatever analysis you were doing with numpy to work on datasets that are 100's of GBs in size.
import xarray as xr

squared_error = lambda x, y: (x - y) ** 2

arr1 = xr.DataArray([0, 1, 2, 3], dims='x')

xr.apply_ufunc(squared_error, arr1, 1)
<xarray.DataArray (x: 4)>
array([1, 0, 1, 4])
Dimensions without coordinates: x
import numpy as np

def vector_norm(x, dim, ord=None):
    return xr.apply_ufunc(np.linalg.norm, x,
                          input_core_dims=[[dim]],
                          kwargs={'ord': ord, 'axis': -1})
vector_norm(arr1, dim='x')
<xarray.DataArray ()>
array(3.741657)
How does dask work?

Dask works by:
Labelling the various operations you want to perform, using either dask objects like dask.arrays or encoding general functions using dask.delayed
Instead of evaluating these operations, it organises them into a Task Graph for later evaluation
Evaluates them using one of a set of Schedulers, which can perform in parallel.
def inc(x):
    return x + 1

def add(x, y):
    return x + y
import dask

x = dask.delayed(inc)(1)
y = dask.delayed(inc)(2)
z = dask.delayed(add)(x, y)
z.compute()
5
z.vizualize()
Near Future: array duck typing
Currently xarray wraps either numpy.ndarray or dask.array objects
Possible because they have almost same API, so xarray can select elements and call methods etc. in the same way.
But what if we extended this idea so xarray could wrap any array-like object with the same API? (so-called "duck-typing")
There are lots of numpy-like arrays in python ecosystem which do clever things:
GPU arrays with cupy.ndarray
sparse arrays with scipy.sparse
Units with astropy.units.Quantity arrays
from astropy import units as u
import numpy as np

np.array([1., 2., 3.]) * u.meter
Plan is to support wrapping any of these with xarray, so you can get benefits of all simultaneously!
e.g. A labelled, unit-aware, GPU-parallelised array in python!!
Resources
Blog post introducing xarray: http://stephanhoyer.com/2015/06/11/xray-dask-out-of-core-labeled-arrays/
xarray GitHub: https://github.com/pydata/xarray/
xarray documentation: http://xarray.pydata.org/en/stable/
xarray documentation on dask integration: http://xarray.pydata.org/en/stable/dask.html
Other useful blogs/tutorials: http://meteo.unican.es/work/xarray_seminar/xArray_seminar.html https://rabernat.github.io/research_computing/xarray.html
Useful page from the dask documentation explaining the general idea: http://docs.dask.org/en/latest/delayed.html
Interview with dask's main developer https://notamonadtutorial.com/interview-with-dasks-creator-scale-your-python-from-one-computer-to-a-thousand-b4483376f200
Bonus: Data analysis software stack using xarray + dask
Pangeo - "A community platform for Big Data geoscience"

Bonus: xgcm for staggered grids and complex topologies
Interesting work going on in the xgcm package https://github.com/xgcm/xgcm
xgcm (Xarray for Global Circulation Models) aims to provide objects which encode complex grids for use with xarray.
Can encode and perform operations on staggered grids:
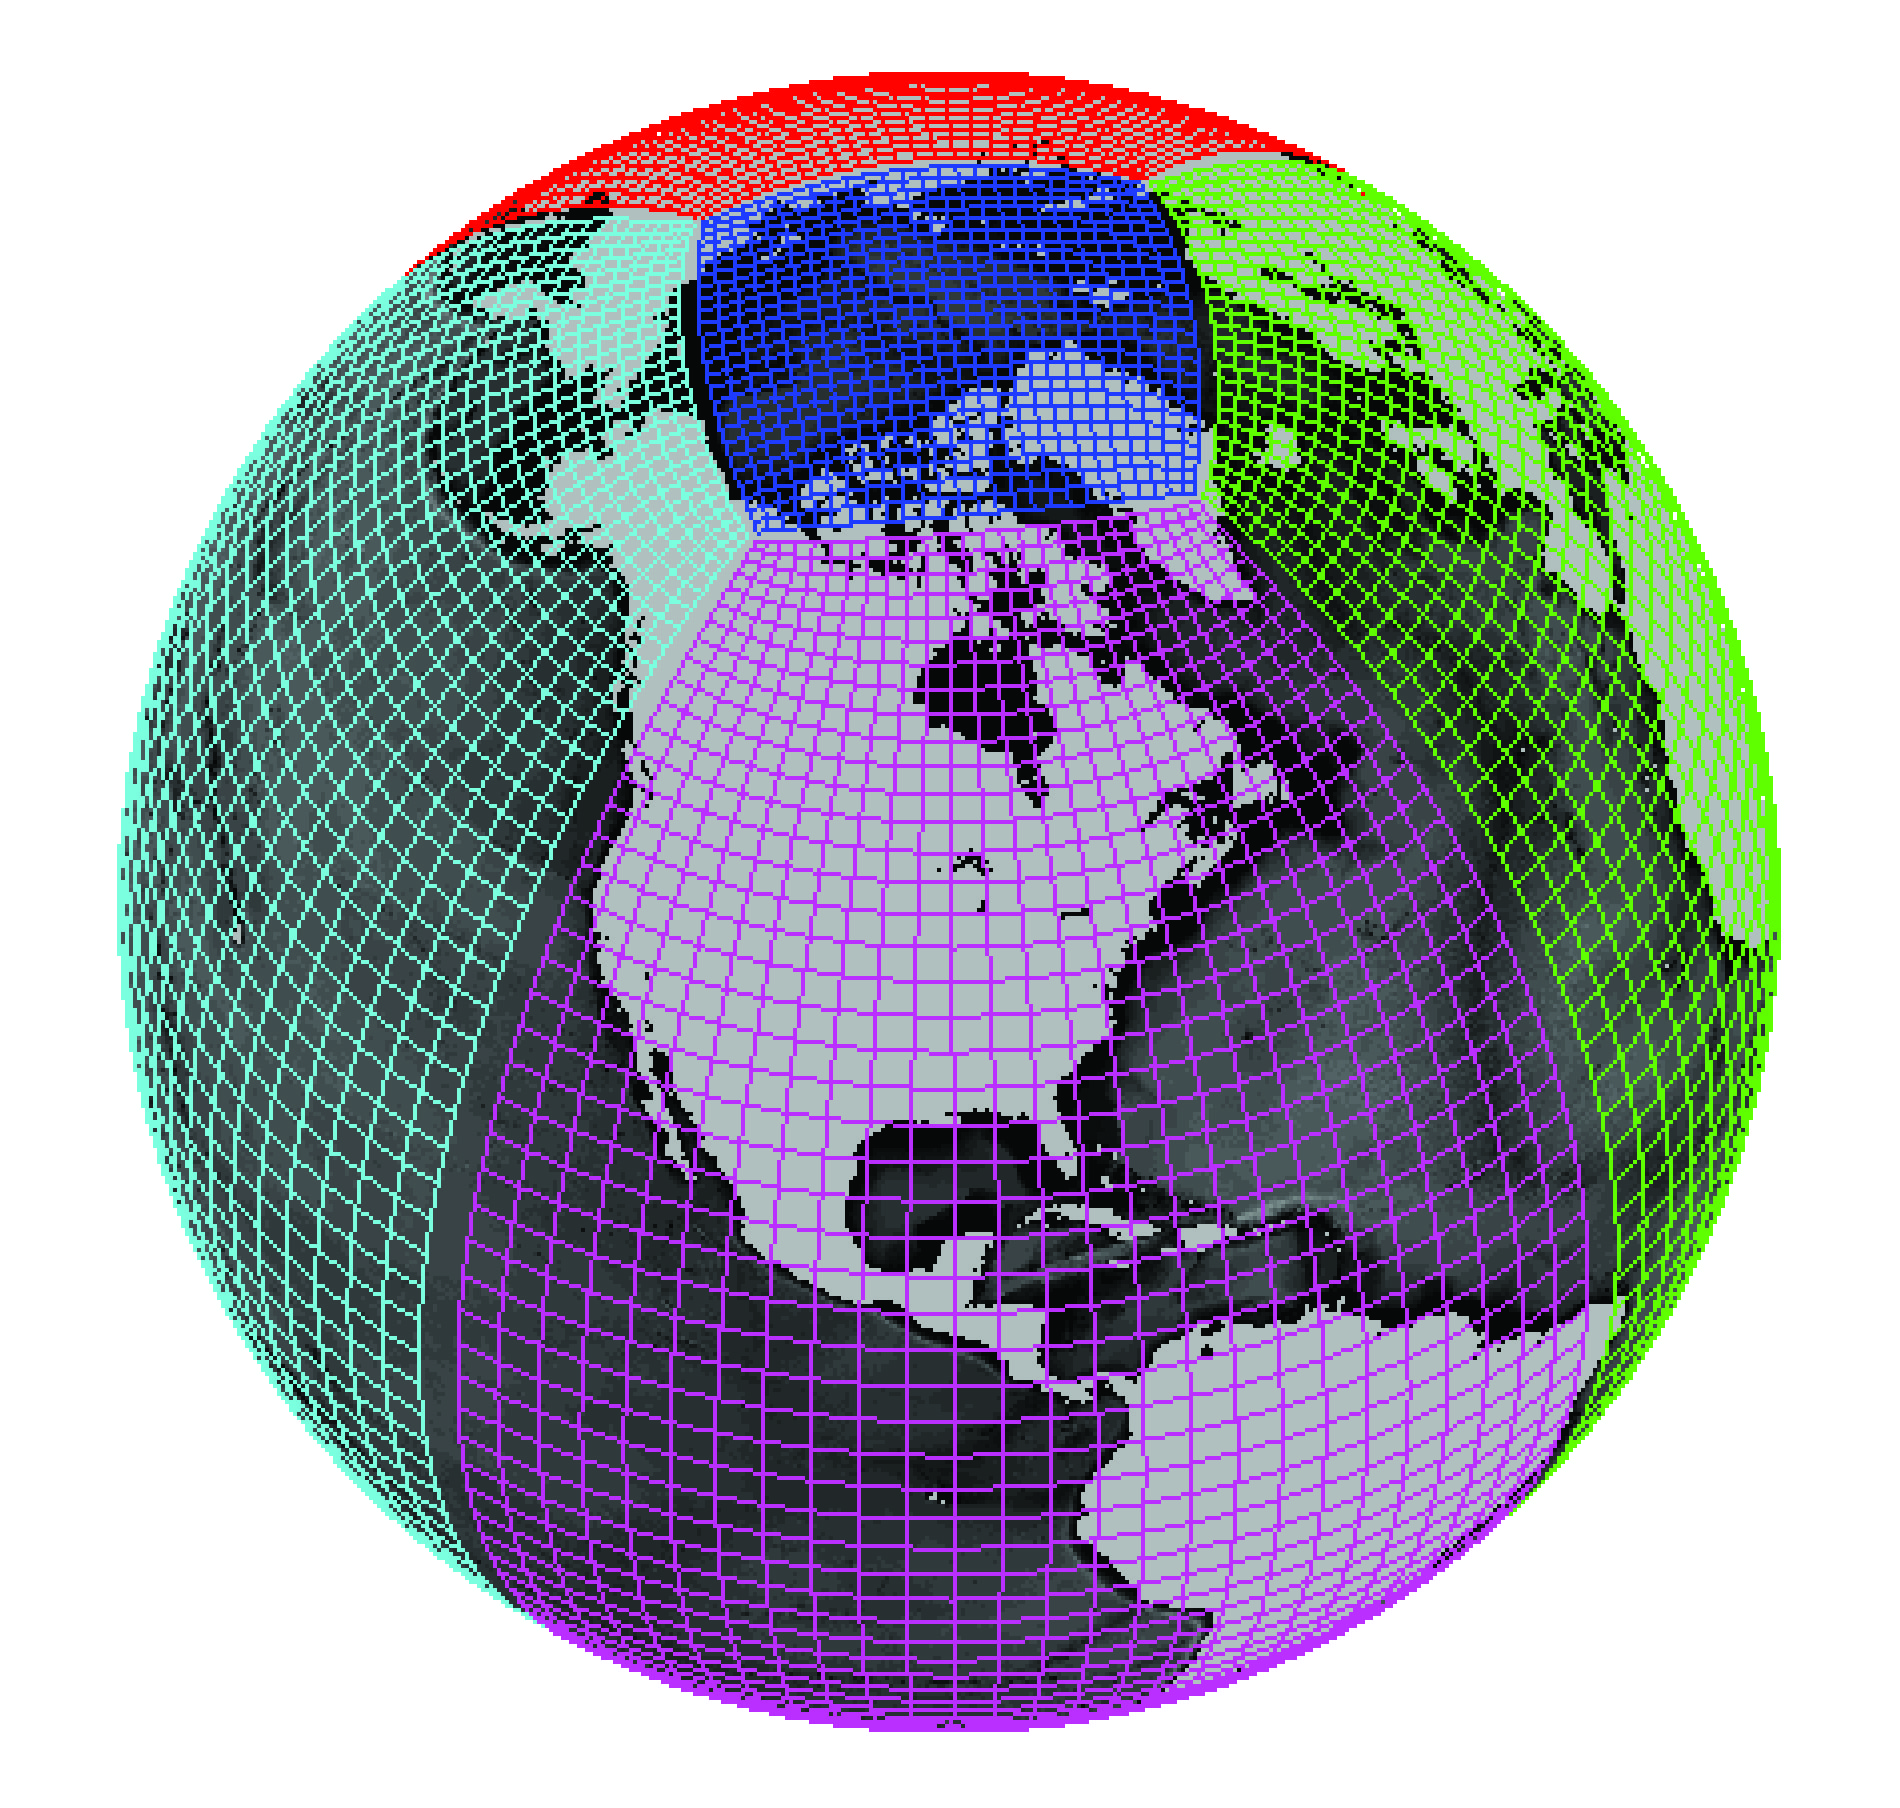
and encode complex topologies by storing connections between different cartesian grids:
