Find this project in Github: UberHowley/MOOC-File-Processing
Python Processing of the QuickHelper System Logfiles
In Massive Open Online Courses (MOOCs), it is common for students to use the discussion forums to seek help, but oftentimes their discussion thread gets buried under hundreds of other threads resulting in their question never being answered. Our QuickHelper system uses a social recommendation algorithm to recommend three qualified peers that the student can invite to their public discussion thread, but how do we present the selected peers in such a way as to increase the number of helpers selected?
I used Python to clean the logfile data, gensim to assign automated [LDA] topics to each message board post, and pandas to perform statistical analyses in order to answer this research question.
Research Questions
Our QuickHelper system was designed to advise students on which peers they might want to help them, but also to answer theory-based questions about student motivation and decision-making in the face of common interactional archetypes employed in MOOCs. This yielded the following research questions:
- Does the presence of Help Giver badges increase the number of helpers students invite to their question thread? (isBadgeCondition --> numHelpersSelected)
- Does the number of stars shown on the badge impact whether or not the peer is selected?
- Does showing expertise information about potential helpers increase the number of helpers the student invites to her question thread? (sentenceType --> numHelpersSelected)
- Does the number of weeks joined or the topic knowledge match percentage increase the likelihood of a peer being selected?
- Does knowing your selected helpers will be up or downvoting on the quality of the question negatively impact the number of helpers invited to the question thread? (isVotingCondition --> numHelpersSelected)
- Do the badges or expertise sentences lessen the negative effects of the up and down voting?
I discuss these questions and the experimental set up more in-depth here.
The QuickHelper System
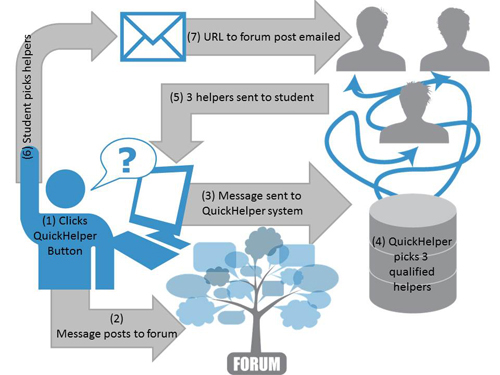
The QuickHelper system process is shown in the figure below. (1) The student clicks the QuickHelper button and writes her question. (2) The question posts to the public discussion forum. (3) Simultaneously, the message board post is submitted to the QuickHelper system. (4) The QuickHelper system selects 3 qualified potential helpers based on information it knows about the students and the provided question. (5) The QuickHelper system shows the student the 3 selected potential helpers. (6) The student picks 0-3 helpers. (7) The system emails the selected helpers with a link to the discussion forum post. (8) [not shown] The helpers may or may not click the link from the email.
 When designing the QuickHelper system, we had to take into consideration our logging needs with respect to our research questions. There are three separate moments of timing in our system, yielding at least four logs: (1) At step 4 where the system selects helpers, (2) step 5 where the system presents the helpers to the student. (3) At step 6 where the students picks 0-3 helpers. (4) Step 8 where the helpers click the link they receive via email and potentially up/downvote the question. In this analysis, we're mostly concerned with the first three logs:
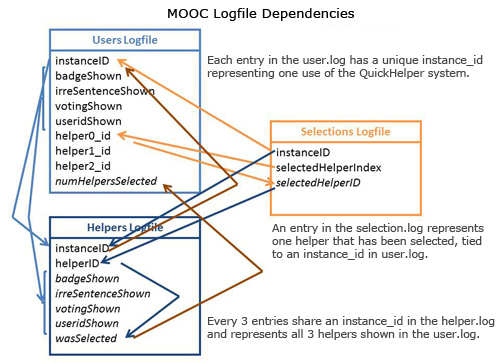
 user.log, helper.log, and selection.log. Each line in user.log represents one question/forum message (i.e., one usage of the QuickHelper system). One line in user.log has three corresponding lines in helper.log: one for each potential helper shown to the student. One line in selection.log represents a single helper that was selected.
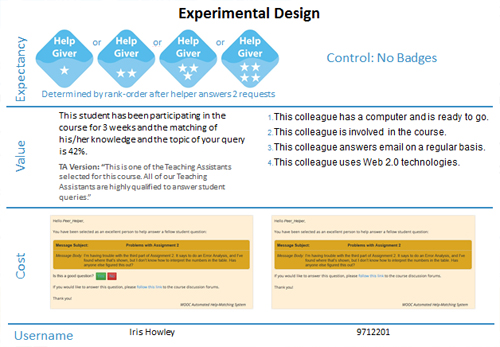 Somewhere between steps 4 and 5, before the QuickHelper system shows the student her potential helpers, the system assigns this particular QuickHelper instance to a series of conditions relating to ways of presenting the potential helpers. This include the badge/expectancy emphasis condition in which Help Giver badges with 0-3 stars are shown. There is also an expertise/value emphasis condition in which either an irrelevant sentence or a relevant sentence including the helpers' number of weeks active and topic match percentage is shown. The third condition is a up-downvoting/cost emphasis condition, in which the student is shown a preview of the message that the system will send to the selected helpers. The message either shows that the helper will vote on the quality of the question, or not.
Processing Logfiles
Processing the logfiles removes the metadata and major inconsistencies in the raw data in order to prepare it for analysis by external programs. There were (1) various errors in the logging software (i.e., mysterious duplicates whose instance IDs were different, extra columns on some lines with a URL), (2) general cleaning that was necessary (i.e., removing test entries, removing entries from our researchers, removing entries outside the course date range), and (3) more complicated post-processing that was necessary (i.e., cross-referencing and compiling values from one logfile into another). My logfileMOOC.py script compiles and resolves all the log inter-dependencies, as shown below.:
QuickHelper Version
In the initial two weeks of the course, the QuickHelper system did not have enough information to be able to recommend helpers. This 'cold start' required the implementation of two versions of the system: the TA version, and the student version. In the TA version, all selected helpers were actually volunteer teaching assistants for the course. Assignment to the badge and voting conditions remained the same, but all helpers would be shown with 4 stars on their badge, if in the isBadgeCondition. The TA version did not have anyone in the anonymized isUsernameCondition nor did the isIrrelevantSentence condition exist: all TAs were shown with the same sentence.
Removing Duplicates
The 'mysterious duplicates' were an interesting side issue. Previously, we had been removing what appeared to be duplicate instances from the log manually. The issue was that these duplicates would have the same author, question title/body, and date, but everything else would be different. I created a duplicate key for each QuickHelper instance using the author, question title, and date. The duplicate key was used in a dictionary to map to a list of all the duplicates that shared that key. To determine which duplicate was the instance the user actually saw, I iterated through each list of duplicates and found the one with entries in the selection.log (i.e., the user only selected helpers from one instance, the real one). If there was no helper was selected, I removed all information that the duplicates did not share. By random chance, some of the duplicates would share conditions or helpers shown. This did result in some columns missing data for some entries in the user and helper logfiles, but there was no other way to determine which duplicate was the instance seen by the user.
# example code - do not execute
def remove_duplicates():
    """
    Remove duplicates from our list of instances, based on whatever key was used in duplicate_instances
    :return: A list of QHInstances with all duplicates removed
    """
    for duplicate_key in instances_by_dupkey:  # iterate through each key in our duplicate-arranged list
        selected_dup = None  # instance with a selection (the one shown)
        for dup in instances_by_dupkey[duplicate_key]:  # for each instance object in these duplicates
            num_helpers = dict_num_helpers.get(getattr(dup, 'instance_id'), 0)
            if num_helpers > 0:  # If it has helpers selected, it's the one
                selected_dup = dup
                setattr(dup, 'num_helpers_selected', num_helpers)
        if selected_dup is None:
                selected_dup = create_new_duplicate(instances_by_dupkey[duplicate_key])  # Clear out non-matching condition variables
        list_no_duplicates.append(selected_dup)  # Record selected_dup as our correct one
        # Store this sentence, too (for topic modeling)
        list_sentences.append(ldat.clean_string(" ".join([getattr(selected_dup, 'question_title', ''), ' '+getattr(selected_dup,'question_body','')])))

        if len(instances_by_dupkey[duplicate_key]) > 1:  # counting our duplicates
            global count_repeat
            count_repeat += len(instances_by_dupkey[duplicate_key])-1
    return list_no_duplicates
See a sample of two (simulated) lines from the outputted logfile below: the bottom line being produced from several duplicates that shared helper ID numbers, isVotingCondition, among other expected features (question title, question body, author, date, etc.). Condition assignments that did not match across all duplicates are removed.
| instanceID | version | isBadgeCond | isIrrelevantSentence | isVotingCond | isNameCond | helper0 | helper1 | helper2 | numHelpersSelected |
| 1234...7890 | student | n | n | y | y | 135790 | 246802 | 998877 | 0 |
| 0987...4321 | student | y | 235689 | 986532 | 555123 | 0 |
Statistical Analysis
I used the pandas and statsmodels libraries to run descriptive statistics, generate plots to better understand the data, and answer our research questions (from above). The main effects of interest were the categorical condition variables (i.e., isBadgeCondition, sentenceType, isVotingCondition) and the scalar dependent variable, number of helpers selected.
It's important to note that this analysis was done on an uncleaned version of the dataset (i.e., posts that are clearly not help requests have not been removed), and so the results discussed here vary slightly from those in the related publications.
# necessary libraries/setup
%matplotlib inline
import utilsMOOC as utils  # separate file that contains all the constants we need
import pandas as pd
import matplotlib.pyplot as plt
import seaborn as sns  # importing seaborns for its factorplot
sns.set_style("darkgrid")

data = pd.io.parsers.read_csv("user.csv", encoding="utf-8-sig")
conditions = [utils.COL_VERSION, utils.COL_BADGE, utils.COL_SENTENCE_TYPE, utils.COL_VOTING]  # all our categorical IVs of interest
outcome = utils.COL_NUMHELPERS
Descriptive Statistics
Descriptive statistics showed that 75% of users selected zero helpers, with 3 and 1 helpers being seelcted the second and third most popular choice, respectively.
# Min & Max numHelpers should be 0-3
df = data[[outcome]]
df.describe()
| numHelpersSelected | |
|---|---|
| count | 159.000000 |
| mean | 0.779874 |
| std | 1.156423 |
| min | 0.000000 |
| 25% | 0.000000 |
| 50% | 0.000000 |
| 75% | 1.000000 |
| max | 3.000000 |
# Look at a descriptive plot of our outcome variable
helpers_by_date = data[outcome]
helpers_by_date.index = data[utils.COL_DATE]
helpers_by_date = helpers_by_date.cumsum()

# num helpers selected over time
# This plot would be more useful as a debugging tool when the system is live.
# It shows how many helpers are selected over time.
fig = plt.figure()
ax1 = fig.add_subplot(121)
ax1 = helpers_by_date.plot(title=outcome+" Selected Over Time")
ax1.locator_params(axis='x', nbins=6)
ax1.set_xlabel(utils.COL_DATE)
ax1.set_ylabel("Cumulative "+outcome)

# histogram of num helpers
# Here we see that
ax2 = fig.add_subplot(122)
helpers_hist = data[outcome]
ax2 = helpers_hist.plot(kind='hist', title="Histogram "+outcome, by=outcome)
ax2.locator_params(axis='x', nbins=4)
ax2.set_xlabel(outcome+" (0,1,2,3)")
ax2.set_ylabel("Num Instances")

fig.tight_layout()

When looking at the independent variables, we see that random assignment to all conditions was mostly successful (approximately even distribution to all conditions), except in the case of 'version', but this was not random assignment. This code also outputs the mean number of helpers selected in each condition and we can start to identify an interesting pattern in the sentenceCondition (i.e., more helpers being selected in relevant sentence condition) and the isVotingCondition (i.e., more helpers being selected when there is no voting). Both of these trends support our research questions in the hypothesized directions.
df = data[conditions+[outcome]]
for cond in conditions:
    print(pd.concat([df.groupby(cond)[cond].count(), df.groupby(cond)[outcome].mean()], axis=1))
         version  numHelpersSelected
version
TA            45            0.844444
student      114            0.754386
                  isBadgeCondition  numHelpersSelected
isBadgeCondition
n                               70            0.928571
y                               73            0.808219
                   sentenceCondition  numHelpersSelected
sentenceCondition
TA                                20            1.000000
irrelevant                        82            0.621951
relevant                          57            0.929825
                   isVotingCondition  numHelpersSelected
isVotingCondition
n                                 69            1.115942
y                                 67            0.701493
Answering Our Research Questions
The research questions require a bit of statistics to answer. In the case of a single factor with two levels we use a t-test to determine if the independent variable in question has a significant effect on the outcome variable. In the case of a single factor with more than two levels, we use a one-way Analysis of Variance (ANOVA). With more than one factor we use a two-way ANOVA. These are all essentially similar linear models (ordinary least squares), with slightly different equations or statistics for determining significance.
Does the presence of Help Giver badges increase the number of helpers students invite to their question thread?
(isBadgeCondition --> numHelpersSelected)
To answer this question, we run a t-test and find that the p-value is 0.54, which is not less than 0.05. isBadgeCondition does not have a significant effect on number of helpers selected (i.e., any differences between the two badge conditions are likely due to random variance).
from statsmodels.stats.weightstats import ttest_ind
cond = utils.COL_BADGE
df = data[[cond, outcome]].dropna()

cat1 = df[df[cond] == 'y'][outcome]
cat2 = df[df[cond] == 'n'][outcome]

tstat, pval, degf = ttest_ind(cat1, cat2)  # returns t-stat, p-value, and degrees of freedom
print("t-stat: ", tstat, ", p-value: ", pval, ", df: ", degf)

# boxplot
if (pval <= 0.1):
    fig = plt.figure()
    ax = fig.add_subplot(111)
    ax = df.boxplot(outcome, cond, ax=plt.gca())
    ax.set_xlabel(cond)
    ax.set_ylabel(outcome)
    fig.tight_layout()
t-stat: -0.604139027211 , p-value: 0.546722036629 , df: 141.0
Does showing expertise information about potential helpers increase the number of helpers the student invites to her question thread?
(sentenceType --> numHelpersSelected)
We run a one-way ANOVA to answer this question, and the p-value of 0.4 is not significant.
# need a few more libraries for ANOVA analysis
from statsmodels.formula.api import ols
from statsmodels.stats.anova import anova_lm

cond = utils.COL_SENTENCE_TYPE
df = data[[cond, outcome]].dropna()

cond_lm = ols(outcome + " ~ C(" + cond + ")", data=df).fit()
anova_table = anova_lm(cond_lm)
print(anova_table)
print(cond_lm.summary())

# boxplot
fig = plt.figure()
ax = fig.add_subplot(111)
ax = df.boxplot(outcome, cond, ax=plt.gca())
ax.set_xlabel(cond)
ax.set_ylabel(outcome)
fig.tight_layout()
                       df      sum_sq   mean_sq         F    PR(>F)
C(sentenceCondition)    2    4.295811  2.147906  1.618713  0.201464
Residual              156  206.999786  1.326922       NaN       NaN
                            OLS Regression Results
==============================================================================
Dep. Variable:     numHelpersSelected   R-squared:                       0.020
Model:                            OLS   Adj. R-squared:                  0.008
Method:                 Least Squares   F-statistic:                     1.619
Date:                Sun, 10 May 2015   Prob (F-statistic):              0.201
Time:                        21:29:54   Log-Likelihood:                -246.58
No. Observations:                 159   AIC:                             499.2
Df Residuals:                     156   BIC:                             508.4
Df Model:                           2
Covariance Type:            nonrobust
======================================================================================================
                                         coef    std err          t      P>|t|      [95.0% Conf. Int.]
------------------------------------------------------------------------------------------------------
Intercept                              1.0000      0.258      3.882      0.000         0.491     1.509
C(sentenceCondition)[T.irrelevant]    -0.3780      0.287     -1.316      0.190        -0.946     0.189
C(sentenceCondition)[T.relevant]      -0.0702      0.299     -0.234      0.815        -0.662     0.521
==============================================================================
Omnibus:                       25.812   Durbin-Watson:                   1.897
Prob(Omnibus):                  0.000   Jarque-Bera (JB):               34.405
Skew:                           1.130   Prob(JB):                     3.38e-08
Kurtosis:                       2.704   Cond. No.                         6.01
==============================================================================

Warnings:
[1] Standard Errors assume that the covariance matrix of the errors is correctly specified.

When we remove the TA version from our analysis, we see that irrelevant/relevant sentence still has no significant effect on number of helpers selected (p = 0.19).
cond = utils.COL_IRRELEVANT
df = data[[cond, outcome]].dropna()

cat1 = df[df[cond] == 'y'][outcome]
cat2 = df[df[cond] == 'n'][outcome]

tstat, pval, degf = ttest_ind(cat1, cat2)  # returns t-stat, p-value, and degrees of freedom
print("t-stat: ", tstat, ", p-value: ", pval, ", df: ", degf)

# boxplot
if (pval <= 0.1):
    fig = plt.figure()
    ax = fig.add_subplot(111)
    ax = df.boxplot(outcome, cond, ax=plt.gca())
    ax.set_xlabel(cond)
    ax.set_ylabel(outcome)
    fig.tight_layout()
t-stat: -1.50387557813 , p-value: 0.134915217758 , df: 137.0
Does knowing your selected helpers will be up or downvoting on the quality of the question negatively impact the number of helpers invited to the question thread?
(isVotingCondition --> numHelpersSelected)
The voting condition does appear to have a significant effect on number of helpers selected, with a p-value of 0.04. The boxplot shows us that help-seekers in the voting condition (y) select less helpers than those in the not-voting condition (n).
cond = utils.COL_VOTING
df = data[[cond, outcome]].dropna()

cat1 = df[df[cond] == 'y'][outcome]
cat2 = df[df[cond] == 'n'][outcome]

tstat, pval, degf = ttest_ind(cat1, cat2)  # returns t-stat, p-value, and degrees of freedom
print("t-stat: ", tstat, ", p-value: ", pval, ", df: ", degf)

# boxplot
if (pval <= 0.1):
    fig = plt.figure()
    ax = fig.add_subplot(111)
    ax = df.boxplot(outcome, cond, ax=plt.gca())
    ax.set_xlabel(cond)
    ax.set_ylabel(outcome)
    fig.tight_layout()
t-stat: -2.03408023964 , p-value: 0.0439169027261 , df: 134.0

Interaction Analyses
Since the conditions discussed in this analysis were being shown simultaneously, it is important to examine the interaction between variables.
Do the badges lessen the negative effects of the up and down voting?
isBadgeCondition X isVotingCondition --> numHelpersSelected
The OLS output suggests a marginal trend (p = 0.07, which is less than 0.1) for this interaction.
col_names = [utils.COL_BADGE, utils.COL_VOTING, utils.COL_NUMHELPERS]
factor_groups = data[col_names].dropna()

formula = col_names[2] + " ~ C(" + col_names[0] + ") + C(" + col_names[1] + ")"
formula_interaction = formula.replace('+', '*')

print("= = = = = = = = " + formula + " = = = = = = = =")
lm = ols(formula, data=factor_groups).fit()  # linear model
print(lm.summary())

print("\n= = = = = = = = " + formula_interaction + " = = = = = = = =")
lm_interaction = ols(formula_interaction, data=factor_groups).fit()  # interaction linear model
print(lm_interaction.summary())

# Do an ANOVA check
print("\n= = = = = = = = comparing ANOVA to interaction ANOVA = = = = = = = =")
print(anova_lm(lm, lm_interaction))

print("= = = = = = = = anova_lm(" + formula_interaction + ") = = = = = = = =")
print(anova_lm(lm_interaction))
= = = = = = = = numHelpersSelected ~ C(isBadgeCondition) + C(isVotingCondition) = = = = = = = =
                            OLS Regression Results
==============================================================================
Dep. Variable:     numHelpersSelected   R-squared:                       0.039
Model:                            OLS   Adj. R-squared:                  0.025
Method:                 Least Squares   F-statistic:                     2.692
Date:                Sun, 10 May 2015   Prob (F-statistic):             0.0715
Time:                        21:47:30   Log-Likelihood:                -211.97
No. Observations:                 134   AIC:                             429.9
Df Residuals:                     131   BIC:                             438.6
Df Model:                           2
Covariance Type:            nonrobust
=============================================================================================
                                coef    std err          t      P>|t|      [95.0% Conf. Int.]
---------------------------------------------------------------------------------------------
Intercept                     1.2381      0.183      6.775      0.000         0.877     1.600
C(isBadgeCondition)[T.y]     -0.1653      0.206     -0.803      0.424        -0.573     0.242
C(isVotingCondition)[T.y]    -0.4552      0.206     -2.211      0.029        -0.862    -0.048
==============================================================================
Omnibus:                       22.221   Durbin-Watson:                   2.123
Prob(Omnibus):                  0.000   Jarque-Bera (JB):               19.786
Skew:                           0.854   Prob(JB):                     5.05e-05
Kurtosis:                       2.211   Cond. No.                         3.29
==============================================================================

Warnings:
[1] Standard Errors assume that the covariance matrix of the errors is correctly specified.

= = = = = = = = numHelpersSelected ~ C(isBadgeCondition) * C(isVotingCondition) = = = = = = = =
                            OLS Regression Results
==============================================================================
Dep. Variable:     numHelpersSelected   R-squared:                       0.067
Model:                            OLS   Adj. R-squared:                  0.045
Method:                 Least Squares   F-statistic:                     3.093
Date:                Sun, 10 May 2015   Prob (F-statistic):             0.0293
Time:                        21:47:30   Log-Likelihood:                -210.05
No. Observations:                 134   AIC:                             428.1
Df Residuals:                     130   BIC:                             439.7
Df Model:                           3
Covariance Type:            nonrobust
======================================================================================================================
                                                         coef    std err          t      P>|t|      [95.0% Conf. Int.]
----------------------------------------------------------------------------------------------------------------------
Intercept                                              1.4516      0.212      6.861      0.000         1.033     1.870
C(isBadgeCondition)[T.y]                              -0.5627      0.289     -1.950      0.053        -1.134     0.008
C(isVotingCondition)[T.y]                             -0.8634      0.293     -2.952      0.004        -1.442    -0.285
C(isBadgeCondition)[T.y]:C(isVotingCondition)[T.y]     0.7927      0.408      1.945      0.054        -0.014     1.599
==============================================================================
Omnibus:                       19.189   Durbin-Watson:                   2.035
Prob(Omnibus):                  0.000   Jarque-Bera (JB):               18.594
Skew:                           0.842   Prob(JB):                     9.17e-05
Kurtosis:                       2.297   Cond. No.                         6.96
==============================================================================

Warnings:
[1] Standard Errors assume that the covariance matrix of the errors is correctly specified.

= = = = = = = = comparing ANOVA to interaction ANOVA = = = = = = = =
   df_resid         ssr  df_diff   ss_diff         F   Pr(>F)
0       131  185.624318        0       NaN       NaN      NaN
1       130  180.377360        1  5.246958  3.781542  0.05398
= = = = = = = = anova_lm(numHelpersSelected ~ C(isBadgeCondition) * C(isVotingCondition)) = = = = = = = =
                                           df      sum_sq   mean_sq         F  \
C(isBadgeCondition)                         1    0.703007  0.703007  0.506665
C(isVotingCondition)                        1    6.926407  6.926407  4.991939
C(isBadgeCondition):C(isVotingCondition)    1    5.246958  5.246958  3.781542
Residual                                  130  180.377360  1.387518       NaN

                                            PR(>F)
C(isBadgeCondition)                       0.477862
C(isVotingCondition)                      0.027174
C(isBadgeCondition):C(isVotingCondition)  0.053980
Residual                                       NaN
# You have things available in the calling namespace available in the formula evaluation namespace
# http://statsmodels.sourceforge.net/devel/examples/generated/example_interactions.html
print("= = = = = = = = = = = = = = = = = = = = = = = = = = = = = =")
print("= = " + formula + " ANOVA = = ")
print("= = vs. " + formula_interaction + " = =")
print(anova_lm(lm, lm_interaction))

print("= = = = = = = = = = = = = = = = = = = = = = = = = = = = = =")
f_just_first = col_names[2] + " ~ C(" + col_names[0] + ")"
print("= = " + f_just_first + " ANOVA = = ")
print("= = vs. " + formula + " = =")
print(anova_lm(ols(f_just_first, data=factor_groups).fit(), ols(formula, data=factor_groups).fit()))

print("= = = = = = = = = = = = = = = = = = = = = = = = = = = = = =")
f_just_second = col_names[2] + " ~ C(" + col_names[1] + ")"
print("= = " + f_just_second + " = = ")
print("= = vs. " + formula + " = =")
print(anova_lm(ols(f_just_second, data=factor_groups).fit(), ols(formula, data=factor_groups).fit()))
= = = = = = = = = = = = = = = = = = = = = = = = = = = = = =
= = numHelpersSelected ~ C(isBadgeCondition) + C(isVotingCondition) ANOVA = =
= = vs. numHelpersSelected ~ C(isBadgeCondition) * C(isVotingCondition) = =
   df_resid         ssr  df_diff   ss_diff         F   Pr(>F)
0       131  185.624318        0       NaN       NaN      NaN
1       130  180.377360        1  5.246958  3.781542  0.05398
= = = = = = = = = = = = = = = = = = = = = = = = = = = = = =
= = numHelpersSelected ~ C(isBadgeCondition) ANOVA = =
= = vs. numHelpersSelected ~ C(isBadgeCondition) + C(isVotingCondition) = =
   df_resid         ssr  df_diff   ss_diff         F    Pr(>F)
0       132  192.550725        0       NaN       NaN       NaN
1       131  185.624318        1  6.926407  4.888149  0.028777
= = = = = = = = = = = = = = = = = = = = = = = = = = = = = =
= = numHelpersSelected ~ C(isVotingCondition) = =
= = vs. numHelpersSelected ~ C(isBadgeCondition) + C(isVotingCondition) = =
   df_resid         ssr  df_diff   ss_diff         F    Pr(>F)
0       132  186.537313        0       NaN       NaN       NaN
1       131  185.624318        1  0.912995  0.644325  0.423603
# plotting
from statsmodels.graphics.api import interaction_plot

fig = plt.figure()
print("")
ax1 = sns.factorplot(x=col_names[1], y=col_names[2], data=factor_groups, kind='point', ci=95)
ax1.set(ylim=(0, 2))
ax2 = sns.factorplot(x=col_names[1], hue=col_names[0], y=col_names[2], data=factor_groups, kind='point', ci=95)
ax2.set(ylim=(0, 2))
#ax2 = interaction_plot(factor_groups[col_names[1]], factor_groups[col_names[0]], factor_groups[col_names[2]], colors=['red', 'blue'], markers=['D', '^'], ms=10, ax=plt.gca())

ax3 = factor_groups.boxplot(return_type='axes', column=col_names[2], by=[col_names[1], col_names[0]])

plt.tight_layout()
<matplotlib.figure.Figure at 0xaf23a20>


Do the expertise sentences lessen the negative effects of the up and down voting?
sentenceType X isVotingCondition --> numHelpersSelected
The OLS output suggests another marginal effect of this interaction on number of helpers selected (p = 0.06). Our interaction plots show that when up/downvoting is not used, all three sentence types are rather indistinguishable. However, when up and down voting is used, a relevant expertise sentence appears to reduce the negative effect of voting, while an irrelevant expertise sentence does not increase the number of helpers selected.
TODO: I need to determine how to do a post-hoc statistical test to determine which groups are significantly distinguishable from each other.
col_names = [utils.COL_SENTENCE_TYPE, utils.COL_VOTING, utils.COL_NUMHELPERS]
factor_groups = data[col_names].dropna()

formula = col_names[2] + " ~ C(" + col_names[0] + ") + C(" + col_names[1] + ")"
formula_interaction = formula.replace('+', '*')

print("= = = = = = = = " + formula + " = = = = = = = =")
lm = ols(formula, data=factor_groups).fit()  # linear model
print(lm.summary())

print("\n= = = = = = = = " + formula_interaction + " = = = = = = = =")
lm_interaction = ols(formula_interaction, data=factor_groups).fit()  # interaction linear model
print(lm_interaction.summary())

# Do an ANOVA check
print("\n= = = = = = = = comparing ANOVA to interaction ANOVA = = = = = = = =")
print(anova_lm(lm, lm_interaction))

print("= = = = = = = = anova_lm(" + formula_interaction + ") = = = = = = = =")
print(anova_lm(lm_interaction))
= = = = = = = = numHelpersSelected ~ C(sentenceCondition) + C(isVotingCondition) = = = = = = = =
                            OLS Regression Results
==============================================================================
Dep. Variable:     numHelpersSelected   R-squared:                       0.053
Model:                            OLS   Adj. R-squared:                  0.031
Method:                 Least Squares   F-statistic:                     2.440
Date:                Sun, 10 May 2015   Prob (F-statistic):             0.0673
Time:                        21:35:24   Log-Likelihood:                -213.79
No. Observations:                 136   AIC:                             435.6
Df Residuals:                     132   BIC:                             447.2
Df Model:                           3
Covariance Type:            nonrobust
======================================================================================================
                                         coef    std err          t      P>|t|      [95.0% Conf. Int.]
------------------------------------------------------------------------------------------------------
Intercept                              1.2417      0.287      4.324      0.000         0.674     1.810
C(sentenceCondition)[T.irrelevant]    -0.2914      0.302     -0.966      0.336        -0.888     0.305
C(sentenceCondition)[T.relevant]       0.0913      0.315      0.290      0.772        -0.532     0.714
C(isVotingCondition)[T.y]             -0.4395      0.203     -2.160      0.033        -0.842    -0.037
==============================================================================
Omnibus:                       21.563   Durbin-Watson:                   2.038
Prob(Omnibus):                  0.000   Jarque-Bera (JB):               20.156
Skew:                           0.865   Prob(JB):                     4.20e-05
Kurtosis:                       2.247   Cond. No.                         6.17
==============================================================================

Warnings:
[1] Standard Errors assume that the covariance matrix of the errors is correctly specified.

= = = = = = = = numHelpersSelected ~ C(sentenceCondition) * C(isVotingCondition) = = = = = = = =
                            OLS Regression Results
==============================================================================
Dep. Variable:     numHelpersSelected   R-squared:                       0.061
Model:                            OLS   Adj. R-squared:                  0.025
Method:                 Least Squares   F-statistic:                     1.703
Date:                Sun, 10 May 2015   Prob (F-statistic):              0.138
Time:                        21:35:24   Log-Likelihood:                -213.14
No. Observations:                 136   AIC:                             438.3
Df Residuals:                     130   BIC:                             455.8
Df Model:                           5
Covariance Type:            nonrobust
================================================================================================================================
                                                                   coef    std err          t      P>|t|      [95.0% Conf. Int.]
--------------------------------------------------------------------------------------------------------------------------------
Intercept                                                        1.1111      0.395      2.810      0.006         0.329     1.893
C(sentenceCondition)[T.irrelevant]                              -0.0571      0.441     -0.129      0.897        -0.929     0.815
C(sentenceCondition)[T.relevant]                                 0.1063      0.466      0.228      0.820        -0.817     1.029
C(isVotingCondition)[T.y]                                       -0.2020      0.533     -0.379      0.705        -1.257     0.853
C(sentenceCondition)[T.irrelevant]:C(isVotingCondition)[T.y]    -0.4649      0.606     -0.767      0.445        -1.665     0.735
C(sentenceCondition)[T.relevant]:C(isVotingCondition)[T.y]      -0.0154      0.634     -0.024      0.981        -1.269     1.239
==============================================================================
Omnibus:                       22.084   Durbin-Watson:                   2.085
Prob(Omnibus):                  0.000   Jarque-Bera (JB):               18.989
Skew:                           0.824   Prob(JB):                     7.53e-05
Kurtosis:                       2.201   Cond. No.                         14.8
==============================================================================

Warnings:
[1] Standard Errors assume that the covariance matrix of the errors is correctly specified.

= = = = = = = = comparing ANOVA to interaction ANOVA = = = = = = = =
   df_resid         ssr  df_diff   ss_diff         F    Pr(>F)
0       132  184.700555        0       NaN       NaN       NaN
1       130  182.957754        2  1.742801  0.619171  0.539971
= = = = = = = = anova_lm(numHelpersSelected ~ C(sentenceCondition) * C(isVotingCondition)) = = = = = = = =
                                            df      sum_sq   mean_sq  \
C(sentenceCondition)                         2    3.712010  1.856005
C(isVotingCondition)                         1    6.528612  6.528612
C(sentenceCondition):C(isVotingCondition)    2    1.742801  0.871401
Residual                                   130  182.957754  1.407367

                                                  F    PR(>F)
C(sentenceCondition)                       1.318778  0.271016
C(isVotingCondition)                       4.638882  0.033100
C(sentenceCondition):C(isVotingCondition)  0.619171  0.539971
Residual                                        NaN       NaN
# plotting
fig = plt.figure()
print("")
ax1 = sns.factorplot(x=col_names[1], y=col_names[2], data=factor_groups, kind='point', ci=95)
ax1.set(ylim=(0, 2))
ax2 = sns.factorplot(x=col_names[1], hue=col_names[0], y=col_names[2], data=factor_groups, kind='point', ci=95)
ax2.set(ylim=(0, 2))
#ax2 = interaction_plot(factor_groups[col_names[1]], factor_groups[col_names[0]], factor_groups[col_names[2]], colors=['red', 'blue'], markers=['D', '^'], ms=10, ax=plt.gca())

ax3 = factor_groups.boxplot(return_type='axes', column=col_names[2], by=[col_names[0], col_names[1]])
<matplotlib.figure.Figure at 0x977c668>


Do badge and sentence type interact?
isBadgeCondition X sentenceType --> numHelpersSelected
While not part of our original research questions, it is important to include this last comparison of conditions. With a p-value of 0.399, there does not appear to be any interaction between badge and sentence type on number of helpers selected.
col_names = [utils.COL_BADGE, utils.COL_SENTENCE_TYPE, utils.COL_NUMHELPERS]
factor_groups = data[col_names].dropna()

formula = col_names[2] + " ~ C(" + col_names[0] + ") + C(" + col_names[1] + ")"
formula_interaction = formula.replace('+', '*')

print("= = = = = = = = " + formula + " = = = = = = = =")
lm = ols(formula, data=factor_groups).fit()  # linear model
print(lm.summary())

print("\n= = = = = = = = " + formula_interaction + " = = = = = = = =")
lm_interaction = ols(formula_interaction, data=factor_groups).fit()  # interaction linear model
print(lm_interaction.summary())

# Do an ANOVA check
print("\n= = = = = = = = comparing ANOVA to interaction ANOVA = = = = = = = =")
print(anova_lm(lm, lm_interaction))

print("= = = = = = = = anova_lm(" + formula_interaction + ") = = = = = = = =")
print(anova_lm(lm_interaction))
= = = = = = = = numHelpersSelected ~ C(isBadgeCondition) + C(sentenceCondition) = = = = = = = =
                            OLS Regression Results
==============================================================================
Dep. Variable:     numHelpersSelected   R-squared:                       0.020
Model:                            OLS   Adj. R-squared:                 -0.001
Method:                 Least Squares   F-statistic:                    0.9472
Date:                Sun, 10 May 2015   Prob (F-statistic):              0.420
Time:                        21:35:33   Log-Likelihood:                -225.62
No. Observations:                 143   AIC:                             459.2
Df Residuals:                     139   BIC:                             471.1
Df Model:                           3
Covariance Type:            nonrobust
======================================================================================================
                                         coef    std err          t      P>|t|      [95.0% Conf. Int.]
------------------------------------------------------------------------------------------------------
Intercept                              1.0795      0.284      3.799      0.000         0.518     1.641
C(isBadgeCondition)[T.y]              -0.1590      0.201     -0.793      0.429        -0.556     0.238
C(sentenceCondition)[T.irrelevant]    -0.2895      0.301     -0.962      0.338        -0.885     0.306
C(sentenceCondition)[T.relevant]       0.0345      0.313      0.110      0.912        -0.585     0.654
==============================================================================
Omnibus:                       22.747   Durbin-Watson:                   1.966
Prob(Omnibus):                  0.000   Jarque-Bera (JB):               24.931
Skew:                           0.970   Prob(JB):                     3.86e-06
Kurtosis:                       2.354   Cond. No.                         6.30
==============================================================================

Warnings:
[1] Standard Errors assume that the covariance matrix of the errors is correctly specified.

= = = = = = = = numHelpersSelected ~ C(isBadgeCondition) * C(sentenceCondition) = = = = = = = =
                            OLS Regression Results
==============================================================================
Dep. Variable:     numHelpersSelected   R-squared:                       0.021
Model:                            OLS   Adj. R-squared:                 -0.015
Method:                 Least Squares   F-statistic:                    0.5826
Date:                Sun, 10 May 2015   Prob (F-statistic):              0.713
Time:                        21:35:33   Log-Likelihood:                -225.56
No. Observations:                 143   AIC:                             463.1
Df Residuals:                     137   BIC:                             480.9
Df Model:                           5
Covariance Type:            nonrobust
===============================================================================================================================
                                                                  coef    std err          t      P>|t|      [95.0% Conf. Int.]
-------------------------------------------------------------------------------------------------------------------------------
Intercept                                                       1.0000      0.379      2.642      0.009         0.251     1.749
C(isBadgeCondition)[T.y]                                     6.287e-16      0.535   1.17e-15      1.000        -1.059     1.059
C(sentenceCondition)[T.irrelevant]                             -0.2051      0.424     -0.483      0.630        -1.044     0.634
C(sentenceCondition)[T.relevant]                                0.1429      0.460      0.311      0.757        -0.767     1.052
C(isBadgeCondition)[T.y]:C(sentenceCondition)[T.irrelevant]    -0.1699      0.607     -0.280      0.780        -1.370     1.030
C(isBadgeCondition)[T.y]:C(sentenceCondition)[T.relevant]      -0.2074      0.633     -0.327      0.744        -1.460     1.045
==============================================================================
Omnibus:                       22.698   Durbin-Watson:                   1.966
Prob(Omnibus):                  0.000   Jarque-Bera (JB):               24.886
Skew:                           0.970   Prob(JB):                     3.95e-06
Kurtosis:                       2.355   Cond. No.                         15.0
==============================================================================

Warnings:
[1] Standard Errors assume that the covariance matrix of the errors is correctly specified.

= = = = = = = = comparing ANOVA to interaction ANOVA = = = = = = = =
   df_resid         ssr  df_diff   ss_diff         F    Pr(>F)
0       139  196.459148        0       NaN       NaN       NaN
1       137  196.301371        2  0.157777  0.055057  0.946452
= = = = = = = = anova_lm(numHelpersSelected ~ C(isBadgeCondition) * C(sentenceCondition)) = = = = = = = =
                                           df      sum_sq   mean_sq         F  \
C(isBadgeCondition)                         1    0.517599  0.517599  0.361236
C(sentenceCondition)                        2    3.498778  1.749389  1.220910
C(isBadgeCondition):C(sentenceCondition)    2    0.157777  0.078889  0.055057
Residual                                  137  196.301371  1.432857       NaN

                                            PR(>F)
C(isBadgeCondition)                       0.548814
C(sentenceCondition)                      0.298150
C(isBadgeCondition):C(sentenceCondition)  0.946452
Residual                                       NaN
Discussion
The data used in this python analysis is an uncleaned version of the one described here, and so the results vary slightly. When I redo this analysis with the exact same dataset, but in JMP, I receive identical results. This basically means that the analysis is done properly.
I am in the process of a secondary analysis that looks at the specific information shown next to each helper (i.e., number of badge stars, topic match percentage, number of weeks joined) and how that impacts whether that helper was selected or not. This means the outcome variable is now categorical, and requires performing CHI-square tests which I haven't yet implemented.
Topic Modeling
I used gensim to automatically apply topics to each message board post. Initial analyses have shown no significant effect (p = 0.138) of topic on number of helpers selected, and there's a few possible explanations for that: (1) we don't have the right number of topics to be meaningful, or (2) students don't consider the topic of their question when inviting helpers to their thread.
def one_stats(data_lastDV):
    """
    Do basic analysis of one IV onto one DV
    :param data: pandas dataframe we are exploring (IV-of-interest in first column, followed by IVs, and DV in last index)
    :return: None
    """
    col_names = data_lastDV.columns.values.tolist()  # get the columns' names
    causal = col_names.pop(0)  # first item is the topic
    outcome = col_names.pop()  # remove the last item in the list
    topic_data = data_lastDV[[causal, outcome]]

    # descriptive stats
    print(topic_data[causal].describe())

    fig = plt.figure()
    # bar chart of topics
    ax1 = fig.add_subplot(121)
    df_compare = topic_data.groupby(causal)[causal].count()  # displays num instances assigned to each condition
    ax1 = df_compare.plot(kind='bar', title=causal)
    ax1.set_xlabel(causal)
    ax1.set_ylabel("count instances")
    # scatter plot
    ax2 = fig.add_subplot(122)
    df_compare = data_lastDV.groupby(causal)[outcome].mean()  # displays num helpers selected in each topic
    ax2 = df_compare.plot(kind='bar', title=causal)
    ax2.set_xlabel(causal)
    ax2.set_ylabel("mean " + outcome)
    fig.tight_layout()

    # One Way ANOVA
    cond_lm = ols(outcome + " ~ C(" + causal + ")", data=topic_data).fit()
    anova_table = anova_lm(cond_lm)

    print("\n")
    print("One-Way ANOVA: " + causal + " --> " + outcome)
    print(anova_table)
    #print(cond_lm.model.data.orig_exog)
    print(cond_lm.summary())

    # boxplot of topics --> num helpers selected
    fig = plt.figure()
    ax = fig.add_subplot(111)
    ax = topic_data.boxplot(outcome, causal, ax=plt.gca())
    ax.set_xlabel(causal)
    ax.set_ylabel(outcome)
    fig.tight_layout()
one_stats(data[[utils.COL_TOPIC]+conditions+[outcome]].dropna())
count            134
unique             5
top       assignment
freq              68
Name: topicLDA, dtype: object


One-Way ANOVA: topicLDA --> numHelpersSelected
              df      sum_sq   mean_sq         F    PR(>F)
C(topicLDA)    4    9.583330  2.395832  1.682701  0.157897
Residual     129  183.670401  1.423802       NaN       NaN
                            OLS Regression Results
==============================================================================
Dep. Variable:     numHelpersSelected   R-squared:                       0.050
Model:                            OLS   Adj. R-squared:                  0.020
Method:                 Least Squares   F-statistic:                     1.683
Date:                Sun, 10 May 2015   Prob (F-statistic):              0.158
Time:                        21:35:54   Log-Likelihood:                -211.26
No. Observations:                 134   AIC:                             432.5
Df Residuals:                     129   BIC:                             447.0
Df Model:                           4
Covariance Type:            nonrobust
============================================================================================
                               coef    std err          t      P>|t|      [95.0% Conf. Int.]
--------------------------------------------------------------------------------------------
Intercept                    0.9265      0.145      6.403      0.000         0.640     1.213
C(topicLDA)[T.community]    -0.8154      0.423     -1.926      0.056        -1.653     0.022
C(topicLDA)[T.course]       -0.2122      0.474     -0.448      0.655        -1.149     0.725
C(topicLDA)[T.tools]         0.0441      0.251      0.176      0.861        -0.452     0.540
C(topicLDA)[T.video]         0.4485      0.332      1.353      0.178        -0.207     1.105
==============================================================================
Omnibus:                       25.391   Durbin-Watson:                   2.019
Prob(Omnibus):                  0.000   Jarque-Bera (JB):               18.812
Skew:                           0.803   Prob(JB):                     8.22e-05
Kurtosis:                       2.111   Cond. No.                         5.08
==============================================================================

Warnings:
[1] Standard Errors assume that the covariance matrix of the errors is correctly specified.


Help Requests
I used an extremely naive set of rules to determine if a QuickHelper instance was a help request. , such as identifying if a question mark is included in the message (or the word 'question', or 'struggle' or 'stuck', etc) I identified which entries are most likely help requests and which are not. In the future, a coding scheme should be developed to determine what kinds of help are being sought.
# example code - do not execute
def is_help_topic(sentence):
    if "help" in sentence or "question" in sentence or "?" in sentence or "dunno" in sentence or "n't know" in sentence:
        return True
    if "confus" in sentence or "struggl" in sentence or "lost" in sentence or "stuck" in sentence or "know how" in sentence:
        return True
    return False
We see that our dataset has more help requests than not help requests, which is ideal since students have to click a 'QuickHelper' button to generate an instance in the logfile. We also see that isHelpRequest is a significant predicter of number of helpers selected (p = 0.002). Students who are seeking help invite significantly more helpers to their thread, than those who are not seeking help.
TODO: This analysis should be a t-test, not ANOVA, although it's quite likely that the numbers do not change.
one_stats(data[[utils.COL_HELP_TOPIC]+conditions+[outcome]].dropna())
count     134
unique      2
top         y
freq       89
Name: isHelpRequest, dtype: object


One-Way ANOVA: isHelpRequest --> numHelpersSelected
                   df      sum_sq    mean_sq          F    PR(>F)
C(isHelpRequest)    1   14.255979  14.255979  10.512921  0.001501
Residual          132  178.997753   1.356044        NaN       NaN
                            OLS Regression Results
==============================================================================
Dep. Variable:     numHelpersSelected   R-squared:                       0.074
Model:                            OLS   Adj. R-squared:                  0.067
Method:                 Least Squares   F-statistic:                     10.51
Date:                Sun, 10 May 2015   Prob (F-statistic):            0.00150
Time:                        21:36:01   Log-Likelihood:                -209.54
No. Observations:                 134   AIC:                             423.1
Df Residuals:                     132   BIC:                             428.9
Df Model:                           1
Covariance Type:            nonrobust
=========================================================================================
                            coef    std err          t      P>|t|      [95.0% Conf. Int.]
-----------------------------------------------------------------------------------------
Intercept                 0.4667      0.174      2.688      0.008         0.123     0.810
C(isHelpRequest)[T.y]     0.6906      0.213      3.242      0.002         0.269     1.112
==============================================================================
Omnibus:                       18.090   Durbin-Watson:                   1.957
Prob(Omnibus):                  0.000   Jarque-Bera (JB):               17.037
Skew:                           0.799   Prob(JB):                     0.000200
Kurtosis:                       2.296   Cond. No.                         3.21
==============================================================================

Warnings:
[1] Standard Errors assume that the covariance matrix of the errors is correctly specified.


Conclusion
In conclusion, we see that some of our research hypotheses were supported:
- Does the presence of Help Giver badges increase the number of helpers students invite to their question thread? (isBadgeCondition --> numHelpersSelected) NOT SIGNIFICANT
- Does showing expertise information about potential helpers increase the number of helpers the student invites to her question thread? (sentenceType --> numHelpersSelected) NOT SIGNIFICANT
- Does knowing your selected helpers will be up or downvoting on the quality of the question negatively impact the number of helpers invited to the question thread? (isVotingCondition --> numHelpersSelected) SIGNIFICANT
- Do the badges or expertise sentences lessen the negative effects of the up and down voting? BOTH MARGINALLY SIGNIFICANT
col_names = [utils.COL_BADGE, utils.COL_SENTENCE_TYPE, utils.COL_VOTING, utils.COL_NUMHELPERS]
factor_groups = data[col_names].dropna()
fig = plt.figure()

ax1 = fig.add_subplot(121)
ax1 = interaction_plot(factor_groups[col_names[2]], factor_groups[col_names[0]], factor_groups[col_names[3]], colors=[sns.color_palette()[0], sns.color_palette()[1]], markers=['D', '^'], ms=10, ax=plt.gca())

ax2 = fig.add_subplot(122)
ax2 = interaction_plot(factor_groups[col_names[2]], factor_groups[col_names[1]], factor_groups[col_names[3]], colors=[sns.color_palette()[2], sns.color_palette()[3], sns.color_palette()[4]], markers=['D', '^', 'o'], ms=10, ax=plt.gca())
fig.tight_layout()

Documentation
Find this project in Github: UberHowley/MOOC-File-Processing
This software was used for organizing data from the following experiment:
Howley, I., Tomar, G., Yang, D., Ferschke, O., & Rosé, C. (2015). Alleviating the negative effect of up and downvoting on help seeking in MOOC discussion forums. In Proceedings of 17th International Conference on Artificial Intelligence in Education (AIED 2015).