Adding Annotations to the WWT View
In this notebook we'll demonstrate the different tools that pywwt offers for adding “annotations” — overlays — to the WWT view.
from pywwt.jupyter import WWTJupyterWidget
Then we use this class to create the pywwt "widget". Crucially, the second line (containing just wwt) is needed to insert the widget into the notebook, and not just assign it to a variable.
wwt = WWTJupyterWidget()
wwt
If you're using JupyterLab and not just a plain Jupyter notebook, you can move the WWT view to a separate window pane. This is extremely useful since it lets you keep on typing code without scrolling WWT out of view. Here's how you do that:
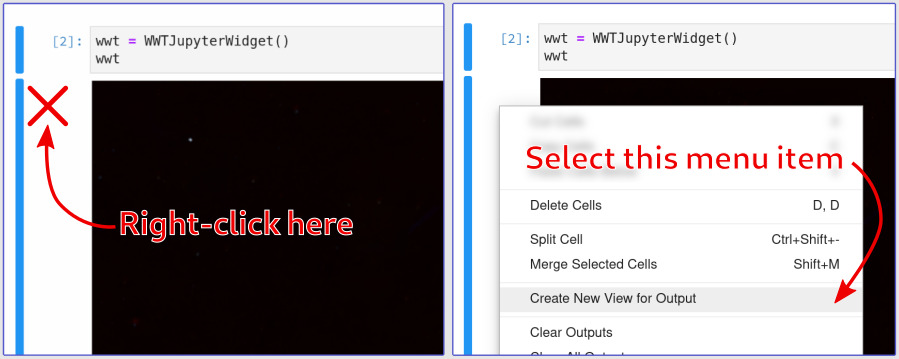
If you don't get a menu when you right-click, or the menu doesn't look like the one pictured, you are using a plain Jupyter notebook and will have to scroll back and forth. See the First Steps notebook for more information and troubleshooting tips if you don’t get a viewer at all.
Step 2: A basic circle annotation
Let's start about as basic as you can get: a circle. pywwt uses Astropy's “units” support for measuring things like circle radii, so let’s import that module, along with another one that will be helpful:
from astropy import units as u
from astropy.coordinates import SkyCoord, concatenate
OK, that’s all we need! By default, new circles will be placed at the center of the current WWT view:
circ = wwt.add_circle(
    radius = 2 * u.degree,
    line_color = '#008ca8',  # HTML hexadecimal color specification
)
We can change the circle's position later, though, using Astropy's standard sky-coordinate class:
c = SkyCoord.from_name('Megrez')
wwt.center_on_coordinates(c, instant=False)
circ.set_center(c)
Or we can just create a circle in a specified position right off the bat:
other_circ = wwt.add_circle(center = c, radius = 3 * u.degree)
With pywwt in general, nearly any setting that you can modify after-the-fact, you can also set directly during the creation of your object.
You can also create filled circles, if that’s your jam:
circ.fill = True
That's about it for circles! Let's get rid of them:
wwt.clear_annotations()
Step 3: Line Annotations
You can also overlay lines. Here we draw out the Big Dipper — note that the concatenate function being used here was imported from the Astropy coordinates module above.
bd = concatenate((
    SkyCoord.from_name('Alkaid'),
    SkyCoord.from_name('Mizar'),
    SkyCoord.from_name('Alioth'),
    SkyCoord.from_name('Megrez'),
    SkyCoord.from_name('Phecda'),
    SkyCoord.from_name('Merak'),
    SkyCoord.from_name('Dubhe'),
))

wwt.center_on_coordinates(SkyCoord.from_name('Megrez'))

line = wwt.add_line(bd)
Let's make the line a little bit easier on the eyes, and complete the circle of the dipper:
line.add_point(SkyCoord.from_name('Megrez'))
line.color = 'salmon'  # HTML "named" colors are also allowed
line.opacity = 0.3
Step 4: Polygons
You can create filled polygons too! Below we have a complex set of commands that will fill in a few parts of the Orion constellation.
One thing you should know: WWT's polygon fills use an even-odd rule that mean that you must specify your polygon points such that they are counterclockwise on the sky (East-from-North position angle increasing). If you create a small polygon with clockwise points, nothing will fill in!
wwt.center_on_coordinates(SkyCoord.from_name('eta orion'), instant=False)

body_coords = concatenate((
    SkyCoord.from_name('delta orion'),
    SkyCoord.from_name('bellatrix'),
    SkyCoord.from_name('betelgeuse'),
    SkyCoord.from_name('zeta orion'),
))

body_poly = wwt.add_polygon(
    body_coords,
    fill = True,
    fill_color = 'lightslategray',
    opacity = 0.4,
    line_color = 'lightslategray',
)
club_coords = concatenate((
    SkyCoord.from_name('67 orionis'),
    SkyCoord.from_name('chi1 orionis'),
    SkyCoord.from_name('chi2 orionis'),
    SkyCoord.from_name('xi orionis'),
))

club_poly = wwt.add_polygon(
    club_coords,
    fill = True,
    fill_color = 'saddlebrown',
    opacity = 0.4,
    line_color = 'saddlebrown',
)
bow_coords = concatenate((
    SkyCoord.from_name('pi5 orionis'),
    SkyCoord.from_name('pi4 orionis'),
    SkyCoord.from_name('pi3 orionis'),
    SkyCoord.from_name('pi2 orionis'),
    SkyCoord.from_name('omicron2 orionis'),
))

bow_poly = wwt.add_polygon(
    bow_coords,
    opacity = 0.4,
    line_color = 'saddlebrown',
)
bow_poly.fill = True
What's Next
WWT’s annotations are handy, but they aren’t meant for heavy-duty data analysis. If you want to plot a lot of points, the NASA Exoplanet Archive tutorial will show you how to load large data tables into WWT with lots of fancy display controls.