Topic 2: Cloud Optimized Data
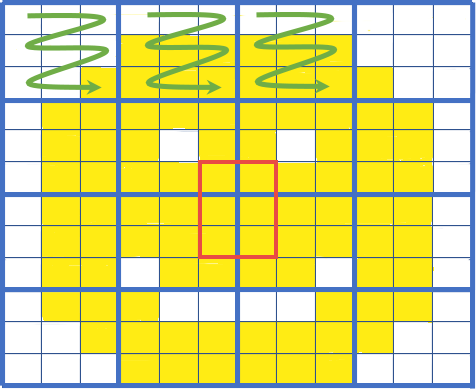
In this example we will access the NASA HLS assets, which are archived in cloud optimized geoTIFF (COG) format in the LP DAAC Cumulus cloud space. The COGs can be used like any other geoTIFF file, but have some added features that make them more efficient within the cloud data access paradigm. These features include: overviews and internal tiling. Below we will demonstrate how to leverage these features.
%matplotlib inline
import matplotlib.pyplot as plt
import os
import requests
import boto3
import rasterio as rio                    # https://rasterio.readthedocs.io/en/latest/
from rasterio.plot import show
from rasterio.session import AWSSession
import rioxarray                          # https://corteva.github.io/rioxarray/stable/index.html
import pandas
import geopandas
import pyproj
from pyproj import Proj
from shapely.ops import transform
import geoviews as gv
from cartopy import crs
import hvplot.xarray
import hvplot.pandas
import holoviews as hv
gv.extension('bokeh', 'matplotlib')
Set GDAL Configuration Options
First, let us set the gdal configuration options for this session
def get_temp_creds():
    temp_creds_url = 'https://data.lpdaac.earthdatacloud.nasa.gov/s3credentials'
    return requests.get(temp_creds_url).json()
temp_creds_req = get_temp_creds()
#temp_creds_req
session = boto3.Session(aws_access_key_id=temp_creds_req['accessKeyId'],
                        aws_secret_access_key=temp_creds_req['secretAccessKey'],
                        aws_session_token=temp_creds_req['sessionToken'],
                        region_name='us-west-2')
rio_env = rio.Env(AWSSession(session),
                  GDAL_DISABLE_READDIR_ON_OPEN='TRUE',
                  CPL_VSIL_CURL_ALLOWED_EXTENSIONS='tif',
                  VSI_CACHE=True,
                  region_name='us-west-2',
                  GDAL_HTTP_COOKIEFILE=os.path.expanduser('~/cookies.txt'),
                  GDAL_HTTP_COOKIEJAR=os.path.expanduser('~/cookies.txt'))
rio_env.__enter__()
Working with Overviews
Access a single HLS asset to identify the overview levels
foa_url = "https://data.lpdaac.earthdatacloud.nasa.gov/lp-prod-protected/HLSS30.020/HLS.S30.T13TGF.2020274T174141.v2.0/HLS.S30.T13TGF.2020274T174141.v2.0.B04.tif"
with rio.open(foa_url) as src:
    hls_ov_levels = src.overviews(1)

hls_ov_levels
Request the second overview level from the asset (overview_level=1)
%%time

with rioxarray.open_rasterio(foa_url, masked=True, overview_level=1, chunks=True) as src:    # https://nbviewer.jupyter.org/gist/rsignell-usgs/f4dd62ad1274c5b5ed69e5a6b81c1295 & http://rasterio.readthedocs.io/en/latest/topics/resampling.html
    print(src)

src.hvplot.image(x='x', y='y', width=800, height=600)
Request the last overview level (overview_level=3)
%%time

with rioxarray.open_rasterio(foa_url, masked=True, overview_level=3, chunks=True) as src:
    print(src)

src.hvplot.image(x = 'x', y = 'y', width=800, height=600)
Requesting Spatial Subsets
Now, we will read in a geojson file and use its bounding box to clip the cloud asset in later steps
os.listdir("../data/")
field = geopandas.read_file('../data/ne_w_agfields.geojson')
type(field)
field
fieldShape = field['geometry'][0]    # Define the geometry as a shapely polygon

fieldShape
Get the lower-left and upper-right coordinates
fieldShape.bounds
Use geoviews to combine a basemap with the shapely polygon of our Region of Interest (ROI)
base = gv.tile_sources.EsriImagery.opts(width=650, height=500)
farmField = gv.Polygons(fieldShape).opts(line_color='yellow', line_width=10, color=None)

base * farmField
Requests an area of interest
Transform coordinates from lat lon (units = dd) to UTM (units = m)
with rio.open(foa_url) as src:
    hls_proj = src.crs.to_string()

hls_proj
geo_CRS = Proj('+proj=longlat +datum=WGS84 +no_defs', preserve_units=True)   # Source coordinate system of the ROI
project = pyproj.Transformer.from_proj(geo_CRS, hls_proj)                    # Set up the transformation
fsUTM = transform(project.transform, fieldShape)                             # Transform
Print the transformed bounds (now in meters)
fsUTM.bounds
Use fsUTM to subset the source HLS tile
Requests data at full extent
%%time

rds = rioxarray.open_rasterio(foa_url, masked=True, chunks=True)
rds
Print the spatial reference attribute
#rds.spatial_ref
rds.spatial_ref.attrs
Plot data at full extent
rds[0].hvplot.image(x = 'x', y = 'y', crs = hls_proj, rasterize=True, cmap='Reds', width=800, height=600, colorbar=True, tiles = 'ESRI')
Request data that intersects with the input geoJSON boundary only
%time

rds_clipped = rioxarray.open_rasterio(foa_url, masked=True).rio.clip([fsUTM])    # Note: fsUTM must be in a list
rds_clipped
rds_clipped[0].hvplot.image(x = 'x', y = 'y', crs = hls_proj, rasterize=True, cmap='Reds', width=800, height=600, colorbar=True, tiles = 'ESRI')
Add the field boudary to the clipped image
rds_clipped[0].hvplot.image(x = 'x', y = 'y', crs = hls_proj, rasterize=True, cmap='Reds', width=800, height=600, colorbar=True, tiles = 'ESRI') * farmField
Get the Geotransformation information for the full tile
rds.spatial_ref.GeoTransform
Geotransformation information for the clipped image
rds_clipped.spatial_ref.GeoTransform
Request data for a point of interest
from pyproj import Transformer

# convert coordinate to raster projection
lon = -101.66786
lat = 41.05679
transformer = Transformer.from_crs("EPSG:4326", rioxarray.open_rasterio(foa_url, masked=True).rio.crs, always_xy=True)
xx, yy = transformer.transform(lon, lat)
print(f'X,Y in source units: {xx},{yy}')
# get value from grid
value = rds.sel(x=xx, y=yy, method="nearest").values
value
Plot the point with the field boundary and the area extraction
point_df = pandas.DataFrame({'x':[xx],
                             'y':[yy],
                             'value':[value[0]]})
image = rds_clipped[0].hvplot.image(x = 'x', y = 'y', crs = hls_proj, rasterize=True, cmap='Reds', width=800, height=600, colorbar=True, tiles = 'ESRI')
point = point_df.hvplot.points('x', 'y', hover_cols='value', crs=hls_proj, color='yellow', size=100)                                                        # https://stackoverflow.com/questions/59678780/show-extra-columns-when-hovering-in-a-scatter-plot-with-hvplot

image * farmField * point