%%HTML
<style>
/* style for presentation only */
.reveal .rendered_html table { font-size: 20px }
/* centre images */
.reveal .rendered_html img {
display: table-cell;
text-align: center;
vertical-align: middle;
horizontal-align: middle;
margin-left: auto;
margin-right: auto;
}
</style>
from IPython.display import Image
import warnings
warnings.filterwarnings("ignore", category=DeprecationWarning)
warnings.filterwarnings("ignore", category=FutureWarning)
from matplotlib import pyplot as plt
plt.rcParams.update({'figure.max_open_warning': 0})
graph_figsize = (10,6) # I'm forgetful and lazy
plt.rcParams.update({'figure.figsize': graph_figsize})
%matplotlib nbagg
# Jupyter Magics!
import geopandas as gp
import urllib.request
import zipfile
from pathlib import Path
import pandas as pd
import numpy as np
import seaborn as sns
import moviepy.editor as mpy
import moviepy.video as mpyv
import plotly.plotly as py
from plotly.offline import download_plotlyjs, init_notebook_mode, plot, iplot
import plotly.graph_objs as go
from datetime import datetime
import cufflinks
init_notebook_mode(connected=False)
pd.Series([0,1,2,3,4,5]).iplot()
Idiots Guide to (Open) Data Science
Andrew Bolster
- bolster.online
- Tweets @bolster
- GitHubs at andrewbolster
- Machine Learning Team Lead at WhiteHatSec
- We're hiring (Placements also available)
- Plays at Farset Labs
- THIS NOTEBOOK IS AT present.bolster.online
- Also available in source at presentgh.bolster.online
What is Data Science?
- "Deriving actionable business and operational insights from multi-modal data sources"
- AKA: "Turning Numbers into Other Numbers, and occasionally pretty graphs"

Data Science in Northern Ireland

Vibrant Corporate Ecosystem
- Analytics Engines
- AquaQ Analytics
- WhiteHat Security😜
- Kainos
- Flexera|BDNA
- First Derivitives
- Neueda
- Sensum
- BrainwaveBank
- Many Many Many More
Open Source / Meetup Ecosystem too
*Hint: If you really want to learn data science, go to/get involved in some of these*
*Hint the Second: These are the best ways to get a job in the field*
Engaged local Government/ComVol support
NI Data Science on the world stage
What is Open Data?
Open data and content can be freely used, modified, and shared by anyone for any purpose - The Open Definition
Open data is the idea that some data should be freely available to everyone to use and republish as they wish, without restrictions from copyright, patents or other mechanisms of control. - Wikipedia
Open data is data that’s available to everyone to access, use and share. Yep, even your nan.- The Open Data Institute
Key Principles of Open Data
- Open
- Accessible
- Available
- Understandable
- Traceable

Open data should be easy to access. Especially for your nan.
Open data is only useful if it’s shared in ways that people can actually understand. It needs to be shared in a standardised format and easily traced back to where it came from.

Open data isn’t the same as big data, but big data can be open data too
When people talk about ‘big data’ they mean a lot of data. Obviously. But ‘big data’, like government statistics on health care, is often closed to the public (or expensive to access, like the terrifyingly-named TWITTER FIREHOSE). Opening up big data lets people use it to spot trends, fill gaps and improve services.

Oh, and it’s also not the same as ‘shared data’
If you’re worried about big companies being fed all your private details, that’s got nothing to do with open data. Groups sharing information with each other is different from opening it up for all to access. Your private data should only be open if you choose to share it. (But if you want to know who’s accessing or sharing your data, open data can help.)

Open data is good for democracy
If citizens know about their governments they can hold leaders to account, make more informed decisions and demand better services. Open data can also help governments stay on their toes and make better policies for society, the economy and the environment.

Open data can help fight crime
It’s helped people in London to track stolen bikes and police in Vancouver to stay one step ahead of criminals.

Open data is good for your health
With tools like FoodTradeMenu using it to help restaurants make sure they don’t serve you food you’re allergic to without realising.


Open data helps you get around your city, and saves you money
Apps like CityMapper use open data from groups like Transport for London to help you find the quickest and cheapest way to get from A to B. Even maps can be open, like OpenStreetMap, which powers map data for websites and humanitarian crises relief around the world.


And how shit is NI? Cus we're shit at everything right?
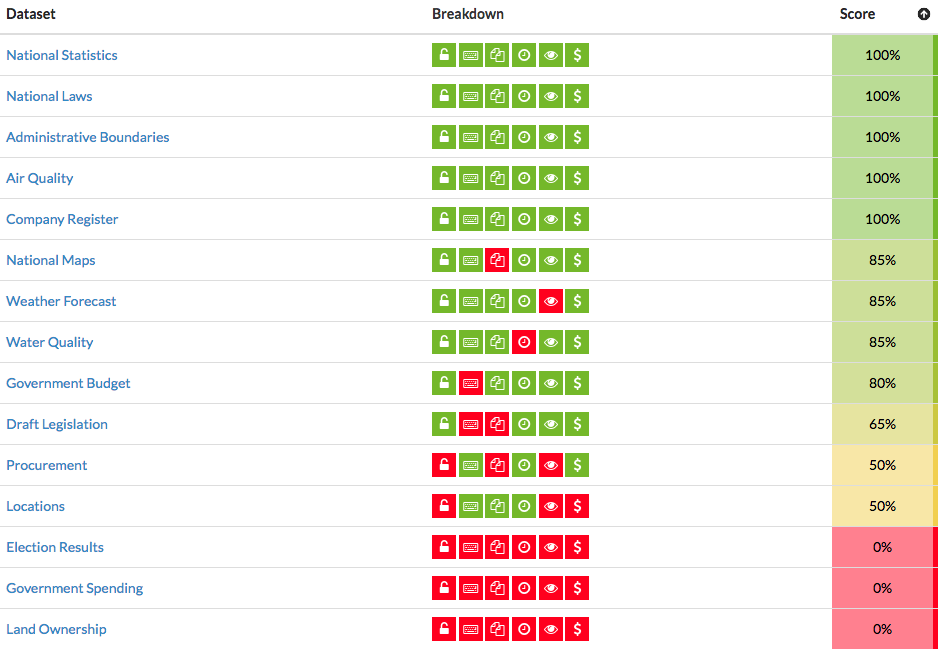
NOTBAD.JPG

What is Data Driven Journalism?
‘Data journalism’ only differs from ‘words journalism’ in that we use a different kit. We all sniff out, report, and relate stories for a living. It’s like ‘photo journalism’; just swap the camera for a laptop. - Brian Boyer, Chicago Tribune
[...] providing information and analysis to help inform us all about important issues of the day. - Aron Pilhofer, New York Times
Using Open Data and Data Science principles to ask, analyse and answer complex or contentious questions or areas of inquiry using available evidence. - Bolster, Here
What do you what to know?
This is usually the wrong question;
What do you want to know more about?

What relevant data is available?


So what do we think we have at the moment?
- List of schools with at least council/constitutency locations and postcodes
- Enrolements per school for 2016/17
- Demographic comparisons (R/FSM/SEN 0+ or 5)
- A 'churn' rate (newcomers/movers/immigration)
What else could we do with?
- More years, ideally same format
- What schools have fewer places per/k council pop?
- Correlations to deprivation
- Correlations to monoculture/political alignment
- Correlations to population change
- Correlations to achievement/mobility
- Correlations to claiment count etc.
I think we can get most of these... but first things first
Extraction, Transformation and Loading
- Get the data
- Clean the data
- Store the data
Gov Open Data is notoriously difficult to 'wander around'
Extraction
When in doubt, bring in pandas

Easy mode: read_csv
import pandas as pd
url_from_odni = "https://www.opendatani.gov.uk/dataset/6058be29-b2e1-4253-bab8-8a018568560a/resource/b4fcfed1-2dc1-4f61-8968-573535522d53/download/school-level-post-primary-reference-data.csv"
pd.read_csv(url_from_odni)
| De ref | school name | address 1 | town | postcode | school type | management type | constituency | council | rural | |
|---|---|---|---|---|---|---|---|---|---|---|
| 0 | 1210014 | Ashfield Girls' High School | 397 HOLYWOOD ROAD | BELFAST | BT42LY | Secondary | Controlled | BELFAST EAST | BELFAST | Urban |
| 1 | 1210015 | Ashfield Boys' High School | 395 HOLYWOOD ROAD | BELFAST | BT42LY | Secondary | Controlled | BELFAST EAST | BELFAST | Urban |
| 2 | 1210021 | Belfast Model School For Girls | 35 DUNOWEN GARDENS | BELFAST | BT146NQ | Secondary | Controlled | BELFAST NORTH | BELFAST | Urban |
| 3 | 1210022 | Belfast Boys' Model School | BALLYSILLAN ROAD | BELFAST | BT146RB | Secondary | Controlled | BELFAST NORTH | BELFAST | Urban |
| 4 | 1230026 | St Patrick's College, Belfast | 619-629 ANTRIM ROAD | BELFAST | BT154DZ | Secondary | Catholic Maintained | BELFAST NORTH | BELFAST | Urban |
| 5 | 1230053 | St Louise's Comprehensive College | 468 FALLS ROAD | BELFAST | BT126EN | Secondary | Catholic Maintained | BELFAST WEST | BELFAST | Urban |
| 6 | 1230089 | Little Flower Girls' School | 71A SOMERTON ROAD | BELFAST | BT154DE | Secondary | Catholic Maintained | BELFAST NORTH | BELFAST | Urban |
| 7 | 1230104 | Mercy College | BALLYSILLAN ROAD | BELFAST | BT147QR | Secondary | Catholic Maintained | BELFAST NORTH | BELFAST | Urban |
| 8 | 1230130 | St Rose?s Dominican College | 65 BEECHMOUNT AVENUE | BELFAST | BT127NA | Secondary | Catholic Maintained | BELFAST WEST | BELFAST | Urban |
| 9 | 1230146 | Christian Brothers School, Belfast | GLEN ROAD | BELFAST | BT118BW | Secondary | Catholic Maintained | BELFAST WEST | BELFAST | Urban |
| 10 | 1230155 | St Genevieve's High School | TRENCH HOUSE | BELFAST | BT119JP | Secondary | Catholic Maintained | BELFAST WEST | BELFAST | Urban |
| 11 | 1230182 | De La Salle College | 36 EDENMORE DRIVE | BELFAST | BT118LT | Secondary | Catholic Maintained | BELFAST WEST | BELFAST | Urban |
| 12 | 1230262 | Corpus Christi College | ARD NA VA ROAD | BELFAST | BT126FF | Secondary | Catholic Maintained | BELFAST WEST | BELFAST | Urban |
| 13 | 1230275 | St Joseph's College, Belfast | 518-572 RAVENHILL ROAD | BELFAST | BT60BY | Secondary | Catholic Maintained | BELFAST SOUTH | BELFAST | Urban |
| 14 | 1240291 | Colaiste Feirste | 7 BEECHVIEW PARK | BELFAST | BT127PY | Secondary | Other Maintained | BELFAST WEST | BELFAST | Urban |
| 15 | 1260269 | Hazelwood College | 70 WHITEWELL ROAD | NEWTOWNABBEY | BT367ES | Secondary | GMI | BELFAST NORTH | BELFAST | Urban |
| 16 | 1260294 | Malone Integrated College | 45 FINAGHY ROAD NORTH | BELFAST | BT100JB | Secondary | GMI | BELFAST SOUTH | BELFAST | Urban |
| 17 | 1410079 | Grosvenor Grammar School | 50 MARINA PARK | BELFAST | BT56BA | Grammar | Controlled | BELFAST EAST | BELFAST | Urban |
| 18 | 1410270 | Wellington College | 18 CAROLAN ROAD | BELFAST | BT73HE | Grammar | Controlled | BELFAST SOUTH | BELFAST | Urban |
| 19 | 1410315 | Bloomfield Collegiate | 8 ASTORIA GARDENS | BELFAST | BT56HW | Grammar | Controlled | BELFAST EAST | BELFAST | Urban |
| 20 | 1420020 | Campbell College | BELMONT ROAD | BELFAST | BT42ND | Grammar | Voluntary | BELFAST EAST | BELFAST | Urban |
| 21 | 1420021 | St Mary's Christian Brothers' Grammar, Belfast | 147A GLEN ROAD | BELFAST | BT118NR | Grammar | Voluntary | BELFAST WEST | BELFAST | Urban |
| 22 | 1420022 | Methodist College | 1 MALONE ROAD | BELFAST | BT96BY | Grammar | Voluntary | BELFAST SOUTH | BELFAST | Urban |
| 23 | 1420027 | The Royal Belfast Academical Institution | COLLEGE SQUARE EAST | BELFAST | BT16DL | Grammar | Voluntary | BELFAST SOUTH | BELFAST | Urban |
| 24 | 1420028 | Belfast Royal Academy | 5-17 CLIFTONVILLE ROAD | BELFAST | BT146JL | Grammar | Voluntary | BELFAST NORTH | BELFAST | Urban |
| 25 | 1420029 | St Dominic's High School, Belfast | 135-137 FALLS ROAD | BELFAST | BT126AE | Grammar | Voluntary | BELFAST WEST | BELFAST | Urban |
| 26 | 1420030 | St Malachy's College, Belfast | 36 ANTRIM ROAD | BELFAST | BT152AE | Grammar | Voluntary | BELFAST NORTH | BELFAST | Urban |
| 27 | 1420082 | Dominican College, Belfast | 38 FORTWILLIAM PARK | BELFAST | BT154AQ | Grammar | Voluntary | BELFAST NORTH | BELFAST | Urban |
| 28 | 1420089 | Strathearn School, Belfast | 188 BELMONT ROAD | BELFAST | BT42AU | Grammar | Voluntary | BELFAST EAST | BELFAST | Urban |
| 29 | 1420095 | Rathmore Grammar School | KINGSWAY | BELFAST | BT100LF | Grammar | Voluntary | BELFAST SOUTH | BELFAST | Urban |
| ... | ... | ... | ... | ... | ... | ... | ... | ... | ... | ... |
| 171 | 5230076 | St Patrick's College, Banbridge | 38 SCARVA ROAD | BANBRIDGE | BT323AS | Secondary | Catholic Maintained | UPPER BANN | ARMAGH CITY, BANBRIDGE AND CRAIGAVON | Urban |
| 172 | 5230108 | St Mary's High School, Newry | UPPER CHAPEL STREET | NEWRY | BT342DT | Secondary | Catholic Maintained | NEWRY AND ARMAGH | NEWRY MOURNE AND DOWN | Urban |
| 173 | 5230135 | St Mark's High School | UPPER DROMORE ROAD | NEWRY | BT343PN | Secondary | Catholic Maintained | SOUTH DOWN | NEWRY MOURNE AND DOWN | Urban |
| 174 | 5230152 | St Ciaran's High School | 15 TULLYBRYAN ROAD | DUNGANNON | BT702LY | Secondary | Catholic Maintained | FERMANAGH AND SOUTH TYRONE | MID ULSTER | Rural |
| 175 | 5230157 | St Paul's High School, Bessbrook | 108 CAMLOUGH ROAD | NEWRY | BT357EE | Secondary | Catholic Maintained | NEWRY AND ARMAGH | NEWRY MOURNE AND DOWN | Rural |
| 176 | 5230167 | St Joseph's High School, Crossmaglen | 77 DUNDALK ROAD | NEWRY | BT359HL | Secondary | Catholic Maintained | NEWRY AND ARMAGH | NEWRY MOURNE AND DOWN | Rural |
| 177 | 5230187 | St Patrick's High School, Keady | MIDDLETOWN ROAD | KEADY | BT603TH | Secondary | Catholic Maintained | NEWRY AND ARMAGH | ARMAGH CITY, BANBRIDGE AND CRAIGAVON | Rural |
| 178 | 5230192 | St Joseph's College, Coalisland | 29 SCHOOL LANE | DUNGANNON | BT714NW | Secondary | Catholic Maintained | MID ULSTER | MID ULSTER | Urban |
| 179 | 5230213 | Lismore Comprehensive School | DRUMGASK | CRAIGAVON | BT655DU | Secondary | Catholic Maintained | UPPER BANN | ARMAGH CITY, BANBRIDGE AND CRAIGAVON | Urban |
| 180 | 5230218 | St Catherine's College | 2A CONVENT ROAD | ARMAGH | BT604BG | Secondary | Catholic Maintained | NEWRY AND ARMAGH | ARMAGH CITY, BANBRIDGE AND CRAIGAVON | Urban |
| 181 | 5230256 | Drumcree College | 4 MOY ROAD | PORTADOWN | BT621QL | Secondary | Catholic Maintained | UPPER BANN | ARMAGH CITY, BANBRIDGE AND CRAIGAVON | Urban |
| 182 | 5230278 | Holy Trinity College | CHAPEL STREET | COOKSTOWN | BT808QB | Secondary | Catholic Maintained | MID ULSTER | MID ULSTER | Urban |
| 183 | 5230293 | St Patrick's College, Dungannon | 41 KILLYMEAL ROAD | DUNGANNON | BT716LJ | Secondary | Catholic Maintained | FERMANAGH AND SOUTH TYRONE | MID ULSTER | Urban |
| 184 | 5250216 | Brownlow Int College | TULLYGALLY ROAD | CRAIGAVON | BT655BS | Secondary | Controlled Integrated | UPPER BANN | ARMAGH CITY, BANBRIDGE AND CRAIGAVON | Urban |
| 185 | 5260285 | New-Bridge Integrated College | 25 DONARD VIEW ROAD | BANBRIDGE | BT323LN | Secondary | GMI | UPPER BANN | ARMAGH CITY, BANBRIDGE AND CRAIGAVON | Rural |
| 186 | 5260286 | Integrated College Dungannon | 21 GORTMERRON LINK ROAD | DUNGANNON | BT716LS | Secondary | GMI | FERMANAGH AND SOUTH TYRONE | MID ULSTER | Urban |
| 187 | 5410013 | Banbridge Academy | LURGAN ROAD | BANBRIDGE | BT324AQ | Grammar | Controlled | UPPER BANN | ARMAGH CITY, BANBRIDGE AND CRAIGAVON | Urban |
| 188 | 5410057 | Lurgan College | 9 COLLEGE WALK | CRAIGAVON | BT666JW | Grammar | Controlled | UPPER BANN | ARMAGH CITY, BANBRIDGE AND CRAIGAVON | Urban |
| 189 | 5410067 | Portadown College | 4 KILLYCOMAINE ROAD | CRAIGAVON | BT635BU | Grammar | Controlled | UPPER BANN | ARMAGH CITY, BANBRIDGE AND CRAIGAVON | Urban |
| 190 | 5420045 | St Louis Grammar School, Kilkeel | 151 NEWRY ROAD | KILKEEL | BT344EU | Grammar | Voluntary | SOUTH DOWN | NEWRY MOURNE AND DOWN | Urban |
| 191 | 5420059 | Abbey Christian Brothers Grammar School | 77A ASHGROVE ROAD | NEWRY | BT342QN | Grammar | Voluntary | SOUTH DOWN | NEWRY MOURNE AND DOWN | Urban |
| 192 | 5420060 | Our Lady's Grammar School | CHEQUER HILL | NEWRY | BT356DY | Grammar | Voluntary | NEWRY AND ARMAGH | NEWRY MOURNE AND DOWN | Urban |
| 193 | 5420062 | St Colman's College, Newry | 46 ARMAGH ROAD | NEWRY | BT356PP | Grammar | Voluntary | NEWRY AND ARMAGH | NEWRY MOURNE AND DOWN | Urban |
| 194 | 5420073 | St Joseph's Convent Grammar School, Donaghmore | 58 CASTLECAULFIELD ROAD | DUNGANNON | BT703HE | Grammar | Voluntary | MID ULSTER | MID ULSTER | Rural |
| 195 | 5420076 | Sacred Heart Grammar School, Newry | 10 ASHGROVE AVENUE | NEWRY | BT341PR | Grammar | Voluntary | SOUTH DOWN | NEWRY MOURNE AND DOWN | Urban |
| 196 | 5420260 | The Royal School, Dungannon | 2 RANFURLEY ROAD | DUNGANNON | BT716AP | Grammar | Voluntary | FERMANAGH AND SOUTH TYRONE | MID ULSTER | Urban |
| 197 | 5420263 | The Royal School, Armagh | COLLEGE HILL | ARMAGH | BT619DH | Grammar | Voluntary | NEWRY AND ARMAGH | ARMAGH CITY, BANBRIDGE AND CRAIGAVON | Urban |
| 198 | 5420268 | St Patrick's Grammar School, Armagh | CATHEDRAL ROAD | ARMAGH | BT617QZ | Grammar | Voluntary | NEWRY AND ARMAGH | ARMAGH CITY, BANBRIDGE AND CRAIGAVON | Urban |
| 199 | 5420304 | St Patrick's Academy, Dungannon | 37 KILLYMEAL ROAD | DUNGANNON | BT716DS | Grammar | Voluntary | FERMANAGH AND SOUTH TYRONE | MID ULSTER | Urban |
| 200 | 5420314 | St Ronan?s College | 12 CORNAKINEGAR ROAD | LURGAN | BT679JW | Grammar | Voluntary | UPPER BANN | ARMAGH CITY, BANBRIDGE AND CRAIGAVON | Urban |
201 rows × 10 columns
Hardmode: API's
from ckanapi import RemoteCKAN # it's on pip
def build_odni_connection():
"""Be nice to OpenDataNI and tell them how old I am. (And that it's me)"""
version_no = (pd.to_datetime('now') -
pd.to_datetime('1988/05/17')).days/365
ua = f'@Bolster/{version_no:.2f} (+http://bolster.online/)'
return RemoteCKAN('https://www.opendatani.gov.uk/', user_agent=ua)
odni = build_odni_connection()
odni.action.package_list()
['2011-census-microdata-sample-of-anonymised-records-teaching-file', '2018-based-population-projections-for-northern-ireland', 'a26-dualling-lidar', 'a6-lidar', 'active-places-ni-sports-facilities-database', 'activity-centre-ccgbc', 'adult-bmi-health-survey-northern-ireland', 'adult-magistrates-defendants-dealt-with', 'advice-centres', 'air-quality-monitoring-stations', 'analysis-of-the-trees-of-belfast', 'anbc-car-parking', 'anbc-local-nature-reserves', 'annual-survey-of-hours-and-earnings', 'anti-social-behaviour-incidents-recorded-by-the-police-in-northern-ireland', 'antrim-and-newtownabbey-borough-council-assets', 'antrim-and-newtownabbey-borough-council-bring-bank-locations', 'antrim-newtownabbey-borough-council-assets', 'applications-by-position-applied-for-2015-16', 'applications-by-type-town-and-country', 'approved-venues-for-civil-ceremonies-in-causeway-coast-and-glens-borough-council-2016', 'ards-and-north-down-borough-council-car-parks', 'ards-and-north-down-councillors', 'areas-of-archaeological-potential', 'areas-of-outstanding-natural-beauty', 'areas-of-significant-archaeological-interest', 'areas-of-special-scientific-interest', 'armagh-city-banbridge-craigavon-borough-councillors', 'attendance-allowance-recipients-statistical-geography', 'authorised-waste-sites-treatment-storage', 'average-2015-prescription-costs-for-gp-practices-in-northern-ireland', 'bathymetric-lidar-for-red-bay', 'bathymetric-lidar-for-small-area-of-strangford-lough', 'bcni2018', 'beaches-ccgbc', 'belfast-bicycle-network', 'belfast-bike-hire-rentals-and-returns', 'belfast-bike-hire-rentals-returns', 'belfast-city-council-councillors', 'belfast-council-car-parks', 'belfast-cycle-map', 'belfast-trees', 'belfast-young-people-who-think-that-local-facilities-are-shared-and-open-to-all', 'bike-hire-stations', 'border-crossings-2018', 'botanic-gardens-3d-tree-model', 'bottle-banks', 'boundary-commision-for-northern-ireland-final-recommendations', 'boundary-commission-for-northern-ireland-revised-proposals', 'boundary-review', 'bowling-pavilions', 'breastfeeding-welcome-here-certificate-holders', 'bring-sites-ccgbc', 'cancer-waiting-times', 'caravan-and-camping-sites-in-causeway-coast-and-glens-borough-council', 'caravan-sites-within-the-borough', 'carers-allowance-recipients-statistical-geography', 'causewaycoastandglensbc', 'causeway-coast-and-glens-borough-councillors', 'causeway-coast-and-glens-borough-council-offices', 'causeway-coast-and-glens-borough-council-off-street-car-parks', 'cemeteries', 'cemeteries-and-old-graveyards-in-causeway-coast-and-glens-borough-council', 'city-parks', 'civic-amenity-sites', 'client-group-analysis-claimants-statisical-geographies', 'clinical-social-care-negligence-cases', 'coastal-flood-boundary-extreme-sea-levels-2018-ni-extract-irish-grid-projection', 'community-centres', 'community-centres-in-causeway-coast-and-glens-borough-council', 'compensation-claims-by-compensator-and-type', 'compensation-recovery-scheme-benefit-and-health-service-recoveries', 'complaints-and-mp-mla-correspondence-received-by-land-property-services', 'conservation-areas-in-causeway-coast-and-glens-borough-council', 'construction-procurement-pipeline-fo-rni', 'contracts-awarded-by-central-procurement-directorate-in-the-2016-2017-year', 'council-properties', 'crown-court-defendants-dealt-with', 'cycle-ni-routes-in-causeway-coast-and-glens-borough-council-area', 'datasets-financial-abuse-of-older-people', 'defence-heritage', 'department-of-education-northern-ireland-information-asset-register', 'department-of-health-trust-boundaries', 'derry-and-strabane-borough-councillors', 'derry-city-and-strabane-district-council-off-street-car-parks-locations', 'diagnostic-waiting-times', 'disability-living-allowance-recipients-statistical-geographies', 'disabled-persons-allowance-statistics', 'disease-prevalence', 'disease-prevalence-in-northern-ireland', 'dispensing-by-contractor', 'dof-information-asset-register', 'dof-senior-civil-servants-gifts-hospitality', 'domestic-abuse-incidents-and-crimes-recorded-by-the-police-in-northern-ireland', 'draft-programme-for-government-framework-2016-21', 'drainage-asset', 'driver-testing-outcomes-by-test-centre', 'e-car-charge-points-in-causeway-coast-and-glens-borough-council', 'emergency-care-waiting-times', 'emergency-care-waiting-times1', 'enrolments-by-school-management-type', 'environmental-noise-directive-noise-mapping', 'essential-skills-activity', 'essential-skills-activity-2002-20014-15', 'essential-skills-activity-2002-2015-16', 'essential-skills-enrolments-administrative-geographies', 'estimates-of-the-population-aged-85-and-over-northern-ireland', 'eu-referendum-23-june-2016', 'european-parliament-election-22-may-2014-ni-region', 'events', 'examination-performance-at-post-primary-schools-in-northern-ireland-2016-17', 'examination-performance-at-post-primary-schools-in-northern-ireland-2017-18', 'family-fun-in-causeway-coast-and-glens-borough-council', 'farm-census-administrative-geographies', 'fermanagh-and-omagh-district-council-bowling-pavilions', 'fermanagh-and-omagh-district-council-car-parks', 'fermanagh-and-omagh-district-council-leisure-centres', 'fermanagh-and-omagh-district-councillors', 'filtering-offence-list', 'find-your-nearest-bus-stops', 'find-your-public-amenities-in-northern-ireland', 'fly-tipping', 'fodc-community-centres', 'fodc-defibrillator-locations', 'fodc-members-allowances-2017-2018', 'fodc-recycling-centres', 'fodc-road-signage', 'fodc-tree-preservation-orders', 'food-premise-hygiene-ratings', 'former-nuts-iii-areas', 'full-list-of-first-forenames-given-to-babies-registered-in-northern-ireland', 'further-education-achievements-administrative-geographies', 'further-education-activity', 'further-education-regulated-enrolments-administrative-geographies', 'gp-practice-list-sizes', 'gp-prescribing-data', 'gp-prescription-spending-by-british-national-formulary-bnf-chapter-and-drug-april-2013-may-2016', 'greater-beflast-area-park-and-ride-sites', 'gross-hourly-pay-annual-survey-of-hours-and-earnings', 'gross-weekly-pay-annual-survey-of-hours-and-earnings', 'gsni-250k-geology', 'gsni-tellus-regional-airborne-geophysical-survey-electromagnetic-grids', 'gsni-tellus-regional-airborne-geophysical-survey-electromagnetics', 'gsni-tellus-regional-airborne-geophysical-survey-magnetic-grids', 'gsni-tellus-regional-airborne-geophysical-survey-magnetics', 'gsni-tellus-regional-airborne-geophysical-survey-radiometric-grids', 'gsni-tellus-regional-airborne-geophysical-survey-radiometrics', 'gsni-tellus-regional-stream-sediments', 'gsni-tellus-regional-stream-waters-icp', 'hea', 'health', 'health-trust-community-services-and-reference-costs', 'health-trust-community-services-indicators-and-reference-costs-2015-16', 'health-trust-community-services-indicators-and-reference-costs-2016-17', 'health-trust-community-services-indicators-and-reference-costs-2017-18', 'health-trust-reference-costs-2015-16', 'health-trust-reference-costs-2016-17', 'health-trust-reference-costs-2017-18', 'health-trust-specialist-services-reference-costs-2015-16', 'health-trust-specialist-services-reference-costs-2016-17', 'health-trust-specialist-services-reference-costs-2017-18', 'higher-education-enrolments-administrative-geographies', 'higher-education-qualifications-administrative-geographies', 'highway-network', 'historic-environment-division-lidar', 'historic-environment-division-lidar-2008', 'historic-environment-division-lidar-2009', 'historic-environment-division-lidar-2013', 'historic-environment-division-lidar-2014', 'historic-parks-and-gardens', 'household-projections-for-northern-ireland-2016-based', 'http-https-www-daera-ni-gov-uk-topics-marine', 'https-www-daera-ni-gov-uk-sites-default-files-publications-doe-lakewaterbodygml-zip', 'https-www-daera-ni-gov-uk-sites-default-files-publications-doe-riversegmentgml-zip', 'https-www-nisra-gov-uk-statistics-deprivation', 'http-www-hscbusiness-hscni-net-services-2070-htm', 'incidents-and-crimes-with-a-hate-motivation-recorded-by-the-police-in-northern-ireland', 'income-support-recipients-stat-geog', 'industrial-heritage-record', 'information-requests-lps-2016-2017', 'information-requests-lps-2017-2018', 'information-requests-lps-2018-2019', 'inpatient-waiting-times', 'irc241559-staff-officer-so-external-recruitment-campaign-section-75-data', 'irc241560-deputy-principal-dp-external-recruitment-campaign-data', 'jobs', 'job-seekers-allowance-claimants-statistical-geographies', 'landscape-character-areas', 'leisure-centre-ccgbc', 'leisure-centres', 'libraries-ni-annual-loans-summary', 'library-locations-ni', 'licensed-bus-vehicles', 'licensed-taxi-drivers-by-postal-district', 'licensed-taxi-vehicles', 'lidar-belfast-city-2006', 'lidar-lough-neagh-environs-2017', 'lighting-assets', 'lisburn-and-castlereagh-city-council', 'lisburn-carpark-data', 'listed-buildings-northern-ireland', 'locate-a-school', 'lone-pensioner-allowance-statistics', 'lps-arcgis', 'lps-call-handling-stats', 'marinas-harbours-and-slipways-in-causeway-coast-and-glens-borough-council', 'materials-collected-at-northern-ireland-local-authority-waste-management-sites-time-series-data', 'members-allowances', 'metro-timetable-data-valid-from-18-june-until-31-august-2016', 'mid-and-east-antrim-borough-councillors', 'mid-and-east-antrim-borough-council-off-street-car-parks', 'mid-ulster-council-caravan-amp-camping-sites', 'mid-ulster-council-district-electoral-areas', 'mid-ulster-council-leisure-and-rec-centres', 'mid-ulster-council-licensed-petroleum-sites', 'mid-ulster-council-off-street-car-parks', 'mid-ulster-council-old-burial-grounds', 'mid-ulster-council-parks-services-facilities', 'mid-ulster-council-properties', 'mid-ulster-council-public-toilets', 'mid-ulster-council-tourism-locations', 'mid-ulster-council-townlands', 'mid-ulster-council-wards', 'mid-ulster-district-council', 'mid-ulster-district-council-echarging-points', 'mid-ulster-district-councillors', 'mid-ulster-district-schools', 'mudc-aed-locations', 'my-train-for-amazon-echo', 'national-nature-reserves', 'new_lps_environ_test', 'new_lps_test', 'newry-city-core-photogrammetry-survey-point-cloud-scan', 'newry-mourne-and-down-district-councillors', 'nia-constituencies', 'ni-air-quality', 'nia-members', 'nia-questions', 'nia-register', 'ni-assembly-election-5-may-2016', 'ni-coastal-erosion-high-level-risk-appraisal', 'ni-coastal-vulnerability-assessment-historic-assets', 'ni-coastal-vulnerability-assessment-natural-assets', 'ni-coastal-vulnerability-assessment-physical-assets', 'nics-permanent-secretary-business-expenses-april-2019-june-2019', 'nics-permanent-secretary-expenses-april-2018-march-2019', 'nics-permanent-secretary-expenses-july-to-september-2019', 'nics-permanent-secretary-gifts-and-hospitality-register-april-to-june-2019', 'nics-permanent-secretary-gifts-and-hospitality-register-jul-sept-2019', 'ni-cycle-counters-raw-data-2011-2016', 'ni-direct-website-data', 'niea-authorised-landfill-sites', 'ni-gp-prescribing-data-november-december-2015', 'ni-herd-flock-map-references', 'ni-housing-stock', 'nihpi-by-propertytype', 'nihpi-mean-median-standardisded-price', 'nihpi-verified-sales-by-propertytype', 'nir20160126v2', 'nisra-open-data-boundaries-output-areas-2001', 'nisra-open-data-boundaries-small-areas-2011', 'nisra-open-data-boundaries-super-output-areas-2011', 'ni-water-customer-tap-authorised-supply-point-results', 'ni-water-s-2017-air-to-niaur-regulatory-accounts-movement-on-current-cost-reserve', 'ni-water-s-air-submission-to-niaur-regarding-customer-service', 'ni-water-s-air-submission-to-niaur-regarding-opa-input-data-overall-performance-assessment', 'ni-water-s-air-to-niaur-analysis-of-fixed-asset-additions-and-asset-maintenance-historic-cost', 'ni-water-s-air-to-niaur-analysis-of-non-infrastructure-fixed-asset-additions-by-life-categories', 'ni-water-s-air-to-niaur-financial-measures-capital-investment-gross-capital-investment-variance', 'ni-water-s-air-to-niaur-financial-measures-depreciation-charge-by-asset', 'ni-water-s-air-to-niaur-financial-measures-gross-capital-investment', 'ni-water-s-air-to-niaur-financial-measures-investment-additional-opex-from-capex', 'ni-water-s-air-to-niaur-financial-measures-investment-capital-grants-and-contributions', 'ni-water-s-air-to-niaur-financial-measures-public-expenditure-reconciliation', 'ni-water-s-air-to-niaur-historical-cost-statement-of-total-recognised-gains-and-losses', 'ni-water-s-air-to-niaur-key-outputs-energy-consumption-and-greenhouse-gas-accounting', 'ni-water-s-air-to-niaur-non-financial-measures-sewerage-properties-population', 'ni-water-s-air-to-niaur-non-financial-measures-sewerage-service-activities', 'ni-water-s-air-to-niaur-profit-and-loss-for-year-ending-31-march', 'ni-water-s-air-to-niaur-regarding-analysis-of-turnover-and-operating-income', 'ni-water-s-air-to-niaur-regarding-historical-cost-analysis-of-dividends-and-interest-charges', 'ni-water-s-air-to-niaur-regarding-key-outputs-health-safety-information', 'ni-water-s-air-to-niaur-regarding-nominated-outputs-pc15-capital-projects', 'ni-water-s-air-to-niaur-regarding-non-financial-measures-sewage-collected', 'ni-water-s-air-to-niaur-regarding-non-financial-measures-sewage-treatment', 'ni-water-s-air-to-niaur-regarding-non-financial-measures-water-explanatory-factors', 'ni-water-s-air-to-niaur-regarding-non-financial-measures-water-service-activities', 'ni-water-s-air-to-niaur-regulatory-accounts-activity-analysis-sewerage-service', 'ni-water-s-air-to-niaur-regulatory-accounts-activity-costing-analysis-water-service', 'ni-water-s-air-to-niaur-regulatory-accounts-cash-flow-for-year-ending-31-march', 'ni-water-s-air-to-niaur-regulatory-accounts-historical-cost-balance-sheet-as-at-31-march', 'ni-water-s-air-to-niaur-regulatory-accounts-historic-cost-analysis-of-fixed-assets-by-asset-type', 'ni-water-s-air-to-niaur-regulatory-accounts-reconciliation-of-operating-profit-to-net-cash-flow', 'ni-water-s-air-to-niaur-security-of-supply-index-planned-level-of-service', 'ni-water-s-air-to-niaur-serviceability-serviceability-return', 'ni-water-s-air-to-niaur-sewerage-explanatory-factors-sewage-treatment-numbers', 'ni-water-s-air-to-niaur-sewerage-explanatory-factors-sewage-treatment-works', 'ni-water-s-air-to-niaur-sewerage-explanatory-factors-sewage-treatment-works-costs', 'ni-water-s-air-to-niaur-sewerage-explanatory-factors-sewerage-sub-area-explanatory-factors', 'ni-water-s-air-to-niaur-sewerage-explanatory-factors-sludge-and-disposal-information', 'ni-water-s-annual-information-return-submission-to-niaur-regarding-complaints-data-for-ccni', 'ni-water-s-annual-information-return-submission-to-niaur-regarding-external-sewerage-flooding', 'ni-water-s-annual-information-return-submission-to-niaur-regarding-internal-sewerage-flooding', 'ni-water-s-annual-information-return-submission-to-niaur-regarding-sewerage-service', 'ni-water-s-annual-information-return-submission-to-niaur-regarding-water-delivered', 'ni-water-s-annual-information-return-submission-to-niaur-regarding-water-metering', 'ni-water-s-annual-information-return-submission-to-niaur-regarding-water-quality', 'ni-water-s-annual-information-return-submission-to-niaur-regarding-water-service-outputs', 'niws-air-niaur-submission-re-outstanding-revenue-and-customer-services-operating-expenditure', 'niws-air-regarding-complaints-metered-customers-telephone-contacts-and-special-assistance-register', 'niws-air-to-niaur-regarding-expenditure-and-financial-performance-measures', 'niws-air-to-niaur-regarding-water-properties-and-population', 'niw-s-air-to-niaur-regarding-water-service-key-outputs-and-service-delivery', 'norther', 'northern-ireland-business-register-and-employment-survey', 'northern-ireland-capital-value-bands-april-2016', 'northern-ireland-catchment-stakeholder-groups', 'northern-ireland-civil-service-employment-statistics', 'northern-ireland-composite-economic-index', 'northern-ireland-estuarine-fish-community-surveys', 'northern-ireland-goods-vehicle-operators-licence-records', 'northern-ireland-groundwater-bodies', 'northern-ireland-imposex-surveys', 'northern-ireland-index-of-production', 'northern-ireland-index-of-services', 'northern-ireland-local-authority-collected-municipal-waste-management-statistics', 'northern-ireland-local-councils-election-22-may-2014', 'northern-ireland-local-management-areas', 'northern-ireland-mineral-resources', 'northern-ireland-multiple-deprivation-measure-2005', 'northern-ireland-multiple-deprivation-measures-2017', 'northern-ireland-net-migration', 'northern-ireland-new-dwelling-completions', 'northern-ireland-new-dwelling-starts', 'northern-ireland-planning-statistics-annual-dataset', 'northern-ireland-railways-halts', 'northern-ireland-railways-nir-bridges', 'northern-ireland-railways-nir-culverts', 'northern-ireland-railways-nir-railway-network', 'northern-ireland-railways-nir-signal-posts', 'northern-ireland-railways-platforms', 'northern-ireland-railways-stations', 'northern-ireland-river-basin-districts', 'northern-ireland-river-water-bodies', 'northern-ireland-road-safety-partnership-2011-20176', 'northern-ireland-road-traffic-collision-data-2013-15-a-visualisation-of-the-data', 'northern-ireland-sites-and-monuments-record', 'northern-ireland-traffic-count-data', 'notifiable-infectious-diseases-report-2016-week-17', 'notifiable-infectious-diseases-reports-noids-northern-ireland-trends-predictions', 'number-of-education-establishments-in-ni-by-management-type', 'number-of-pupils-attending-education-establishmentsin-ni-by-school-type', 'obese-and-overweight-children-health-survey-northern-ireland', 'off-street-car-parks-within-mid-ulster', 'opendatani-dataset-numbers-by-publisher', 'opendatani-dataset-suggestions', 'opendatani-website-statistics-data', 'open-data-up-to-17-18-csv-file-uploaded-csv-13-to-2016-17', 'osni-open-data-10k-grid', 'osni-open-data-10m-dtm-sheets-101-1501', 'osni-open-data-10m-dtm-sheets-1-501', 'osni-open-data-10m-dtm-sheets-151-2001', 'osni-open-data-10m-dtm-sheets-201-2501', 'osni-open-data-10m-dtm-sheets-251-2931', 'osni-open-data-10m-dtm-sheets-51-1001', 'osni-open-data-1-million-raster-infrastructure1', 'osni-open-data-1-million-raster-locations1', 'osni-open-data-1-million-raster-natural-environment1', 'osni-open-data-1-million-raster-parliamentary-boundaries1', 'osni-open-data-50k-admin-boundaries-counties1', 'osni-open-data-50k-admin-boundaries-deas-19931', 'osni-open-data-50k-admin-boundaries-lgds-19931', 'osni-open-data-50k-admin-boundaries-ni-outline1', 'osni-open-data-50k-admin-boundaries-parliamentary-constituencies-20081', 'osni-open-data-50k-admin-boundaries-townlands1', 'osni-open-data-50k-admin-boundaries-wards-19931', 'osni-open-data-50k-grid', 'osni-open-data-50k-transport-line1', 'osni-open-data-50k-transport-text1', 'osni-open-data-50m-digital-terrain-model-csv1', 'osni-open-data-benchmark-data1', 'osni-open-data-largescale-boundaries-county-boundaries1', 'osni-open-data-largescale-boundaries-district-electoral-areas-19931', 'osni-open-data-largescale-boundaries-district-electoral-areas-20121', 'osni-open-data-largescale-boundaries-local-government-districts-19931', 'osni-open-data-largescale-boundaries-local-government-districts-20121', 'osni-open-data-largescale-boundaries-ni-outline1', 'osni-open-data-largescale-boundaries-parliamentary-constituencies-20081', 'osni-open-data-largescale-boundaries-townlands1', 'osni-open-data-largescale-boundaries-wards-19931', 'osni-open-data-largescale-boundaries-wards-20121', 'osni-open-data-midscale-raster1', 'osni-open-data-placename-gazetteer1', 'osni-open-data-river-basin-lidar-2004-dtms-and-dsms', 'osni-open-data-river-basin-lidar-2007-dtms-and-dsms', 'osni-open-data-river-basin-lidar-2008-dtms-and-dsms', 'osni-open-data-river-basin-lidar-2009-dtms-and-dsms', 'osni-open-data-river-basin-lidar-2010-dtms-and-dsms', 'osni-open-data-river-basin-lidar-2012-dtms-and-dsms', 'osni-open-data-river-basin-lidar-2013-dtms-and-dsms', 'osni-open-data-river-basin-lidar-2014-dtms-and-dsms', 'osni-open-data-streetmaps1', 'osni-open-data-street-name-gazetteer1', 'osni-open-data-townland-raster-maps1', 'osni-open-data-transport-50k-points', 'ou', 'outpatient-first-and-follow-up-appointments', 'outpatient-first-and-follow-up-appointments-2015-16', 'outpatient-first-and-follow-up-appointments-2016-17', 'outpatient-first-and-follow-up-appointments-2017-18', 'outpatient-waiting-times', 'parks-and-gardens-ccgbc', 'pedestrain-crossing', 'penalty-charge-notice-data', 'pension-credit-claimants-statistical-geography', 'personal-injury-claims-registered-by-solicitor-and-type', 'pitches-playing-fields', 'places-to-visit-in-causeway-coast-and-glens', 'play-areas-ccgbc', 'play-centres', 'playgrounds', 'police-recorded-crime-in-northern-ireland', 'police-recorded-injury-road-traffic-collision-statistics-northern-ireland', 'police-recorded-injury-road-traffic-collision-statistics-northern-ireland-2013', 'police-recorded-injury-road-traffic-collision-statistics-northern-ireland-2014', 'police-recorded-injury-road-traffic-collision-statistics-northern-ireland-2016', 'police-recorded-injury-road-traffic-collision-statistics-northern-ireland-2017', 'police-recorded-injury-road-traffic-collision-statistics-northern-ireland-2018', 'population-estimates-for-district-electoral-areas-deas-in-northern-ireland', 'population-estimates-for-northern-ireland', 'population-estimates-for-small-areas-northern-ireland', 'population-estimates-for-super-output-areas-soas-and-electoral-wards-northern-ireland', 'population-projection-for-northern-ireland', 'population-projections-for-areas-within-northern-ireland-2016-based', 'pothole-enquiries', 'prescriptions-cost-savings', 'prescriptive-variability-of-drugs-by-general-practitioners', 'primary-1-and-year-8-obesity', 'priorityhabitats_fens', 'priorityhabitats_grasslandinventory_update', 'priorityhabitats_heathland', 'priorityhabitats_peatland', 'priorityhabitats_woodland', 'programme-for-investment-in-public-infrastructure', 'protected-wreck-sites', 'psni-fixed-penalties-and-speed-courses-for-motoring-offences-2017-2018', 'psni-street-crime-data', 'public-toilet-locations-in-causeway-coast-and-glens', 'public-toilets', 'pubs-and-clubs-in-causeway-coast-and-glens', 'ramsar-sites', 'rating-income', 'real-time-rail-stations-arrivals-and-departures', 'recreational-facilities-ccgbc', 'recycling-banks', 'recycling-centres', 'recycling-centres-ccgbc', 'registered-and-responsible-body-list', 'register-of-charities', 'roadworks', 'rqia-registered-services', 'rural-soil-survey', 'scheduled-historic-monument-areas', 'school-census-nursery-schools', 'school-census-post-primary', 'school-census-pre-primary-schools', 'school-census-primary-schools', 'school-census-special-schools', 'school-enrolments-ni-summary-data', 'senior-officer-salaries', 'settlement-boundary-data', 'settlement-development-limits-2015', 'special-areas-of-conservation', 'special-protection-areas', 'sports-activities-ccgbc', 'sports-pitches', 'spreadsheet-of-core-and-cuttings-held-by-gsni', 'state-pension-claimants-statistical-geography', 'stop-and-search-statistics-2016-17', 'stop-and-search-statistics-2017-18', 'suicides-by-occupation', 'surface-defects', 'surface-water-bodies-with-2015-status', 'theatre-utilisation-activity', 'the-continuing-religious-divide-in-northern-ireland-s-schools', 'the-public-trees-of-belfast-city', 'total-discharges-by-age-and-sex-from-acute-hospitals-in-northern-ireland-by-diagnostic-group-icd-10', 'total-paid-hours-worked-annual-survey-of-hours-and-earnings', 'tourismlocations-csv', 'translink-bus-stop-list', 'translink-metro-bus-routes', 'translink-ni-railways-stations', 'translink-ulsterbus-routes', 'travel-to-work-areas-2011', 'trust-community-services-indicators-and-reference-costs', 'trust-reference-costs', 'trust-specialist-services-reference-costs', 'type-of-long-term-condition-by-age-by-sex-dc3101ni', 'uk-parliamentary-election-7-may-2015', 'ulsterbus-and-goldline-timetable-data-from-28-june-31-august-2016', 'umbrella-bodies', 'upcoming-parades', 'using-machine-learning-to-extract-useful-information-about-belfast-trees', 'vehicle-testing-outcomes-by-test-centre', 'victims-survivors-services-funded-organisations-2017-18', 'visualising-the-n-i-bus-network-you-wait-for-ages-and-3-743-show-up-at-once', 'walk-ni-routes-in-causeway-coast-and-glens-borough-council', 'water-abstraction-licence-application-locations-except-public-water-supplies', 'what-s-under-the-trees-visualising-opendatani-lidar-in-a-geographical-information-system-gis', 'whylivehere', 'world-heritage-site', 'york-street-interchange-lidar', 'youth-magistrates-defendants-dealt-with']
resource = 'school-census-post-primary'
dfs = {}
for dataset in odni.action.package_show(id=resource)['resources']:
df = pd.read_csv(dataset['url'], index_col=False)
dfs[dataset['name']] = df
print(list(dfs.keys()))
['School Census - post primary - Reference data', 'School Census - post primary - enrolments', 'School Census - post primary - Free School Meal entitlement', 'School Census - post primary - SEN', 'School Census - post Primary - Religion', 'School Census - post - Primary - newcomers']
dataset
{'mimetype': None,
'cache_url': None,
'hash': '',
'description': 'School Census information - post primary - newcomers to the school',
'name': 'School Census - post - Primary - newcomers',
'format': 'CSV',
'url': 'https://cc-p-ni.ckan.io/dataset/6058be29-b2e1-4253-bab8-8a018568560a/resource/3f83c61f-e2c1-4ec6-b5fb-1251e72afcba/download/school-level-post-primary-newcomers-2016.csv',
'datastore_active': True,
'cache_last_updated': None,
'package_id': '6058be29-b2e1-4253-bab8-8a018568560a',
'created': '2017-02-28T15:44:16.253495',
'state': 'active',
'mimetype_inner': None,
'last_modified': None,
'position': 5,
'revision_id': '5bbdfb85-b2b4-419b-84f8-73f46ec4965b',
'url_type': 'upload',
'id': '3f83c61f-e2c1-4ec6-b5fb-1251e72afcba',
'resource_type': None,
'size': None}
Those who ignore history...
There's a problem; We want to know about change over time.

Dept of Ed have this data 2009-18 on their website in Excel format
OpenDataNI do not 😭
We must deeeeel weeeth eet

test_data = "https://www.education-ni.gov.uk/sites/default/files/publications/education/School%20level%20-%20post%20primary%20schools%20data%20supp%201718.xls"
pd.read_excel(test_data).head()
| Data are collected annually through the School census exercise. | Unnamed: 1 | |
|---|---|---|
| 0 | This takes place in early October, when each s... | NaN |
| 1 | In 2017/18, the school census date was 6th Oct... | NaN |
| 2 | Among the information collected are details on... | NaN |
| 3 | Statistics produced from the school census exe... | NaN |
| 4 | NaN | NaN |
Common Data Extraction Hellscapes
- Inconsistent naming conventions
- Inconsistent format conventions
- Inconsistent schema conventions
- Inconsistent lexical conventions
- Inconsistent policy changes
- Shifting definitions/classifications
- Lack of meta-linkage during all of the above changes
Spot the difference...
School%20level%20-%20post%20primary%20schools%20data%20supp%201718.xlsSchool%20level%20-%20post%20primary%20schools%20data%201617%20supp_0.XLS
- order of fields (
supp 1718vs201617 supp_0) - extra junk (
suppvssupp_0) - inconstent extensions (
xlsvsXLS)
Web Crawling to the rescue!
from bs4 import BeautifulSoup
import requests
base_url="https://www.education-ni.gov.uk"
listing_path = "/articles/school-enrolments-school-level-data"
soup = BeautifulSoup(requests.get(base_url+listing_path).text, 'lxml')
for link in soup.find_all('a'):
if 'School enrolments - school level data 20' in ' '.join(map(str,link.contents)):
print(link)
<a href="https://www.education-ni.gov.uk/node/37331">School enrolments - school level data 2018/19</a> <a href="/publications/school-enrolments-school-level-data-201718">School enrolments - school level data 2017/18</a> <a href="/publications/school-enrolments-school-level-data-201617">School enrolments - school level data 2016/17</a> <a href="/publications/school-enrolments-school-level-data-201516">School enrolments - school level data 2015/16</a> <a href="/publications/school-enrolments-school-level-data-201415">School enrolments - school level data 2014/15</a> <a href="/publications/school-enrolments-school-level-data-201314">School enrolments - school level data 2013/14</a> <a href="/publications/school-enrolments-school-level-data-201213">School enrolments - school level data 2012/13</a> <a href="/publications/school-enrolments-school-level-data-201112">School enrolments - school level data 2011/12</a> <a href="/publications/school-enrolments-school-level-data-201011">School enrolments - school level data 2010/11</a> <a href="/publications/school-enrolments-school-level-data-200910">School enrolments - school level data 2009/10</a>

Then for each of those, get the href associated with the year
soup = BeautifulSoup(requests.get(base_url+listing_path).text, 'lxml')
year_urls = {}
for link in soup.find_all('a'):
contents = ' '.join(map(str,link.contents))
if 'School enrolments - school level data 20' in contents:
#year = link.get('href')[-6:-2]
year = link.get_text()[-7:-3]
year_urls[int(year)] = link.get('href')
year_urls
{2018: 'https://www.education-ni.gov.uk/node/37331',
2017: '/publications/school-enrolments-school-level-data-201718',
2016: '/publications/school-enrolments-school-level-data-201617',
2015: '/publications/school-enrolments-school-level-data-201516',
2014: '/publications/school-enrolments-school-level-data-201415',
2013: '/publications/school-enrolments-school-level-data-201314',
2012: '/publications/school-enrolments-school-level-data-201213',
2011: '/publications/school-enrolments-school-level-data-201112',
2010: '/publications/school-enrolments-school-level-data-201011',
2009: '/publications/school-enrolments-school-level-data-200910'}
Then walk those pages and grab the Excel files...
Using urllib.request.urlretrieve to store them on the local filesystem
import urllib.request
from pathlib import Path
from collections import defaultdict
year_files = defaultdict(list)
dest = Path('./data/education-ni/')
for year, path in year_urls.items():
dest.joinpath(str(year)).mkdir(parents=True, exist_ok=True)
if path.startswith('http'): #new docs use real references
soup = BeautifulSoup(requests.get(path).text, 'lxml')
else:
soup = BeautifulSoup(requests.get(base_url+path).text, 'lxml')
for link in soup.find_all('a'):
href=link.get('href',"")
filename = href.split('/')[-1]
contents = ' '.join(map(str,link.contents))
if 'xls' in href.split('.')[-1].lower():
# See this requirement right 👆
# Mix of xls, XLSX, xlsx and XLS
if not dest.joinpath(str(year),filename).exists():
urllib.request.urlretrieve(href, dest.joinpath(str(year),filename))
year_files[year].append(filename)
print(f"{year}:{len(year_files[year])} docs")
2018:8 docs 2017:8 docs 2016:8 docs 2015:5 docs 2014:5 docs 2013:5 docs 2012:5 docs 2011:5 docs 2010:5 docs 2009:5 docs
Transformation
We've technically 'Extracted' the data we wanted from the source,
Clean and twist the data until it's useful
This is the most frustrating part of being a data scientist/engineer...

Quick inspection of filename 'conventions'
for year, filenames in year_files.items():
for file in filenames:
print(f"{year}:/{file}")
2018:/School%20level%20-%20nursery%20schools%20data%201819.XLSX 2018:/School%20level%20-%20pre%20school%20data%201819.XLSX 2018:/Copy%20of%20School%20level%20-%20primary%20schools%20data%201819.XLSX 2018:/School%20level%20-%20post%20primary%20schools%20data%201819.XLS 2018:/School%20level%20-%20special%20school%20data%201819.XLSX 2018:/Available%20places%20-%20nursery%20schools%20and%20units%201819.XLSX 2018:/Available%20places%20-%20primary%201819.XLSX 2018:/Available%20places%20-%20post-primary%201819.XLSX 2017:/School%20level%20-%20nursery%20schools%20data%201718%20supp.xlsx 2017:/School%20level%20-%20post%20primary%20schools%20data%20supp%201718.xls 2017:/School%20level%20-%20primary%20schools%20data%20supp%201718.xlsx 2017:/School%20level%20-%20pre%20school%20data%201718%20supp.xlsx 2017:/available%20places%20-%20primary%201718%20supp.xlsx 2017:/available%20places%20-%20post-primary%201718%20supp.xlsx 2017:/available%20places%20-%20nursery%201718%20supp.xlsx 2017:/School%20level%20-%20special%20school%20data%202017-18_0.xlsx 2016:/School%20level%20-%20nursery%20schools%20data%201617%20supp.XLS 2016:/School%20level%20-%20post%20primary%20schools%20data%201617%20supp_0.XLS 2016:/School%20level%20-%20primary%20schools%20data%201617%20supp.XLSX 2016:/School%20level%20-%20pre%20school%20data%201617%20supp.XLSX 2016:/School%20level%20-%20special_school_data%201617%20supp_0.XLSX 2016:/available%20places%20-%20primary%201617%20supp.XLSX 2016:/available%20places%20-%20post-primary%201617%20supp.XLSX 2016:/available%20places%20-%20nursery%201617%20supp%20final.XLSX 2015:/School%20level%20-%20nursery%20schools%20data%201516%20supp.XLS 2015:/School-level-post-primary-schools-data-1516_1.XLS 2015:/School%20level%20-%20primary%20schools%20data%201516%20supp_0.XLSX 2015:/School%20level%20-%20pre%20school%20data%201516%20supp.XLSX 2015:/School%20level%20-%20special_school_data%201516%20supp.XLSX 2014:/School%20level%20-%20pre%20school%20data%201415.XLS 2014:/School%20level%20-%20nursery%20schools%20data%201415%20supp%20-%20unfilled%20places.XLS 2014:/primary-schools-data-1415-supp-with-unfilled-places.xlsx 2014:/post-primary-schools-data-1415-supp-with-unfilled-places.xlsx 2014:/special-school-data-1415-supp.xlsx 2013:/pre-school-data-2013-14.xlsx 2013:/nursery-schools-data-13-14-supp-incl-unfilled-places.xlsx 2013:/primary-schools-data-2013-14-supp-inc-unfilled-places.xlsx 2013:/post-primary-schools-data-13-14-supp-inc-unfilled-places.xlsx 2013:/special-school-data-2013-14-supp.xlsx 2012:/pre-school-data-2012-13.xlsx 2012:/nursery-schools-data-2012-13-supp-inc-unfilled-places.xlsx 2012:/primary-schools-data-2012-13-supp-inc-unfilled-places-2.xlsx 2012:/post-primary-schools-data-2012-13-supp-inc-unfilled-places.xlsx 2012:/special-school-data-2012-13-supp.xlsx 2011:/pre-school-data-2011-12.xlsx 2011:/nursery-schools-data-2011-12-supp-inc-unfilled-2.xlsx 2011:/primary-schools-data-11-12-supp-inc-unfilled-places-r.xlsx 2011:/post-primary-schools-data-11-12-supp-inc-unfilled-2.xlsx 2011:/special-school-data-11-12-supp.xlsx 2010:/pre-school-data-1011-3.xlsx 2010:/nursery-schools-data-2010-11-supp-inc-unfilled.xlsx 2010:/primary-schools-data-1011-supp-inc-unfilled-r.xlsx 2010:/post-primary-schools-data-10-11-supp-inc-unfilled.xlsx 2010:/special-school-data-1011-supp-2.xlsx 2009:/pre-school-data-0910-3.xlsx 2009:/nursery-schools-data-0910-supp-3.xlsx 2009:/primary-schools-data-0910-supp-r.xlsx 2009:/post-primary-schools-data-0910-supp-2.xlsx 2009:/special-school-data-0910-supp-3.xlsx
Zero in on just post-primary data
for year, filenames in year_files.items():
for file in filenames:
if 'post' in file:
print(f"{year}:/{file}")
2018:/School%20level%20-%20post%20primary%20schools%20data%201819.XLS 2018:/Available%20places%20-%20post-primary%201819.XLSX 2017:/School%20level%20-%20post%20primary%20schools%20data%20supp%201718.xls 2017:/available%20places%20-%20post-primary%201718%20supp.xlsx 2016:/School%20level%20-%20post%20primary%20schools%20data%201617%20supp_0.XLS 2016:/available%20places%20-%20post-primary%201617%20supp.XLSX 2015:/School-level-post-primary-schools-data-1516_1.XLS 2014:/post-primary-schools-data-1415-supp-with-unfilled-places.xlsx 2013:/post-primary-schools-data-13-14-supp-inc-unfilled-places.xlsx 2012:/post-primary-schools-data-2012-13-supp-inc-unfilled-places.xlsx 2011:/post-primary-schools-data-11-12-supp-inc-unfilled-2.xlsx 2010:/post-primary-schools-data-10-11-supp-inc-unfilled.xlsx 2009:/post-primary-schools-data-0910-supp-2.xlsx
Don't try and tackle it all at once
Right, lets limit our scope to look at places available to get a better understanding of the data
for year, filenames in year_files.items():
print(f"Year: {year}")
for file in filenames:
if file.lower().startswith('available'):
print(file)
Year: 2018 Available%20places%20-%20nursery%20schools%20and%20units%201819.XLSX Available%20places%20-%20primary%201819.XLSX Available%20places%20-%20post-primary%201819.XLSX Year: 2017 available%20places%20-%20primary%201718%20supp.xlsx available%20places%20-%20post-primary%201718%20supp.xlsx available%20places%20-%20nursery%201718%20supp.xlsx Year: 2016 available%20places%20-%20primary%201617%20supp.XLSX available%20places%20-%20post-primary%201617%20supp.XLSX available%20places%20-%20nursery%201617%20supp%20final.XLSX Year: 2015 Year: 2014 Year: 2013 Year: 2012 Year: 2011 Year: 2010 Year: 2009


Try and identify subclasses of datasets that may be tackled automagically
Ok, what about actually parsing the excel sheets?
Will they be consistent?
sheets = defaultdict(list)
for year, files in year_files.items():
for file in files:
if 'post' in file:
xls = pd.ExcelFile(f'data/education-ni/{year}/{file}')
sheets[year].extend(xls.sheet_names)
dict(sheets)
{2018: ['meta data',
'reference data',
'enrolments',
'free school meals',
'SEN',
'religion',
'newcomers',
'School level data',
'Overall'],
2017: ['meta data',
'reference data',
'enrolments',
'free school meals',
'SEN',
'religion',
'newcomers',
'School level data',
'Overall'],
2016: ['meta data',
'reference data',
'enrolments',
'free school meals',
'SEN',
'religion',
'newcomers',
'School level data',
'Overall'],
2015: ['meta data',
'reference data',
'enrolments',
'gender',
'free school meals',
'SEN',
'religion',
'newcomers',
'unfilled places'],
2014: ['meta data',
'reference data',
'enrolments',
'gender',
'free school meals',
'SEN',
'religion',
'newcomers',
'unfilled places'],
2013: ['meta data',
'reference data',
'enrolments',
'gender',
'free school meals',
'SEN',
'unfilled places'],
2012: ['meta data',
'reference data',
'enrolments',
'gender',
'free school meals',
'SEN',
'unfilled places'],
2011: ['meta data',
'reference data',
'enrolments',
'gender',
'free school meals',
'SEN',
'unfilled places'],
2010: ['meta data',
'reference data',
'enrolments',
'gender',
'free school meals',
'SEN',
'unfilled places'],
2009: ['meta data',
'reference data',
'enrolments',
'gender',
'free school meals',
'SEN']}
from collections import Counter
all_sheet_names = Counter([_ for d in sheets.values() for _ in d])
all_sheet_names.most_common()
[('meta data', 10),
('reference data', 10),
('enrolments', 10),
('free school meals', 10),
('SEN', 10),
('gender', 7),
('unfilled places', 6),
('religion', 5),
('newcomers', 5),
('School level data', 3),
('Overall', 3)]
df = pd.DataFrame.from_dict({
year: [sn in sheet_names for sn in all_sheet_names]
for year, sheet_names in sheets.items()
}, orient='index')
df.columns=all_sheet_names.keys()
df.T
| 2018 | 2017 | 2016 | 2015 | 2014 | 2013 | 2012 | 2011 | 2010 | 2009 | |
|---|---|---|---|---|---|---|---|---|---|---|
| meta data | True | True | True | True | True | True | True | True | True | True |
| reference data | True | True | True | True | True | True | True | True | True | True |
| enrolments | True | True | True | True | True | True | True | True | True | True |
| free school meals | True | True | True | True | True | True | True | True | True | True |
| SEN | True | True | True | True | True | True | True | True | True | True |
| religion | True | True | True | True | True | False | False | False | False | False |
| newcomers | True | True | True | True | True | False | False | False | False | False |
| School level data | True | True | True | False | False | False | False | False | False | False |
| Overall | True | True | True | False | False | False | False | False | False | False |
| gender | False | False | False | True | True | True | True | True | True | True |
| unfilled places | False | False | False | True | True | True | True | True | True | False |
Visualisation isn't just for output data...
Use visualisation tools to validate your transformation assumptions...
All. The. Time.
import seaborn as sns
f,ax = plt.subplots(figsize=graph_figsize)
sns.heatmap(df.T, ax=ax)
<matplotlib.axes._subplots.AxesSubplot at 0x7fe953c5edd8>


Sometimes understanding the data is more painful (and ugly) than expected
This was the only document that seemed to explain what 'supernumerary' actually means

It means 'extra'...
Using multiple tools simultanously can be problematic...
Excel on Mac helpfully puts down a lock-entry on open excel files which prevent it from being opened by other things.
Pandas occasionally has unhelpful error messages in this regard

Sometimes you have to give up on stuff because it's too dangerous an area to walk in to.
Special Educational Needs classification policy is >>100pg policy that appears to change every year.
I am not an expert on education policy so I'm not sticking my foot in that one without being sure I understand the implications.
It's your responsibility as a Data Science to be able to make that call, and know your limits.
"Machine Readable"


def join_n_strip_n_lower(l): return ' '.join(l).strip().lower()
def strip_n_lower(s): return s.strip().lower()
def unyearify(s): return int(s.replace('year ', ''))
def parse_reference_table(xls):
"""
From an ExcelFile, clean up:
* School Mgmt Type disaster
* Inconsistent header depth
* Multi-row header names
* inconsistent headers (ref_key_map)
* inconsistent col order
* inconsistent caps/spacing (strip|lower)
"""
cols= [
'de ref',
'school name',
'school type',
'address 1',
'postcode',
'urban_rural',
'school management type',
'district council',
'parliamentary constituency',
'town'
]
categories = [
'school type',
'urban_rural',
'school management type',
'district council',
'parliamentary constituency',
'town'
]
ref_key_map={
'denino':'de ref',
'urban/ rural': 'urban_rural',
'schoolname': 'school name'
}
reference_value_rename = {
'school management type':{
'gmi':'integrated',
'controlled integrated':'integrated',
'roman catholic maintained':'rc maintained',
'grant maintained integrated':'integrated',
'voluntary - other managed':'voluntary',
'voluntary - rc managed':'voluntary',
'catholic maintained':'rc maintained'
}
}
if 'reference data' in xls.sheet_names:
df = pd.read_excel(xls, 'reference data', header=None)
h_range = 2 if isinstance(df.ix[3,0], int) else 3
try:
df.columns=df.ix[1:h_range].fillna('').apply(join_n_strip_n_lower, axis=0).values
df.rename(columns=ref_key_map, inplace=True)
df = df.drop(df.index[0:h_range+1]).reset_index(drop=True)
df = df[cols]
if hasattr(df['de ref'], 'str'):
try:
df = df[df['de ref'].str.isdigit().fillna(True)].dropna(how='all', axis=0)
except KeyError:
pass
df['de ref'] = df['de ref'].astype(int)
df.set_index('de ref', inplace=True)
for c in df:
df[c]=df[c].str.lower().str.strip()
df.replace(reference_value_rename, inplace=True)
for c in categories:
df[c].fillna('NA', inplace=True)
df[c] = df[c].astype('category')
except TypeError as e:
print(e)
else:
df=None
return df
def parse_enrolments_table(xls):
"""From an ExcelFile, clean up:
* Inconsistent header depth
* fucked up nans/nulls all over the place
* inconsistent *footer* depth...
* Set de ref as join index and drop pointless fields
"""
if 'enrolments' in xls.sheet_names:
df = pd.read_excel(xls, 'enrolments', header=None, skip_footer=5)
h_range = 2 if isinstance(df.ix[3, 0], int) else 3
try:
df.columns = df.ix[3].fillna('').apply(strip_n_lower).values
df = df.drop(df.index[0:h_range+1]).reset_index(drop=True)
df.dropna(how='all', inplace=True, axis=0)
if hasattr(df['de ref'], 'str'):
try:
df = df[df['de ref'].str.isdigit().fillna(True)].dropna(how='all', axis=0)
except KeyError:
pass
df['de ref'] = df['de ref'].astype(int)
df.drop('schoolname', axis=1, inplace=True)
df.drop('total pupils', axis=1, inplace=True)
df.set_index('de ref', inplace=True)
df.rename(columns=unyearify, inplace=True)
df = df.astype(float)
except TypeError as e:
print(e)
else:
df = None
return df
def parse_fsm_table(xls):
"""From an ExcelFile, clean up:
* Inconsistent header depth
* fucked up nans/nulls all over the place
* inconsistent *footer* depth...
* Set de ref as join index and drop pointless fields
"""
join_n_strip_n_lower = lambda l: ' '.join(l).strip().lower()
strip_n_lower = lambda s: s.strip().lower()
unyearify = lambda s: int(s.replace('year ',''))
if 'free school meals' in xls.sheet_names:
df = pd.read_excel(xls, 'free school meals', header=None, skip_footer=5)
h_range = 2 if isinstance(df.ix[3,0], int) else 3
try:
df.columns=df.ix[3].fillna('').apply(strip_n_lower).values
df = df.drop(df.index[0:h_range+1]).reset_index(drop=True)
df.dropna(how='all', inplace=True, axis=0)
df['de ref'] = df['de ref'].astype(int)
df.drop('schoolname',axis=1, inplace=True)
df.drop('free school meals', axis=1, inplace=True)
df.set_index('de ref', inplace=True)
df.replace('#',pd.np.nan, inplace=True) # # = Undisclosed
df.replace('*',2.0, inplace=True) # * == < 5
df.replace('!',1, inplace=True) # ! avoid identification, so it's prob one or two
df=df.astype(float)
except TypeError as e:
print(e)
else:
df=None
return df
def parse_available_table(xls):
"""From an ExcelFile, clean up:
* Inconsistent header depth
* fucked up nans/nulls all over the place
* inconsistent *footer* depth...
* Set de ref as join index and drop pointless fields
* Totally different schemas between years
* Inconsistent metric naming
* non numerical data flags (*/!)
"""
ref_key_map={
'schoolname': 'school name',
'total unfilled places': 'available places',
'unfilled places': 'available places',
'total approved enrolment number': 'approved enrolments'
}
join_n_strip_n_lower = lambda l: ' '.join(l).strip().lower()
if 'School level data' in xls.sheet_names:
df = pd.read_excel(xls, 'School level data', header=None)
h_range = 2 if isinstance(df.ix[3,0], int) else 3
elif 'unfilled places' in xls.sheet_names:
df = pd.read_excel(xls, 'unfilled places', header=None)
h_range = 2 if isinstance(df.ix[3,0], int) else 3
else:
df=None
if df is not None:
try:
df.columns=df.ix[1:h_range].fillna('').apply(join_n_strip_n_lower, axis=0).values
df.rename(columns=ref_key_map, inplace=True)
df = df.drop(df.index[0:h_range+1]).reset_index(drop=True)
df=df.applymap(lambda x: np.nan if isinstance(x, str) and x.isspace() else x)
df.dropna(how='all', axis=1, inplace=True)
df.dropna(how='any', axis=0, inplace=True)
if df.shape[1] == 6: # recent doesn't have fecking headers
cols = list(df.columns)
cols[0] = 'de ref'
cols[1] = 'school name'
df.columns=cols
df.drop('school name', axis=1, inplace=True)
df['de ref'] = df['de ref'].astype(int)
df.set_index('de ref', inplace=True)
df.replace('*',2.0, inplace=True) # * == < 5
df.replace('!',1, inplace=True) # ! avoid identification, so it's prob one or two
df.dropna(how='all', inplace=True, axis=1)
df.astype(int, inplace=True)
except TypeError as e:
print(e)
return df
re_dfs={}
av_dfs={}
en_dfs={}
fsm_dfs={}
for year, files in year_files.items():
for file in files:
if 'post' in file:
xls = pd.ExcelFile(f'data/education-ni/{year}/{file}')
df = parse_reference_table(xls)
if df is not None:
print(f'Got reference data for {year}')
re_dfs[year]=df
df = parse_enrolments_table(xls)
if df is not None:
print(f'Got enrolment data for {year}')
en_dfs[year]=df
df = parse_available_table(xls)
if df is not None:
print(f'Got available data for {year}')
av_dfs[year]=df
df = parse_fsm_table(xls)
if df is not None:
print(f'Got fsm data for {year}')
fsm_dfs[year]=df
reference = pd.Panel(re_dfs).sort_index()
available = pd.Panel(av_dfs).sort_index()
enrolment = pd.Panel(en_dfs).sort_index()
fsm = pd.Panel(fsm_dfs).sort_index()
Got reference data for 2018 Got enrolment data for 2018 Got fsm data for 2018 Got available data for 2018 Got reference data for 2017 Got enrolment data for 2017 Got fsm data for 2017 Got available data for 2017 Got reference data for 2016 Got enrolment data for 2016 Got fsm data for 2016 Got available data for 2016 Got reference data for 2015 Got enrolment data for 2015 Got available data for 2015 Got fsm data for 2015 Got reference data for 2014 Got enrolment data for 2014 Got available data for 2014 Got fsm data for 2014 Got reference data for 2013 Got enrolment data for 2013 Got available data for 2013 Got fsm data for 2013 Got reference data for 2012 Got enrolment data for 2012 Got available data for 2012 Got fsm data for 2012 Got reference data for 2011 Got enrolment data for 2011 Got available data for 2011 Got fsm data for 2011 Got reference data for 2010 Got enrolment data for 2010 Got available data for 2010 Got fsm data for 2010 Got reference data for 2009 Got enrolment data for 2009 Got fsm data for 2009
Bring it all together
Panels are 3D Dataframes, i.e. [Year x School x Metric]
- Reference: School name, address, denomination, type, etc.
- Available: Allocated places information
- Enrolment: Actual student numbers
- FSM: Free School Meals: Laziest possible deprivation measure, probably doesn't need to be a panel

enrolment.sum()
| 2009 | 2010 | 2011 | 2012 | 2013 | 2014 | 2015 | 2016 | 2017 | 2018 | |
|---|---|---|---|---|---|---|---|---|---|---|
| 8 | 23116.0 | 23113.0 | 21332.0 | 21322.0 | 21418.0 | 21367.0 | 21792.0 | 22571.0 | 22817.0 | 23866.0 |
| 9 | 23859.0 | 23403.0 | 22479.0 | 21928.0 | 21425.0 | 21481.0 | 21422.0 | 22284.0 | 22650.0 | 22906.0 |
| 10 | 22954.0 | 24155.0 | 22809.0 | 23101.0 | 21971.0 | 21527.0 | 21443.0 | 21864.0 | 22381.0 | 22776.0 |
| 11 | 23521.0 | 23277.0 | 23615.0 | 23524.0 | 23299.0 | 22092.0 | 21601.0 | 22118.0 | 22102.0 | 22631.0 |
| 12 | 23808.0 | 23656.0 | 22520.0 | 24027.0 | 23353.0 | 23166.0 | 21864.0 | 22091.0 | 22099.0 | 21988.0 |
| 13 | 14912.0 | 15652.0 | 15073.0 | 15892.0 | 16567.0 | 16208.0 | 15912.0 | 15667.0 | 15347.0 | 15271.0 |
| 14 | 12607.0 | 13097.0 | 13038.0 | 13482.0 | 13554.0 | 14174.0 | 13922.0 | 13818.0 | 13149.0 | 12801.0 |
| 15 | 100.0 | 154.0 | 143.0 | 196.0 | 201.0 | 275.0 | 365.0 | NaN | NaN | NaN |
enrolment.sum().sum().iplot()
enrolment.sum().iplot(kind='bar')
enrolment.sum().T.iplot(kind='bar',barmode='stack')
# What is wrong with this "sum" table?
enrolment.sum(axis=2).head()
| 2009 | 2010 | 2011 | 2012 | 2013 | 2014 | 2015 | 2016 | 2017 | 2018 | |
|---|---|---|---|---|---|---|---|---|---|---|
| de ref | ||||||||||
| 1210014 | 672.0 | 688.0 | 703.0 | 708.0 | 704.0 | 697.0 | 704.0 | 696.0 | 691.0 | 699.0 |
| 1210015 | 647.0 | 650.0 | 649.0 | 666.0 | 709.0 | 737.0 | 744.0 | 728.0 | 740.0 | 765.0 |
| 1210021 | 963.0 | 929.0 | 899.0 | 930.0 | 916.0 | 884.0 | 910.0 | 954.0 | 946.0 | 983.0 |
| 1210022 | 907.0 | 932.0 | 913.0 | 930.0 | 943.0 | 969.0 | 968.0 | 991.0 | 997.0 | 1003.0 |
| 1210266 | 297.0 | 290.0 | 264.0 | 247.0 | 88.0 | NaN | NaN | NaN | NaN | NaN |

[10]+[np.nan]*10
[10, nan, nan, nan, nan, nan, nan, nan, nan, nan, nan]
sum([10]+[np.nan]*10)
nan
pd.Series([10]+[np.nan]*10).sum()
10.0
pd.Series([10]+[np.nan]*10).mean()
10.0
pd.Series([np.nan]*10).sum()
nan
pd.Series([10]+[0.0]*10).mean()
0.90909090909090906
# These 0's are actually sum([np.nan])
# The school was closed in 2014
enrolment.sum(axis=2).head()
| 2009 | 2010 | 2011 | 2012 | 2013 | 2014 | 2015 | 2016 | 2017 | 2018 | |
|---|---|---|---|---|---|---|---|---|---|---|
| de ref | ||||||||||
| 1210014 | 672.0 | 688.0 | 703.0 | 708.0 | 704.0 | 697.0 | 704.0 | 696.0 | 691.0 | 699.0 |
| 1210015 | 647.0 | 650.0 | 649.0 | 666.0 | 709.0 | 737.0 | 744.0 | 728.0 | 740.0 | 765.0 |
| 1210021 | 963.0 | 929.0 | 899.0 | 930.0 | 916.0 | 884.0 | 910.0 | 954.0 | 946.0 | 983.0 |
| 1210022 | 907.0 | 932.0 | 913.0 | 930.0 | 943.0 | 969.0 | 968.0 | 991.0 | 997.0 | 1003.0 |
| 1210266 | 297.0 | 290.0 | 264.0 | 247.0 | 88.0 | NaN | NaN | NaN | NaN | NaN |
reference[2013].loc[1210266]
school name orangefield high school school type secondary address 1 cameronian drive postcode bt56aw urban_rural urban school management type controlled district council belfast parliamentary constituency belfast east town belfast Name: 1210266, dtype: object
reference[2014].loc[1210266]
school name NaN school type NaN address 1 NaN postcode NaN urban_rural NaN school management type NaN district council NaN parliamentary constituency NaN town NaN Name: 1210266, dtype: object
# It *should* look like this
enrolment.sum(axis=2).head().replace(0.0, np.nan)
| 2009 | 2010 | 2011 | 2012 | 2013 | 2014 | 2015 | 2016 | 2017 | 2018 | |
|---|---|---|---|---|---|---|---|---|---|---|
| de ref | ||||||||||
| 1210014 | 672.0 | 688.0 | 703.0 | 708.0 | 704.0 | 697.0 | 704.0 | 696.0 | 691.0 | 699.0 |
| 1210015 | 647.0 | 650.0 | 649.0 | 666.0 | 709.0 | 737.0 | 744.0 | 728.0 | 740.0 | 765.0 |
| 1210021 | 963.0 | 929.0 | 899.0 | 930.0 | 916.0 | 884.0 | 910.0 | 954.0 | 946.0 | 983.0 |
| 1210022 | 907.0 | 932.0 | 913.0 | 930.0 | 943.0 | 969.0 | 968.0 | 991.0 | 997.0 | 1003.0 |
| 1210266 | 297.0 | 290.0 | 264.0 | 247.0 | 88.0 | NaN | NaN | NaN | NaN | NaN |
AUDIENCE PARTICIPATION
Which of the below is the correct answer to: "What is the average number of pupils per school in Northern Ireland from 2009 to 2017?"
#A Sum of years, swap 0 for nan, mean over schools, mean over classes
enrolment.sum(axis=1).replace(0.0, np.nan).mean(axis=1).mean()
17750.944642857146
#B Sum over classes, mean over schools, swap 0 for nan, mean over years
enrolment.sum(axis=2).mean().replace(0.0,np.nan).mean()
688.20967740978392
#C Sum over classes, swap 0.0 for nan, mean over schools, mean over years
enrolment.sum(axis=2).replace(0.0, np.nan).mean().mean()
688.20967740978392
C: Sum over classes, swap 0.0 for nan, mean over schools, mean over years!
But why not B, it's doing the same thing right?
enrolment.sum(axis=2).head()
| 2009 | 2010 | 2011 | 2012 | 2013 | 2014 | 2015 | 2016 | 2017 | 2018 | |
|---|---|---|---|---|---|---|---|---|---|---|
| de ref | ||||||||||
| 1210014 | 672.0 | 688.0 | 703.0 | 708.0 | 704.0 | 697.0 | 704.0 | 696.0 | 691.0 | 699.0 |
| 1210015 | 647.0 | 650.0 | 649.0 | 666.0 | 709.0 | 737.0 | 744.0 | 728.0 | 740.0 | 765.0 |
| 1210021 | 963.0 | 929.0 | 899.0 | 930.0 | 916.0 | 884.0 | 910.0 | 954.0 | 946.0 | 983.0 |
| 1210022 | 907.0 | 932.0 | 913.0 | 930.0 | 943.0 | 969.0 | 968.0 | 991.0 | 997.0 | 1003.0 |
| 1210266 | 297.0 | 290.0 | 264.0 | 247.0 | 88.0 | NaN | NaN | NaN | NaN | NaN |
enrolment.sum(axis=2).head().mean().to_frame().T
| 2009 | 2010 | 2011 | 2012 | 2013 | 2014 | 2015 | 2016 | 2017 | 2018 | |
|---|---|---|---|---|---|---|---|---|---|---|
| 0 | 697.2 | 697.8 | 685.6 | 696.2 | 672.0 | 821.75 | 831.5 | 842.25 | 843.5 | 862.5 |
enrolment.sum(axis=2).replace(0.0,np.nan).head()
| 2009 | 2010 | 2011 | 2012 | 2013 | 2014 | 2015 | 2016 | 2017 | 2018 | |
|---|---|---|---|---|---|---|---|---|---|---|
| de ref | ||||||||||
| 1210014 | 672.0 | 688.0 | 703.0 | 708.0 | 704.0 | 697.0 | 704.0 | 696.0 | 691.0 | 699.0 |
| 1210015 | 647.0 | 650.0 | 649.0 | 666.0 | 709.0 | 737.0 | 744.0 | 728.0 | 740.0 | 765.0 |
| 1210021 | 963.0 | 929.0 | 899.0 | 930.0 | 916.0 | 884.0 | 910.0 | 954.0 | 946.0 | 983.0 |
| 1210022 | 907.0 | 932.0 | 913.0 | 930.0 | 943.0 | 969.0 | 968.0 | 991.0 | 997.0 | 1003.0 |
| 1210266 | 297.0 | 290.0 | 264.0 | 247.0 | 88.0 | NaN | NaN | NaN | NaN | NaN |
enrolment.sum(axis=2).replace(0.0,np.nan).mean().to_frame().T
| 2009 | 2010 | 2011 | 2012 | 2013 | 2014 | 2015 | 2016 | 2017 | 2018 | |
|---|---|---|---|---|---|---|---|---|---|---|
| 0 | 670.726852 | 678.273148 | 674.684211 | 673.577465 | 681.673077 | 681.019417 | 691.605 | 698.572139 | 706.256281 | 725.709184 |
It's your responsibility as a Data Scientist to understand what questions your algorithms are really answering, and make sure that the people who may be answering those question are crystal clear about what your data means.
Data Science is as much about comprehension and communication as it is about statistics and programming.
Return of regular schedule - What happened to average cohort sizes in 2015?
enrolment.mean(axis=2).mean().iplot(title='Annual Average Cohort (school,class,year)')
enrolment.mean(axis=2).T.iplot(title='Annual Average Cohort (school,class,year) per school', legend=False)
annual_school_enrolment = enrolment.sum(axis=2).T
annual_school_enrolment.head()
| de ref | 1210014 | 1210015 | 1210021 | 1210022 | 1210266 | 1230026 | 1230053 | 1230089 | 1230104 | 1230130 | ... | 5420059 | 5420060 | 5420062 | 5420073 | 5420076 | 5420260 | 5420263 | 5420268 | 5420304 | 5420314 |
|---|---|---|---|---|---|---|---|---|---|---|---|---|---|---|---|---|---|---|---|---|---|
| 2009 | 672.0 | 647.0 | 963.0 | 907.0 | 297.0 | 784.0 | 1547.0 | 691.0 | 438.0 | 468.0 | ... | 880.0 | 861.0 | 919.0 | 527.0 | 836.0 | 646.0 | NaN | NaN | NaN | NaN |
| 2010 | 688.0 | 650.0 | 929.0 | 932.0 | 290.0 | 785.0 | 1530.0 | 687.0 | 429.0 | 440.0 | ... | 887.0 | 861.0 | 940.0 | 555.0 | 846.0 | 658.0 | 682.0 | 803.0 | NaN | NaN |
| 2011 | 703.0 | 649.0 | 899.0 | 913.0 | 264.0 | 764.0 | 1530.0 | 690.0 | 384.0 | 406.0 | ... | 894.0 | 864.0 | 942.0 | 579.0 | 845.0 | 665.0 | NaN | NaN | NaN | NaN |
| 2012 | 708.0 | 666.0 | 930.0 | 930.0 | 247.0 | 765.0 | 1521.0 | 692.0 | 367.0 | 388.0 | ... | 907.0 | 861.0 | 920.0 | 604.0 | 849.0 | 652.0 | 706.0 | NaN | NaN | NaN |
| 2013 | 704.0 | 709.0 | 916.0 | 943.0 | 88.0 | 705.0 | 1516.0 | 684.0 | 423.0 | 352.0 | ... | 900.0 | 858.0 | 900.0 | 635.0 | 855.0 | 653.0 | 712.0 | NaN | NaN | NaN |
5 rows × 234 columns
name_lookup = reference.minor_xs('school name').T.describe().ix['top']
annual_school_enrolment.rename(columns=name_lookup).iplot(legend=False)
annual_school_enrolment.index.min()
2009
first = annual_school_enrolment.replace(0.0,np.nan).\
apply(pd.Series.first_valid_index).\
replace(annual_school_enrolment.index.min(),np.nan)
last = annual_school_enrolment.replace(0.0,np.nan).\
apply(pd.Series.last_valid_index).\
replace(annual_school_enrolment.index.max(),np.nan)
first.dropna()
de ref 1230321 2017.0 1410315 2014.0 2210312 2013.0 2230322 2017.0 2240319 2015.0 2410311 2011.0 2420320 2016.0 3210313 2015.0 3210323 2018.0 3230310 2010.0 3230318 2018.0 3420317 2015.0 4210316 2015.0 5230321 2017.0 5420263 2010.0 5420268 2010.0 5420304 2016.0 5420314 2016.0 dtype: float64
close_vec=pd.DataFrame({
'opened':first.groupby(first).size(),
'closed':last.groupby(last).size()}
)
close_vec
| closed | opened | |
|---|---|---|
| 2009.0 | 3.0 | NaN |
| 2010.0 | 2.0 | 3.0 |
| 2011.0 | 1.0 | 1.0 |
| 2012.0 | 6.0 | NaN |
| 2013.0 | 3.0 | 1.0 |
| 2014.0 | 11.0 | 1.0 |
| 2015.0 | 2.0 | 4.0 |
| 2016.0 | 5.0 | 3.0 |
| 2017.0 | 5.0 | 3.0 |
| 2018.0 | NaN | 2.0 |
close_vec.cumsum().fillna(method='ffill').iplot(title="Cumulative number of schools opened\closed since 2009")
Skippable Aside: Slicing Panels
up_to_ks3=enrolment.minor_axis<=10
up_to_ks3
array([ True, True, True, False, False, False, False, False], dtype=bool)
enrolment[:,:,up_to_ks3].sum()
| 2009 | 2010 | 2011 | 2012 | 2013 | 2014 | 2015 | 2016 | 2017 | 2018 | |
|---|---|---|---|---|---|---|---|---|---|---|
| 8 | 23116.0 | 23113.0 | 21332.0 | 21322.0 | 21418.0 | 21367.0 | 21792.0 | 22571.0 | 22817.0 | 23866.0 |
| 9 | 23859.0 | 23403.0 | 22479.0 | 21928.0 | 21425.0 | 21481.0 | 21422.0 | 22284.0 | 22650.0 | 22906.0 |
| 10 | 22954.0 | 24155.0 | 22809.0 | 23101.0 | 21971.0 | 21527.0 | 21443.0 | 21864.0 | 22381.0 | 22776.0 |
cowtown=reference.major_axis[(reference.minor_xs('town')=='ballymoney').any(axis=1)]
cowtown
Int64Index([3210133, 3230075, 3420012], dtype='int64', name='de ref')
enrolment.sum(axis=2).loc[cowtown].sum()
2009 1722.0 2010 1728.0 2011 1736.0 2012 1766.0 2013 1757.0 2014 1762.0 2015 1746.0 2016 1743.0 2017 1691.0 2018 1749.0 dtype: float64
Mapping
- Maps are hard in NI
- No Open Data mapping between Postcode -> Boundary
- Also doesn't help that ESRI's API's have been broken recently....
However... we do get towns and administrative boundaries... from something called the "Gazetter"
if not Path('data/gztr').exists():
gztr_json=requests.get("http://osni-spatial-ni.opendata.arcgis.com/datasets/117e5c3d0f0b41208d1caec1ddbd1330_1.geojson").json()
gztr = gp.GeoDataFrame.from_features(gztr_json).set_index('OBJECTID')
gztr['PLACENAME'] = gztr['PLACENAME'].str.lower()
gztr.to_file('data/gztr')
gztr = gp.read_file('data/gztr')
gztr.head()
| PLACENAME | X | Y | geometry | |
|---|---|---|---|---|
| 0 | acton | 305600 | 341200 | POINT (-6.378357832885347 54.30866006639004) |
| 1 | aghadowey | 285900 | 420900 | POINT (-6.657508075752721 55.02810109314576) |
| 2 | aghalee | 312300 | 365000 | POINT (-6.266475501088042 54.52093954801902) |
| 3 | agivey | 289900 | 422900 | POINT (-6.594350521151068 55.04535455095262) |
| 4 | ahoghill | 305000 | 401700 | POINT (-6.365968303625221 54.8520449124516) |
gztr.plot()
<matplotlib.axes._subplots.AxesSubplot at 0x7fe9549dd3c8>

And we have a base map...
base_map_zip="http://osni-spatial-ni.opendata.arcgis.com/datasets/d9dfdaf77847401e81efc9471dcd09e1_0.zip"
base_map_shp = "OSNI_Open_Data_Largescale_Boundaries__NI_Outline.shp"
if not Path('data/'+base_map_shp).exists():
urllib.request.urlretrieve(base_map_zip, 'data/_tmp.zip')
with zipfile.ZipFile('data/_tmp.zip') as z:
z.extractall('data/')
Path('data/_tmp.zip').unlink()
base_map=gp.GeoDataFrame.from_file('data/'+base_map_shp)
f,ax = plt.subplots(figsize=graph_figsize)
base_map.plot(ax=ax, color='gray')
gztr.plot(ax=ax, color='b')
<matplotlib.axes._subplots.AxesSubplot at 0x7fe9086ebfd0>

from scipy.stats import mode
school_towns = reference.minor_xs('town').mode(axis=1)[0].value_counts()
school_towns
belfast 44 enniskillen 16 londonderry 14 newry 14 ballymena 12 coleraine 9 omagh 8 dungannon 8 craigavon 7 newtownabbey 7 armagh 7 magherafelt 6 lisburn 6 newtownards 5 downpatrick 5 carrickfergus 5 portadown 4 banbridge 4 strabane 4 bangor 4 ballynahinch 3 limavady 3 ballymoney 3 larne 3 ballycastle 2 antrim 2 lurgan 2 holywood 2 cookstown 2 ballyclare 2 castlederg 2 belleek 1 portstewart 1 fivemiletown 1 portglenone 1 dromore 1 aughnacloy 1 newcastle 1 keady 1 castlewellan 1 randalstown 1 kilkeel 1 maghera 1 crumlin 1 dungiven 1 saintfield 1 carrowdore 1 tandragee 1 bushmills 1 crossgar 1 Name: 0, dtype: int64
school_towns_gp = gztr[gztr['PLACENAME'].isin(school_towns.keys())].set_index('PLACENAME')
school_towns_gp.head()
| X | Y | geometry | |
|---|---|---|---|
| PLACENAME | |||
| antrim | 315300 | 387000 | POINT (-6.211523867240925 54.71779842118471) |
| armagh | 287600 | 345500 | POINT (-6.653546587557944 54.35067926584342) |
| aughnacloy | 266500 | 352300 | POINT (-6.976457676904118 54.41494128620327) |
| ballycastle | 311500 | 440700 | POINT (-6.249617934408202 55.20079525328168) |
| ballyclare | 328700 | 391200 | POINT (-6.001860148320316 54.75225829672591) |
school_towns_gp['school_count'] = school_towns.astype(float)
school_towns_gp.head()
| X | Y | geometry | school_count | |
|---|---|---|---|---|
| PLACENAME | ||||
| antrim | 315300 | 387000 | POINT (-6.211523867240925 54.71779842118471) | 2.0 |
| armagh | 287600 | 345500 | POINT (-6.653546587557944 54.35067926584342) | 7.0 |
| aughnacloy | 266500 | 352300 | POINT (-6.976457676904118 54.41494128620327) | 1.0 |
| ballycastle | 311500 | 440700 | POINT (-6.249617934408202 55.20079525328168) | 2.0 |
| ballyclare | 328700 | 391200 | POINT (-6.001860148320316 54.75225829672591) | 2.0 |
f,ax = plt.subplots(figsize=graph_figsize)
base_map.plot(ax=ax, color='gray')
school_towns_gp.plot(ax=ax, column='school_count', legend=True)
<matplotlib.axes._subplots.AxesSubplot at 0x7fe9084a65c0>

Points aren't really very good for seeing trends though...
Need some regions
cons_map_zip="http://osni-spatial-ni.opendata.arcgis.com/datasets/563dc2ec3d9943428e3fe68966d40deb_3.zip"
cons_map_shp = "OSNI_Open_Data_Largescale_Boundaries__Parliamentary_Constituencies_2008.shp"
if not Path('data/'+cons_map_shp).exists():
urllib.request.urlretrieve(cons_map_zip, 'data/_tmp.zip')
with zipfile.ZipFile('data/_tmp.zip') as z:
z.extractall('data/')
Path('data/_tmp.zip').unlink()
cons_map=gp.GeoDataFrame.from_file('data/'+cons_map_shp)
cons_map.rename(columns={'PC_NAME':'constituency'}, inplace=True)
cons_map.drop(['OBJECTID','PC_ID'], axis=1, inplace=True)
cons_map['constituency'] = cons_map['constituency'].str.lower().str.strip()
cons_map.set_index('constituency', inplace=True)
cons_map.head()
| Area_sqkm | geometry | |
|---|---|---|
| constituency | ||
| north down | 115.440659 | (POLYGON ((-5.535202262588358 54.6429094127538... |
| upper bann | 479.692420 | POLYGON ((-6.272362541809057 54.53315266491968... |
| east antrim | 593.040484 | (POLYGON ((-5.821518715277645 54.8754462316150... |
| north antrim | 1386.235791 | (POLYGON ((-6.429871651099131 55.2386720274860... |
| south down | 1249.820808 | (POLYGON ((-6.079447038790904 54.0473674415929... |
f,ax = plt.subplots(figsize=graph_figsize)
cons_map.plot(ax=ax)
cons_map.apply(lambda x: ax.annotate(x.name,
xy=x.geometry.centroid.coords[0],
ha='center'),
axis=1);

reference.minor_xs('parliamentary constituency').head()
| 2009 | 2010 | 2011 | 2012 | 2013 | 2014 | 2015 | 2016 | 2017 | 2018 | |
|---|---|---|---|---|---|---|---|---|---|---|
| de ref | ||||||||||
| 1210014 | belfast east | belfast east | belfast east | belfast east | belfast east | belfast east | belfast east | belfast east | belfast east | belfast east |
| 1210015 | belfast east | belfast east | belfast east | belfast east | belfast east | belfast east | belfast east | belfast east | belfast east | belfast east |
| 1210021 | belfast north | belfast north | belfast north | belfast north | belfast north | belfast north | belfast north | belfast north | belfast north | belfast north |
| 1210022 | belfast north | belfast north | belfast north | belfast north | belfast north | belfast north | belfast north | belfast north | belfast north | belfast north |
| 1210266 | belfast east | belfast east | belfast east | belfast east | belfast east | NaN | NaN | NaN | NaN | NaN |
cons = set(reference.minor_xs('parliamentary constituency').values.ravel('k'))
en_df= pd.DataFrame.from_dict({
con:
enrolment[:,reference.major_axis[(reference.minor_xs('parliamentary constituency')==con).any(axis=1)],:].sum().sum()
for con in cons
}).T.drop(np.nan)
av_df= pd.DataFrame.from_dict({
con:
available[:,reference.major_axis[(reference.minor_xs('parliamentary constituency')==con).any(axis=1)],'available places'].sum()
for con in cons
}).T.drop(np.nan)
cons_stats = gp.GeoDataFrame(geometry=cons_map.geometry)
for c in av_df:
cons_stats[f"av_{c}"] = av_df[c]
cons_stats[f"av_{c}_rat"] = (av_df[c]/en_df[c])
for c in en_df:
cons_stats[f"en_{c}"] = en_df[c]
cons_stats[f"en_{c}_pk"] = en_df[c]/cons_map["Area_sqkm"]
cons_stats.head()
| geometry | av_2010 | av_2010_rat | av_2011 | av_2011_rat | av_2012 | av_2012_rat | av_2013 | av_2013_rat | av_2014 | ... | en_2014 | en_2014_pk | en_2015 | en_2015_pk | en_2016 | en_2016_pk | en_2017 | en_2017_pk | en_2018 | en_2018_pk | |
|---|---|---|---|---|---|---|---|---|---|---|---|---|---|---|---|---|---|---|---|---|---|
| constituency | |||||||||||||||||||||
| north down | (POLYGON ((-5.535202262588358 54.6429094127538... | 76.0 | 0.013831 | 70.0 | 0.012572 | 83.0 | 0.014877 | 49.0 | 0.008807 | 67.0 | ... | 5602.0 | 48.527096 | 5675.0 | 49.159456 | 5703.0 | 49.402005 | 5759.0 | 49.887102 | 5940.0 | 51.455008 |
| upper bann | POLYGON ((-6.272362541809057 54.53315266491968... | 1837.0 | 0.180772 | 2129.0 | 0.211967 | 2308.0 | 0.232967 | 2457.0 | 0.252466 | 2624.0 | ... | 9589.0 | 19.989893 | 8147.0 | 16.983800 | 9602.0 | 20.016993 | 9808.0 | 20.446435 | 10203.0 | 21.269880 |
| east antrim | (POLYGON ((-5.821518715277645 54.8754462316150... | 664.0 | 0.101158 | 739.0 | 0.113762 | 855.0 | 0.133406 | 999.0 | 0.160844 | 1085.0 | ... | 6141.0 | 10.355111 | 6217.0 | 10.483264 | 6245.0 | 10.530478 | 6293.0 | 10.611417 | 6364.0 | 10.731139 |
| north antrim | (POLYGON ((-6.429871651099131 55.2386720274860... | 994.0 | 0.105163 | 1094.0 | 0.116321 | 1217.0 | 0.129097 | 1263.0 | 0.135399 | 1003.0 | ... | 9313.0 | 6.718193 | 9163.0 | 6.609987 | 9140.0 | 6.593395 | 9126.0 | 6.583296 | 9148.0 | 6.599166 |
| south down | (POLYGON ((-6.079447038790904 54.0473674415929... | 1378.0 | 0.120803 | 1577.0 | 0.140841 | 1693.0 | 0.151989 | 1857.0 | 0.169095 | 2037.0 | ... | 10782.0 | 8.626837 | 10684.0 | 8.548425 | 10519.0 | 8.416407 | 10504.0 | 8.404405 | 10724.0 | 8.580430 |
5 rows × 39 columns
f,ax = plt.subplots(figsize=graph_figsize)
ax.set_title("Per Constituency Total Enrolments [2017]")
cons_stats.plot(column='en_2017',ax=ax, legend=True)
cons_stats.apply(lambda x:
ax.annotate(x.name,
xy=x.geometry.centroid.coords[0],
ha='center',
color='#eeeeee',
fontsize=50*x.geometry.area
),
axis=1);

def annotate_cons(x, ax=ax):
ax.annotate(x.name,
xy=x.geometry.centroid.coords[0],
ha='center',
color='#eeeeee',
fontsize=50*x.geometry.area
)
f,ax = plt.subplots(figsize=graph_figsize)
ax.set_title("Per Constituency Total Enrolments per $km^2$[2017]")
cons_stats.plot(column='en_2017_pk',ax=ax, legend=True)
cons_stats.apply(annotate_cons, ax=ax, axis=1);

cons_stats["en_2017_pk"].sort_values(ascending=False)
constituency belfast south 204.103113 belfast north 188.638143 belfast west 168.999917 belfast east 142.627717 foyle 50.799751 north down 49.887102 upper bann 20.446435 lagan valley 11.912162 newry and armagh 11.243427 strangford 10.671039 east antrim 10.611417 south down 8.404405 south antrim 7.097824 north antrim 6.583296 mid ulster 6.462817 east londonderry 5.307115 fermanagh and south tyrone 3.857524 west tyrone 3.768899 Name: en_2017_pk, dtype: float64
But what does it all mean
Gather data from other sources to put things in context;
How many people are in each region?

if not Path('data/cons_pop.csv').exists():
for dataset in odni.action.package_show(id='population-estimates-for-northern-ireland')['resources']:
if dataset['name'] == "Parliamentary Constituencies by single year of age and gender (mid-2001 to mid-2018)":
cons_pop = pd.read_csv(dataset['url'])
cons_pop.to_csv("data/cons_pop.csv", index=False)
cons_pop.head()
cons_pop = pd.read_csv('data/cons_pop.csv')
cons_pop['Mid_Year_Ending'] = cons_pop.Mid_Year_Ending.astype(int)
cons_pop['Population_Estimate'] = cons_pop.Population_Estimate.astype(float)
cons_pop['Age'] = cons_pop.Age.astype(int)
cons_pop.rename(columns={'Geo_Name':'constituency'}, inplace=True)
cons_pop['constituency']= cons_pop.constituency.str.strip().str.lower()
cons_pop.head()
| constituency | Geo_Code | Mid_Year_Ending | Gender | Age | Population_Estimate | |
|---|---|---|---|---|---|---|
| 0 | belfast east | N06000001 | 2001 | All persons | 0 | 827.0 |
| 1 | belfast east | N06000001 | 2001 | All persons | 1 | 1045.0 |
| 2 | belfast east | N06000001 | 2001 | All persons | 2 | 1159.0 |
| 3 | belfast east | N06000001 | 2001 | All persons | 3 | 1032.0 |
| 4 | belfast east | N06000001 | 2001 | All persons | 4 | 1106.0 |
cons_pop[(cons_pop.Gender == 'All persons') & (cons_pop.Mid_Year_Ending == 2018)].head()
| constituency | Geo_Code | Mid_Year_Ending | Gender | Age | Population_Estimate | |
|---|---|---|---|---|---|---|
| 4641 | belfast east | N06000001 | 2018 | All persons | 0 | 1176.0 |
| 4642 | belfast east | N06000001 | 2018 | All persons | 1 | 1172.0 |
| 4643 | belfast east | N06000001 | 2018 | All persons | 2 | 1164.0 |
| 4644 | belfast east | N06000001 | 2018 | All persons | 3 | 1168.0 |
| 4645 | belfast east | N06000001 | 2018 | All persons | 4 | 1214.0 |
What's the distribution of ages in NI?
f,ax = plt.subplots(figsize=graph_figsize)
ax.set_title('Population Distribution (2018)')
cons_pop[(cons_pop.Gender == 'All persons') & (cons_pop.Mid_Year_Ending == 2018)]\
.groupby('Age')['Population_Estimate'].sum().plot.line(ax=ax)
<matplotlib.axes._subplots.AxesSubplot at 0x7fe9205df128>

Constituency breakdown
f,ax = plt.subplots(figsize=graph_figsize)
ax.set_title('Constituency Population Distribution (2018)')
cons_pop[(cons_pop.Gender == 'All persons') & (cons_pop.Mid_Year_Ending == 2018)]\
.groupby(['Age','constituency'])['Population_Estimate'].sum().unstack().plot.bar(stacked=True, ax=ax)
<matplotlib.axes._subplots.AxesSubplot at 0x7fe9394de2e8>

That's not a great way of summarising age distributions....
def idxquantile(s, q=0.5, *args, **kwargs):
qv = s.quantile(q, *args, **kwargs)
return (s.sort_values()[::-1] <= qv).idxmax()
f,ax = plt.subplots(figsize=graph_figsize)
ax.set_title('Cumulative Population Distribution (2018)')
pop_cumsum = cons_pop[(cons_pop.Gender == 'All persons') & (cons_pop.Mid_Year_Ending == 2018)]\
.groupby('Age')['Population_Estimate'].sum().cumsum()
pop_cumsum.plot(ax=ax)
age_quartiles = [idxquantile(pop_cumsum, q) for q in [0.25,0.5,0.75]]
ax.vlines(age_quartiles, ymin=pop_cumsum.min(), ymax = pop_cumsum[age_quartiles])
age_quartiles
[22, 45, 67]

f,ax = plt.subplots(figsize=graph_figsize)
ax.set_title('Cumulative Population Distribution (2009-2018)')
yrs=sorted(cons_pop.Mid_Year_Ending.unique())
colors = plt.cm.jet(np.linspace(0,1,len(yrs)))
for yr,c in zip(yrs,colors):
pop_cumsum = cons_pop[(cons_pop.Gender == 'All persons') \
& (cons_pop.Mid_Year_Ending == yr)]\
.groupby('Age')['Population_Estimate'].sum().cumsum()
pop_cumsum.plot(ax=ax, label=yr, c=c)
age_quartiles = [idxquantile(pop_cumsum, q) for q in [0.25,0.5,0.75]]
ax.vlines(age_quartiles, ymin=pop_cumsum.min(), ymax = pop_cumsum[age_quartiles],color=c,alpha=0.2)
ax.legend()
<matplotlib.legend.Legend at 0x7fe941746080>

def constituency_age_profile(constituency=None):
# I have a hunch we might was to do this
# with lists....
if constituency is None:
constituency = cons_pop.constituency.unique()
label = f"Population profile for NI"
elif not isinstance(constituency, list):
label = f"Population profile for {constituency}"
constituency = [constituency]
else:
label = f"Population profile for {constituency}"
f,ax = plt.subplots(figsize=graph_figsize)
yrs=sorted(cons_pop.Mid_Year_Ending.unique())
colors = plt.cm.jet(np.linspace(0,1,len(yrs)))
for yr,c in zip(yrs,colors):
pop_cumsum = cons_pop[(cons_pop.Gender == 'All persons') \
& (cons_pop.constituency.isin(constituency))\
& (cons_pop.Mid_Year_Ending == yr)]\
.groupby('Age')['Population_Estimate'].sum().cumsum()
pop_cumsum.plot(ax=ax, label=yr, c=c)
age_quartiles = [idxquantile(pop_cumsum, q) for q in [0.25,0.5,0.75]]
ax.vlines(age_quartiles, ymin=pop_cumsum.min(), ymax = pop_cumsum[age_quartiles],color=c,alpha=0.2)
for i,age in enumerate(age_quartiles):
ax.annotate(f"<={age}", xy=(age, i))
ax.legend()
ax.set_title(label)
South Belfast: Kinky Constituency
constituency_age_profile('belfast south')

Newry and Armagh: Middle Age Mourneing
constituency_age_profile('newry and armagh')

Foyled Again: Cross-generational Brain Drain
constituency_age_profile('foyle')

North Antrim: 40 is the new 30
constituency_age_profile('north antrim')

Growing Up in the (Lagan) Valley
constituency_age_profile('lagan valley')

Fast times at Belfast Unis/Colleges
df = cons_pop[(cons_pop.Gender == 'All persons') \
& (cons_pop.Mid_Year_Ending == 2018)]\
.groupby(['Age','constituency'])['Population_Estimate'].sum().unstack()
df.iplot()
f,ax = plt.subplots(figsize=graph_figsize)
sns.heatmap(df.T, ax=ax)
<matplotlib.axes._subplots.AxesSubplot at 0x7fe932774ba8>

def colnorm(df):
return (df-df.min())/(df.max()-df.min())
colnorm(df).iplot()
f,ax = plt.subplots(figsize=graph_figsize)
sns.heatmap(colnorm(df).T, ax=ax)
<matplotlib.axes._subplots.AxesSubplot at 0x7fe910a4ffd0>

def year_age_profile(yr=2016):
constituencies = list(cons_pop.groupby("constituency")['Population_Estimate'].sum().sort_values(ascending=True).keys())
label = f"Population profile for NI in {yr}"
f,ax = plt.subplots(figsize=graph_figsize)
colors = plt.cm.jet(np.linspace(0,1,len(constituencies)))
for constituency,c in zip(constituencies,colors):
pop_cumsum = cons_pop[(cons_pop.Gender == 'All persons') \
& (cons_pop.constituency==constituency)\
& (cons_pop.Mid_Year_Ending == yr)]\
.groupby('Age')['Population_Estimate'].sum().cumsum()
pop_cumsum.plot(ax=ax, label=constituency, c=c)
age_quartiles = [idxquantile(pop_cumsum, q) for q in [0.25,0.5,0.75]]
ax.vlines(age_quartiles, ymin=pop_cumsum.min(), ymax = pop_cumsum[age_quartiles],color=c,alpha=0.2)
ax.legend()
ax.set_title(label)
year_age_profile()

cons_pop_qilted=pd.DataFrame.from_dict(
{
qtile:cons_pop[(cons_pop.Gender == 'All persons') \
& (cons_pop.Mid_Year_Ending == 2018) \
& (lotile<cons_pop.Age) &(cons_pop.Age<=qtile)
].groupby('constituency')['Population_Estimate'].sum()
for lotile, qtile in zip([-1]+age_quartiles, age_quartiles+[90])
}
)
cons_pop_qilted.idxmax(axis=1).sort_values()
constituency west tyrone 22 south down 22 south antrim 22 belfast west 22 east londonderry 22 fermanagh and south tyrone 22 foyle 22 newry and armagh 22 mid ulster 22 north antrim 45 belfast east 45 belfast south 45 belfast north 45 upper bann 45 lagan valley 45 east antrim 67 north down 67 strangford 67 dtype: int64
pop_years = cons_pop.Mid_Year_Ending.unique()
for c in en_df:
if c not in pop_years:
yr = pop_years[np.abs(pop_years-c).argmin()]
else:
yr=c
_cons_pop = cons_pop[(cons_pop.Gender != 'All persons') \
& (cons_pop.Mid_Year_Ending == yr) \
].groupby(['constituency', 'Gender'])['Population_Estimate'].sum().unstack().rename(columns=lambda c: c.lower())
_cons_pop['total'] = _cons_pop.sum(axis=1)
_cons_pop['m_per_f'] = _cons_pop['males']/_cons_pop['females']
cons_pop_qilted=pd.DataFrame.from_dict(
{
qtile:cons_pop[(cons_pop.Gender == 'All persons') \
& (cons_pop.Mid_Year_Ending == yr) \
& (lotile<cons_pop.Age) &(cons_pop.Age<=qtile)
].groupby('constituency')['Population_Estimate'].sum()
for lotile, qtile in zip([-1]+age_quartiles, age_quartiles+[90])
}
)
cons_stats[f"pop_{c}"] = _cons_pop['total']
cons_stats[f"pop_{c}_males"] = _cons_pop['males']
cons_stats[f"pop_{c}_females"] = _cons_pop['females']
cons_stats[f"pop_{c}_m_per_f"] = _cons_pop['m_per_f']
cons_stats[f"topqt_{c}"]=cons_pop_qilted.idxmax(axis=1)
cons_stats[f"en_{c}_pc"]=cons_stats[f"en_{c}"]/cons_pop_qilted.sum(axis=1)
cons_pop_mean=cons_pop[(cons_pop.Gender.isin(["All persons"])) & (cons_pop.Mid_Year_Ending == yr)]
cons_pop_mean['popprod'] = cons_pop_mean[['Age','Population_Estimate']].product(axis=1)
cons_pop_mean=cons_pop_mean.groupby('constituency')[['popprod','Population_Estimate']].sum(axis=0)
cons_stats[f'age_{c}_avg'] = cons_pop_mean['popprod']/cons_pop_mean['Population_Estimate']
try:
cons_stats[f"av_{c}_pc"]=cons_stats[f"av_{c}"]/cons_pop_qilted.sum(axis=1)
except:
print(f"No data for av in {c}")
No data for av in 2009
Average Age
f,ax = plt.subplots(figsize=graph_figsize)
cons_stats.plot(column='age_2018_avg', legend=True, ax=ax)
<matplotlib.axes._subplots.AxesSubplot at 0x7fe95570c780>

Top Quartile
Who rules the roost
f,ax = plt.subplots(figsize=graph_figsize)
cons_stats.plot(column='topqt_2018', legend=True, ax=ax)
<matplotlib.axes._subplots.AxesSubplot at 0x7fe9424857f0>

Mars and Venus
f,ax = plt.subplots(figsize=graph_figsize)
cons_stats.plot(column='pop_2018_m_per_f', legend=True, ax=ax)
<matplotlib.axes._subplots.AxesSubplot at 0x7fe932ae0588>

Enroled Pupils per Capita
Lagan Valley and South Antrim popping up again!
f,ax = plt.subplots(figsize=graph_figsize)
cons_stats.plot(column='en_2018_pc', legend=True, ax=ax)
<matplotlib.axes._subplots.AxesSubplot at 0x7fe900375ac8>

Available Places per Capita
f,ax = plt.subplots(figsize=graph_figsize)
cons_stats.plot(column='av_2018_pc', legend=True, ax=ax)
<matplotlib.axes._subplots.AxesSubplot at 0x7fe93a4e8a90>

Free School Meals
fsm_df= pd.DataFrame.from_dict({
con:
fsm[:,reference.major_axis[(reference.minor_xs('parliamentary constituency')==con).any(axis=1)],'fsme'].sum()
for con in cons
}).T.drop(np.nan)
for c in fsm_df:
cons_stats[f"fsm_{c}"] = fsm_df[c]
cons_stats[f"fsm_{c}_rat"] = (fsm_df[c]/en_df[c])
FSM / Enrolled
f,ax = plt.subplots(figsize=graph_figsize)
cons_stats.plot(column='fsm_2018_rat', legend=True, ax=ax)
<matplotlib.axes._subplots.AxesSubplot at 0x7fe93a5254e0>

FSM is (loosly) a young persons problem
unyearify = lambda c:'_'.join([c.split('_')[0]]+c.split('_')[2:])
cons_stats_2018 = cons_stats[[c for c in cons_stats.columns if '2016' in c]].rename(columns=unyearify)
sns.pairplot(data=cons_stats_2018, hue='topqt',
vars=['age_avg','fsm_rat','pop_m_per_f'])
<seaborn.axisgrid.PairGrid at 0x7fe938ae9a90>

"I'm bored, make a GIF!"
cons_stats['en_2018_pk'].sort_values()
constituency west tyrone 3.758358 fermanagh and south tyrone 3.877875 east londonderry 5.060893 north antrim 6.599166 mid ulster 6.663019 south antrim 7.245589 south down 8.580430 east antrim 10.731139 strangford 10.986957 newry and armagh 11.292432 lagan valley 12.121635 upper bann 21.269880 foyle 51.251716 north down 51.455008 belfast east 145.575392 belfast west 171.879339 belfast north 191.678771 belfast south 205.419188 Name: en_2018_pk, dtype: float64
import matplotlib.animation as animation
unyearify = lambda c:'_'.join([c.split('_')[0]]+c.split('_')[2:])
years = list(range(2009,2019))
explanations={
'age_avg': "Average Age",
'av_pc': "Available School Places per capita",
'av_rat': "Ratio of Available Places to Actualised Enrolment",
'av': "Available School Places",
'en_pc': "Enrolled Pupils per capita",
'en_pk': "Enrolled Pupils per $km^2$",
'en': "Enrolled Pupils",
'fsm_rat': "Ratio of FSM pupils to total pupils",
'fsm': "FSM pupils",
'pop': "Population",
'pop_females': "Population (F)",
'pop_males': "Population (M)",
'pop_m_per_f': "Ratio of Males to Females",
'topqt': "Most populous age quartile (Age or younger)"
}
for metric in set(map(unyearify, cons_stats.columns)):
for year in years:
try:
f, ax = plt.subplots(figsize=graph_figsize)
if metric in explanations:
ax.set_title(f"{explanations[metric]}:({year})")
else:
ax.set_title(f"{metric}:({year})")
cons_stats[[c for c in cons_stats.columns if str(year) in c]+['geometry']]\
.rename(columns=unyearify).plot(column=metric, legend=True, ax=ax)
ax.axis('off')
f.tight_layout()
p = Path(f"outputs/{metric}/{year}.png")
p.parent.mkdir(parents=True, exist_ok=True)
f.savefig(p)
plt.close(f)
fps = 12
except:
print(f"{metric}:{year} failed")
finally:
if f:
plt.close(f)
geometry:2009 failed geometry:2010 failed geometry:2011 failed geometry:2012 failed geometry:2013 failed geometry:2014 failed geometry:2015 failed geometry:2016 failed geometry:2017 failed geometry:2018 failed av_pc:2009 failed av_rat:2009 failed av:2009 failed
import moviepy.editor as mpy
import moviepy.video as mpyv
clips = {}
for p in Path('outputs/').iterdir():
if not p.is_dir():
continue
metric = p.parts[-1]
file_list = [str(_p) for _p in sorted(filter(lambda s:s.suffix=='.png', p.iterdir()))]
clip = mpy.ImageSequenceClip(file_list, fps=1.5)
clip = mpyv.fx.all.freeze(clip, t='end', freeze_duration=2)
clip.write_gif(f"outputs/{metric}.gif")
clips[metric]=clip
[MoviePy] Building file outputs/av_pc.gif with imageio
92%|█████████▏| 12/13 [00:00<00:00, 21.65it/s]
[MoviePy] Building file outputs/grampct.gif with imageio
80%|████████ | 4/5 [00:00<00:00, 15.46it/s]
[MoviePy] Building file outputs/pop.gif with imageio
100%|██████████| 14/14 [00:00<00:00, 21.37it/s]
[MoviePy] Building file outputs/pop_males.gif with imageio
100%|██████████| 14/14 [00:00<00:00, 23.06it/s]
[MoviePy] Building file outputs/av.gif with imageio
92%|█████████▏| 12/13 [00:00<00:00, 22.79it/s]
[MoviePy] Building file outputs/en_pk.gif with imageio
100%|██████████| 14/14 [00:00<00:00, 26.26it/s]
[MoviePy] Building file outputs/en_pc.gif with imageio
100%|██████████| 14/14 [00:00<00:00, 22.28it/s]
[MoviePy] Building file outputs/age_avg.gif with imageio
100%|██████████| 14/14 [00:00<00:00, 20.47it/s]
[MoviePy] Building file outputs/pairplot.gif with imageio
92%|█████████▏| 11/12 [00:00<00:00, 13.84it/s]
[MoviePy] Building file outputs/fsm.gif with imageio
100%|██████████| 14/14 [00:00<00:00, 19.28it/s]
[MoviePy] Building file outputs/pop_females.gif with imageio
100%|██████████| 14/14 [00:00<00:00, 20.01it/s]
[MoviePy] Building file outputs/fsm_rat.gif with imageio
100%|██████████| 14/14 [00:00<00:00, 21.72it/s]
[MoviePy] Building file outputs/pop_m_per_f.gif with imageio
100%|██████████| 14/14 [00:00<00:00, 15.34it/s]
[MoviePy] Building file outputs/gram_pct.gif with imageio
80%|████████ | 4/5 [00:00<00:00, 14.93it/s]
[MoviePy] Building file outputs/av_rat.gif with imageio
92%|█████████▏| 12/13 [00:00<00:00, 21.43it/s]
[MoviePy] Building file outputs/en.gif with imageio
100%|██████████| 14/14 [00:00<00:00, 21.62it/s]
[MoviePy] Building file outputs/topqt.gif with imageio
100%|██████████| 14/14 [00:00<00:00, 26.09it/s]
[MoviePy] Building file outputs/gram_rat.gif with imageio
80%|████████ | 4/5 [00:00<00:00, 16.87it/s]
[MoviePy] Building file outputs/Population Distribution.gif with imageio
92%|█████████▏| 12/13 [00:00<00:00, 22.25it/s]
[MoviePy] Building file outputs/Population Distribution _normed_.gif with imageio
92%|█████████▏| 12/13 [00:00<00:00, 19.60it/s]
We're getting older, or at least living longer

But younger people are taking over the west

💕 Go West for Men, or West Belfast for Women 💕
10% fewer men than women in West Belfast, ~2% more men than women out west

Free School Meals are rising with population

But the divide is getting wider per capita

There aren't necessarily fewer available school places either...
There just aren't any where people want to send their kids...
Could possibly indicate over-provisioning in yellow areas...

Population distribution isn't really changing at all

And as such, noones sending their kids anywhere differently despite closures...

Population Distribution Shifts
metric='Population Distribution'
for year in years:
try:
f, ax = plt.subplots(figsize=graph_figsize)
if metric in explanations:
ax.set_title(f"{explanations[metric]}:({year})")
else:
ax.set_title(f"{metric}:({year})")
df = cons_pop[(cons_pop.Gender == 'All persons') \
& (cons_pop.Mid_Year_Ending == year)]\
.groupby(['Age','constituency'])['Population_Estimate']\
.sum().unstack()
sns.heatmap(df.T, ax=ax)
f.tight_layout()
p = Path(f"outputs/{metric}/{year}.png")
p.parent.mkdir(parents=True, exist_ok=True)
f.savefig(p)
plt.close(f)
fps = 12
except:
print(f"{metric}:{year} failed")
finally:
if f:
plt.close(f)
metric='Population Distribution _normed_'
for year in years:
try:
f, ax = plt.subplots(figsize=graph_figsize)
if metric in explanations:
ax.set_title(f"{explanations[metric]}:({year})")
else:
ax.set_title(f"{metric}:({year})")
df = cons_pop[(cons_pop.Gender == 'All persons') \
& (cons_pop.Mid_Year_Ending == year)]\
.groupby(['Age','constituency'])['Population_Estimate']\
.sum().unstack()
sns.heatmap(colnorm(df.T), ax=ax)
f.tight_layout()
p = Path(f"outputs/{metric}/{year}.png")
p.parent.mkdir(parents=True, exist_ok=True)
f.savefig(p)
plt.close(f)
fps = 12
except:
print(f"{metric}:{year} failed")
finally:
if f:
plt.close(f)
clips = {}
for p in Path('outputs/').iterdir():
if not p.is_dir():
continue
metric = p.parts[-1]
file_list = [str(_p) for _p in sorted(filter(lambda s:s.suffix=='.png', p.iterdir()))]
clip = mpy.ImageSequenceClip(file_list, fps=1.5)
clip = mpyv.fx.all.freeze(clip, t='end', freeze_duration=2)
clip.write_gif(f"outputs/{metric}.gif")
clips[metric]=clip
[MoviePy] Building file outputs/av_pc.gif with imageio
92%|█████████▏| 12/13 [00:00<00:00, 23.21it/s]
[MoviePy] Building file outputs/grampct.gif with imageio
80%|████████ | 4/5 [00:00<00:00, 15.65it/s]
[MoviePy] Building file outputs/pop.gif with imageio
100%|██████████| 14/14 [00:00<00:00, 23.14it/s]
[MoviePy] Building file outputs/pop_males.gif with imageio
100%|██████████| 14/14 [00:00<00:00, 23.98it/s]
[MoviePy] Building file outputs/av.gif with imageio
92%|█████████▏| 12/13 [00:00<00:00, 22.89it/s]
[MoviePy] Building file outputs/en_pk.gif with imageio
100%|██████████| 14/14 [00:00<00:00, 23.46it/s]
[MoviePy] Building file outputs/en_pc.gif with imageio
100%|██████████| 14/14 [00:00<00:00, 20.55it/s]
[MoviePy] Building file outputs/age_avg.gif with imageio
100%|██████████| 14/14 [00:00<00:00, 19.87it/s]
[MoviePy] Building file outputs/pairplot.gif with imageio
92%|█████████▏| 11/12 [00:00<00:00, 13.56it/s]
[MoviePy] Building file outputs/fsm.gif with imageio
100%|██████████| 14/14 [00:00<00:00, 22.23it/s]
[MoviePy] Building file outputs/pop_females.gif with imageio
100%|██████████| 14/14 [00:00<00:00, 21.60it/s]
[MoviePy] Building file outputs/fsm_rat.gif with imageio
100%|██████████| 14/14 [00:00<00:00, 24.76it/s]
[MoviePy] Building file outputs/pop_m_per_f.gif with imageio
100%|██████████| 14/14 [00:00<00:00, 21.88it/s]
[MoviePy] Building file outputs/gram_pct.gif with imageio
80%|████████ | 4/5 [00:00<00:00, 15.57it/s]
[MoviePy] Building file outputs/av_rat.gif with imageio
92%|█████████▏| 12/13 [00:00<00:00, 21.79it/s]
[MoviePy] Building file outputs/en.gif with imageio
100%|██████████| 14/14 [00:00<00:00, 21.56it/s]
[MoviePy] Building file outputs/topqt.gif with imageio
100%|██████████| 14/14 [00:00<00:00, 20.91it/s]
[MoviePy] Building file outputs/gram_rat.gif with imageio
80%|████████ | 4/5 [00:00<00:00, 14.44it/s]
[MoviePy] Building file outputs/Population Distribution.gif with imageio
100%|██████████| 14/14 [00:00<00:00, 22.45it/s]
[MoviePy] Building file outputs/Population Distribution _normed_.gif with imageio
100%|██████████| 14/14 [00:00<00:00, 21.59it/s]


Conclusions
Hypotheses / conjectures
- East Antrim Constituency is literally 'little britain'
- None wants to go to school in West Belfast for some reason
- Everyone wants to go to school in North Down
- The 'places' scandal is either over blown, or more related to 'preference'
- There is a demographic wave of <11's that is gonna hit education system in 2 years. Good luck.
- South Belfast steals all-the-18-year-olds, keeps em for a decade or so and then the go home
- Foyle has been experiencing a sustained brain drain of < 35's that is now impacting services
Final Comments
- Data is hard
- Open Data is hard without a budget
- 80/20 rule is more like 90/10
Idiots Guide to (Open) Data Science
Andrew Bolster
- bolster.online
- Tweets @bolster
- GitHubs at andrewbolster
- Machine Learning Team Lead at WhiteHatSec
- We're hiring (Placements also available)
- Plays at Farset Labs
- THIS NOTEBOOK IS AT present.bolster.online
- Also available in source at presentgh.bolster.online
NOTES FOR LATER
Fucked Notes:
DoE
- inconsistent file names
- inconsistent extensions
- inconsistent cases in extentions 🤦
- changing schema almost every year
- recent years don't have headers for de ref/school name
- multi row headers
- Changing "All People" to "All persons" silently...
Housing Stock Data
https://www.opendatani.gov.uk/dataset/ni-housing-stock
SEN scaling is complex AF
https://www.education-ni.gov.uk/sites/default/files/publications/de/the-code-of-practice.pdf
~ hundred page doc to work out that 5 is 'confirmed and fully stated special educational needs. Everthing less is 'suspected and in need of advice and support'
"Controlled and Maintained schools have [a budget] for this" "Grant maintained integrated schools also receive this through their annual budget"