Pathfinding
Different ontologies exhibit different degrees of latticeyness. Highly latticed ontologies will have a combinatorial expolosion of paths to a root node.
This notebook has an analysis of path counts for the HPO
In [3]:
## We use a Factory object in the ontobio library
from ontobio import OntologyFactory
In [5]:
## Get the HPO using default method (currently OntoBee SPARQL)
## This may take 5-10s the first time you run it; afterwards it is cached
ofa = OntologyFactory()
ont = ofa.create('hp')
In [9]:
## The OWL version of HPO (used here) has many interesting relationship types;
## for now we just care about is-a (subClassOf between named classes)
ont = ont.subontology(relations='subClassOf')
In [13]:
## Get the root of the abnormality subset
[root] = ont.search('Phenotypic abnormality')
root
Out[13]:
'HP:0000118'
In [15]:
## Arbitrary term
[t] = ont.search('Clinodactyly of the 3rd finger')
t
Out[15]:
'HP:0040024'
In [18]:
## We use the standard python networkx library for pathfinding here
## This is easily extracted from an ontology object
from networkx import nx
G = ont.get_graph()
G
Out[18]:
<networkx.classes.multidigraph.MultiDiGraph at 0x10d7292b0>
Use networkx to find all paths from an arbitrary term
In [21]:
## number of paths
## (for the mapping of networkx to an ontology, source is root, and descendant is target)
len(list(nx.all_simple_paths(G, root, t)))
Out[21]:
17
In [22]:
## nx returns a list of lists, each list is a path
## Examine the first 2
list(nx.all_simple_paths(G, root, t))[0:2]
Out[22]:
[['HP:0000118',
  'HP:0000924',
  'HP:0040068',
  'HP:0002813',
  'HP:0011297',
  'HP:0030084',
  'HP:0040019',
  'HP:0040024'],
 ['HP:0000118',
  'HP:0000924',
  'HP:0040068',
  'HP:0002813',
  'HP:0011297',
  'HP:0001167',
  'HP:0004097',
  'HP:0009317',
  'HP:0040024']]
We (heart) pandas
Pandas are cute.
We use a DataFrame object, which we will construct by making a table of terms plus their pathstats
In [45]:
def get_pathstats(nodes):
    """
    for any given node, return a table row with stats
    """
    items = []
    for n in nodes:
        paths = list(nx.all_simple_paths(G, root, n))
        longest = len(max(paths, key=lambda p: len(p)))
        items.append({'id':n,
                      'label': ont.label(n),
                      'pathcount': len(paths),
                      'longest': longest})
    return items

## Test it out
sample = list(ont.descendants(root))[0:20]
items = get_pathstats(sample)
items[0:3]
Out[45]:
[{'id': 'HP:0005237',
  'label': 'Degenerative liver disease',
  'longest': 5,
  'pathcount': 1},
 {'id': 'HP:0002251',
  'label': 'Aganglionic megacolon',
  'longest': 8,
  'pathcount': 3},
 {'id': 'HP:0005102',
  'label': 'Cochlear degeneration',
  'longest': 6,
  'pathcount': 1}]
In [46]:
## Look at same table in pandas
import pandas as pd
df = pd.DataFrame(items)
df
Out[46]:
| id | label | longest | pathcount | |
|---|---|---|---|---|
| 0 | HP:0005237 | Degenerative liver disease | 5 | 1 |
| 1 | HP:0002251 | Aganglionic megacolon | 8 | 3 |
| 2 | HP:0005102 | Cochlear degeneration | 6 | 1 |
| 3 | HP:0006466 | Ankle contracture | 9 | 6 |
| 4 | HP:0004292 | Undermodelled hand bones | 6 | 1 |
| 5 | HP:0004839 | Pyropoikilocytosis | 7 | 1 |
| 6 | HP:0008970 | Scapulohumeral muscular dystrophy | 5 | 1 |
| 7 | HP:0008573 | Low-frequency sensorineural hearing impairment | 6 | 2 |
| 8 | HP:0005435 | Impaired T cell function | 8 | 3 |
| 9 | HP:0009218 | Fragmentation of the epiphysis of the middle p... | 13 | 96 |
| 10 | HP:0005021 | Bilateral elbow dislocations | 8 | 3 |
| 11 | HP:0010964 | Abnormality of long-chain fatty-acid metabolism | 5 | 1 |
| 12 | HP:0008019 | Superior lens subluxation | 9 | 1 |
| 13 | HP:0030883 | Femoroacetabular Impingement | 8 | 4 |
| 14 | HP:0005303 | Aortic arch calcification | 9 | 5 |
| 15 | HP:0000741 | Apathy | 7 | 1 |
| 16 | HP:0040208 | Elevated CSF biopterin level | 7 | 2 |
| 17 | HP:0030031 | Small toe | 10 | 13 |
| 18 | HP:0025348 | Abnormality of the corneal limbus | 7 | 1 |
| 19 | HP:0100720 | Hypoplasia of the ear cartilage | 5 | 1 |
In [49]:
## Basic aggregate stats (over our small sample, which may not be representative)
df['pathcount'].mean()
Out[49]:
7.3499999999999996
Plotting with plotly
Let's do a simple barchart showing distribution of pathcounts for our sample
In [50]:
import plotly.plotly as py
import plotly.graph_objs as go
In [51]:
data = [
    go.Bar(
        x=df['label'], # assign x as the dataframe column 'x'
        y=df['pathcount']
    )
]

# IPython notebook
py.iplot(data, filename='pandas-bar-chart')

# use this in non-notebook context
# url = py.plot(data, filename='pandas-bar-chart')
Out[51]:
Summarizing over whole ontology
warning this can take over an hour, if running interactively, be patient!
help wanted is there a way to make Jupyter show a progress bar for cases like this?
In [52]:
sample = list(ont.descendants(root))
items = get_pathstats(sample)
items[0:3]
Out[52]:
[{'id': 'HP:0005237',
  'label': 'Degenerative liver disease',
  'longest': 5,
  'pathcount': 1},
 {'id': 'HP:0002251',
  'label': 'Aganglionic megacolon',
  'longest': 8,
  'pathcount': 3},
 {'id': 'HP:0005102',
  'label': 'Cochlear degeneration',
  'longest': 6,
  'pathcount': 1}]
In [53]:
len(items)
Out[53]:
12066
In [54]:
df = pd.DataFrame(items)
In [55]:
df['pathcount'].mean()
Out[55]:
6.6176031824962704
In [56]:
df['pathcount'].max()
Out[56]:
200
Plotting all HP terms
In [57]:
data = [
    go.Bar(
        x=df['label'], # assign x as the dataframe column 'x'
        y=df['pathcount']
    )
]

# IPython notebook
py.iplot(data, filename='pandas-bar-chart-all')
Out[57]:
In [59]:
data = [
    go.Scatter(
        x=df['longest'], # assign x as the dataframe column 'x'
        y=df['pathcount'],
     mode = 'markers'
    )
]

# IPython notebook
py.iplot(data, filename='pandas-longest-vs-numpaths')
Out[59]:
In [61]:
max_num_paths = df['pathcount'].max()
nodes_with_max = [x['id'] for x in items if x['pathcount'] == max_num_paths]
nodes_with_max
Out[61]:
['HP:0100379', 'HP:0010432', 'HP:0010102', 'HP:0100378']
In [62]:
[ont.label(n) for n in nodes_with_max]
Out[62]:
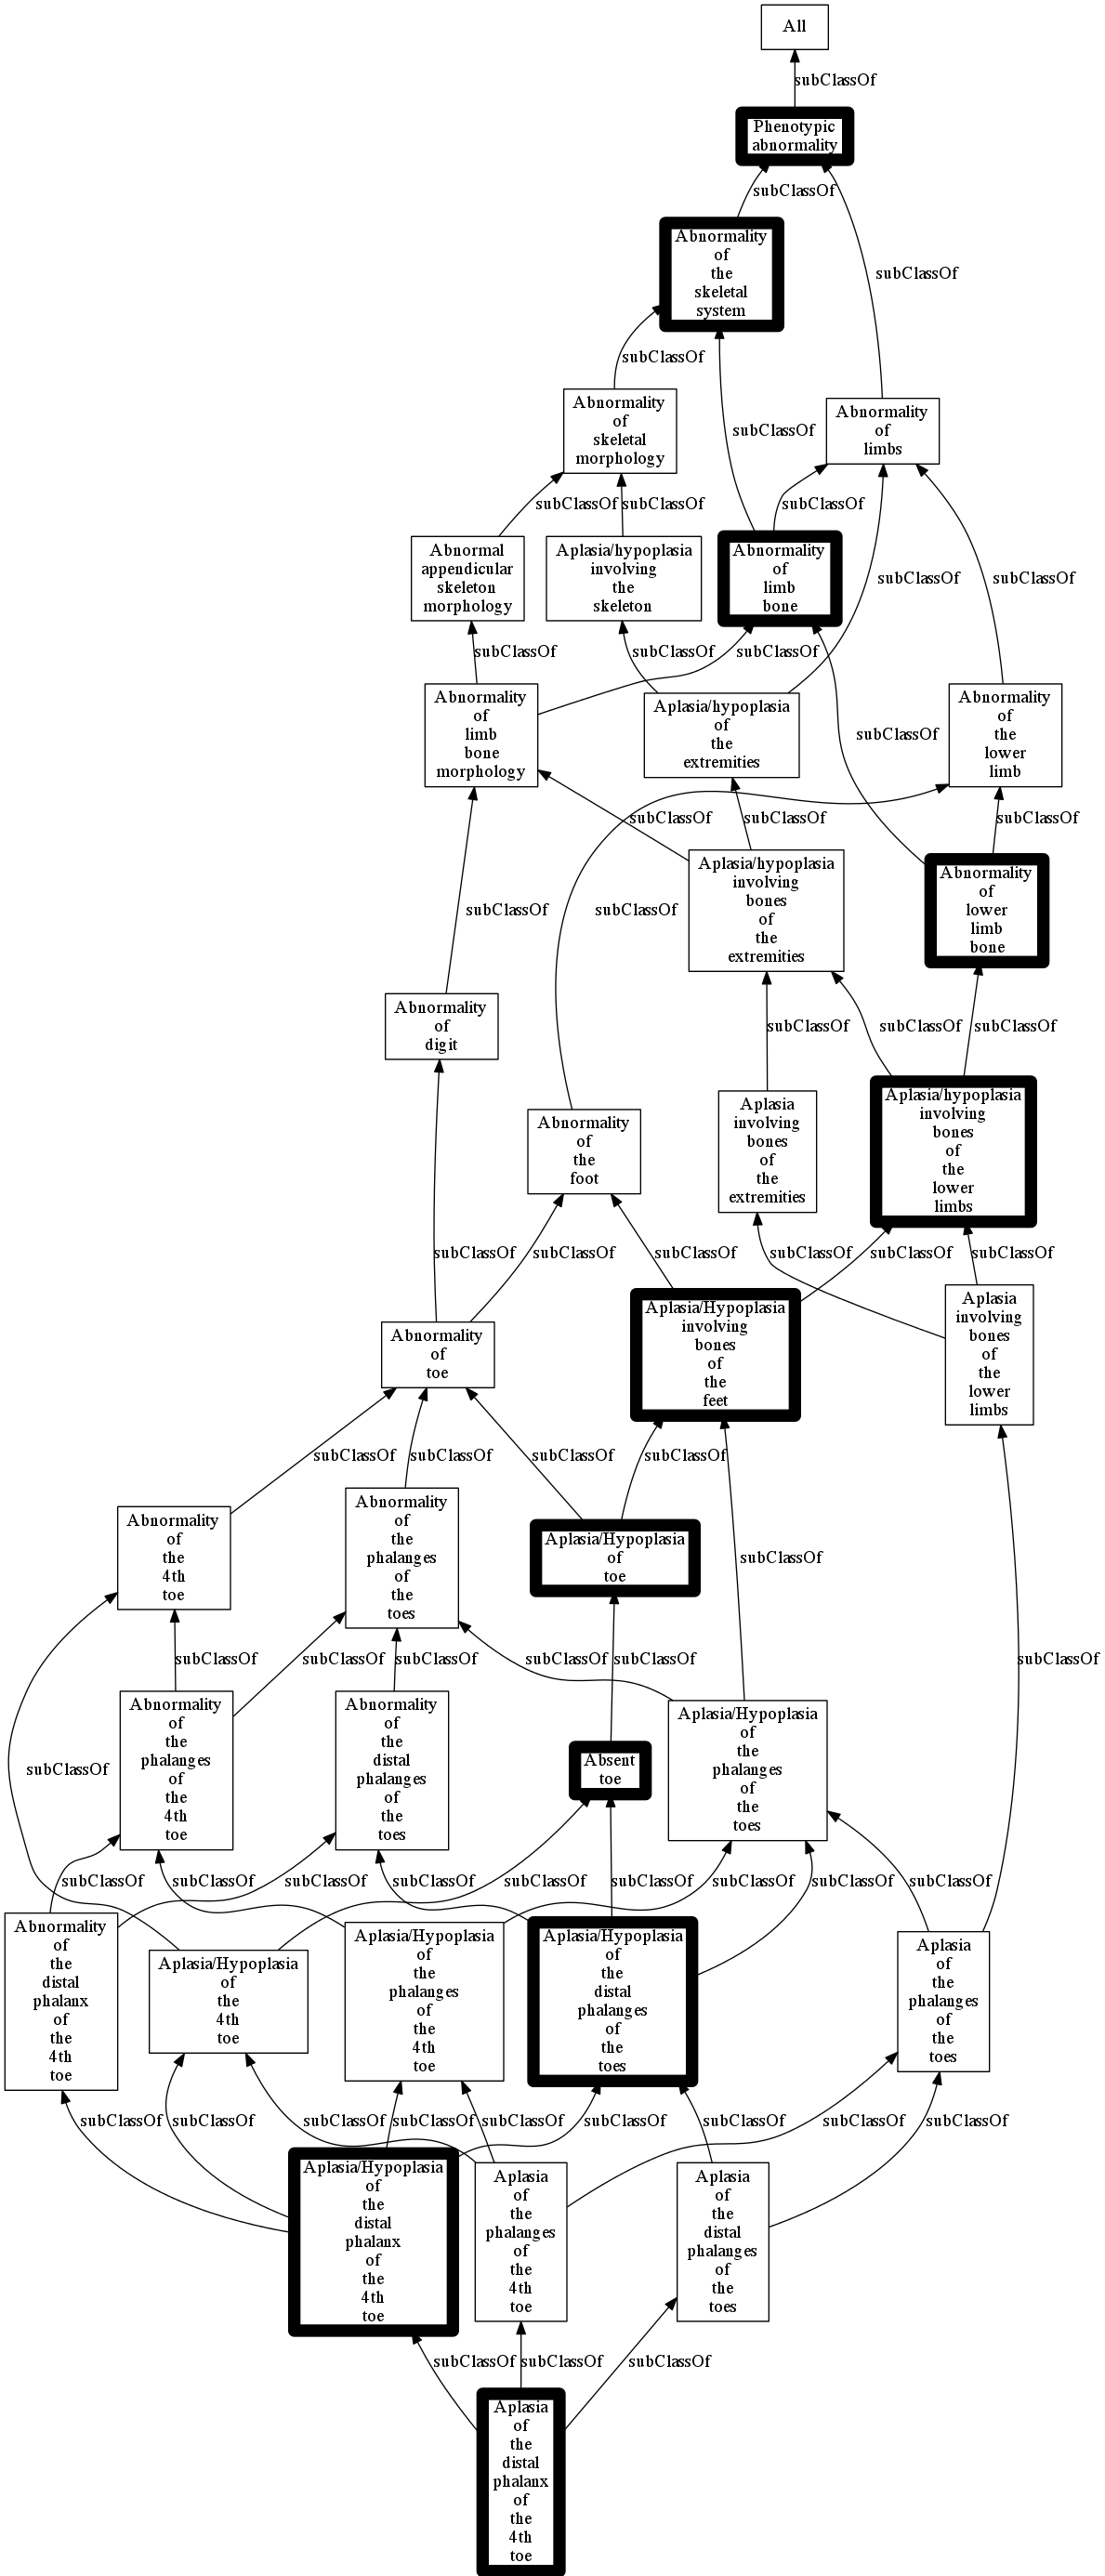
['Aplasia of the distal phalanx of the 4th toe',
 'Absent distal phalanx of the 2nd toe',
 'Aplasia of the distal phalanx of the hallux',
 'Absent distal phalanx of the 3rd toe']
In [70]:
len(nodes_with_max)
Out[70]:
4
In [71]:
## Pick an arbitrary term from list
t = nodes_with_max[0]
In [77]:
ancs = ont.ancestors(t, reflexive=True)
ancs = [a for a in ancs if a.startswith('HP:')]
len(ancs)
Out[77]:
36
In [80]:
## Make a sub-ontology with just term and ancestors
subont = ont.subontology(ancs)
In [83]:
sample_path = list(nx.all_simple_paths(G, root, t))[0]
sample_path
Out[83]:
['HP:0000118',
 'HP:0000924',
 'HP:0040068',
 'HP:0040069',
 'HP:0006493',
 'HP:0006494',
 'HP:0001991',
 'HP:0010760',
 'HP:0010185',
 'HP:0100370',
 'HP:0100379']
In [84]:
## Render the sub-ontology,
## highlighting a sample path
from ontobio.io.ontol_renderers import GraphRenderer
w = GraphRenderer.create('png')
w.outfile = 'output/multipath.png'
w.write(subont,query_ids=sample_path)
In [ ]: