 |
FREYA WP2 User Story 9 | As a bibliometrician, I want to know all the co-authors of a particular researcher, so that I can do a network analysis of the researcher's collaborations. |
|---|---|---|
A number of useful analyses are made possible by identifying co-authorship groups of a given researcher, for example identifying other active scientists in the researcher's field of study, or groups of closely collaborating (and often co-funded) author affiliations.
This notebook uses the DataCite GraphQL API to retrieve all publications of Dr Sarah Teichmann.Goal: By the end of this notebook, for a researcher of interest, you should be able to:
- Display an interactive sankey plot of the researcher's publication co-authors, e.g.

- Download a file containing their publication DOIs;
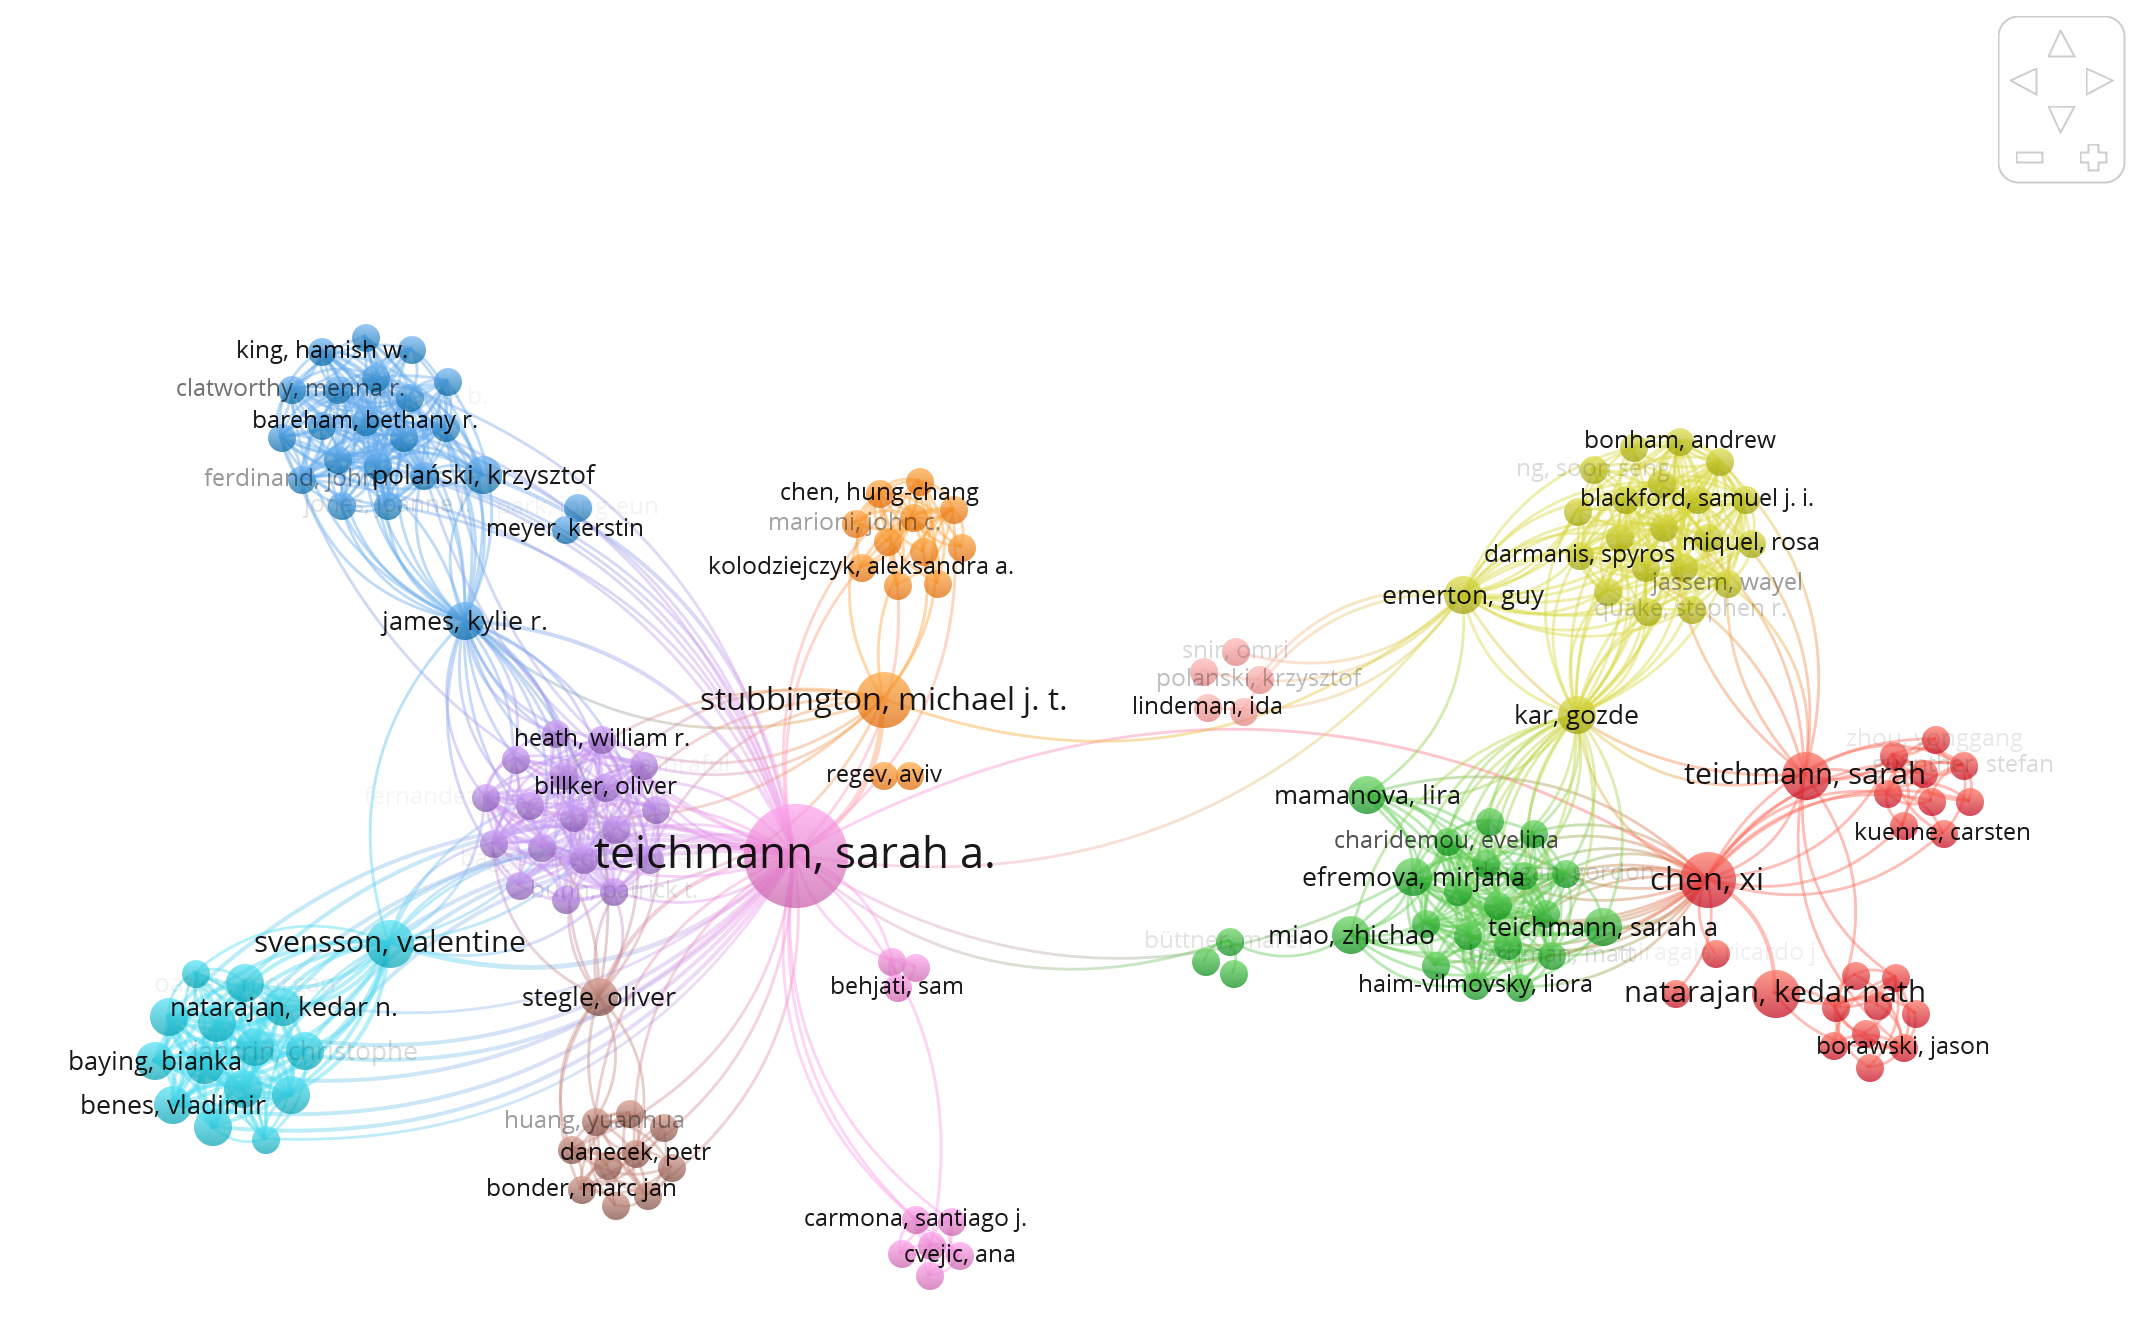
- Load the above file into VOSviewer and then construct and visualise the researcher's co-authorship network, following the steps listed in the notebook, e.g.

Install libraries and prepare GraphQL client
%%capture
# Install required Python packages
!pip install gql requests numpy plotly
# Prepare the GraphQL client
import requests
from IPython.display import display, Markdown
from gql import gql, Client
from gql.transport.requests import RequestsHTTPTransport

_transport = RequestsHTTPTransport(
    url='https://api.datacite.org/graphql',
    use_json=True,
)

client = Client(
    transport=_transport,
    fetch_schema_from_transport=True,
)
Define and run GraphQL query
Define the GraphQL query to find all publications including co-authors for Dr Sarah Teichmann:
# Generate the GraphQL query: find all publications, including co-authors or researcher id: "https://orcid.org/0000-0002-6294-6366"
query_params = {
    "researcherId" : "https://orcid.org/0000-0002-6294-6366",
    "maxWorks" : 300
}

query = gql("""query getResearcherPublication($researcherId: ID!, $maxWorks: Int!)
{
  person(id: $researcherId) {
    id
    name
    publications(first:$maxWorks) {
      totalCount
      published {
        title
        count
      }
      nodes {
        id
        type
        versionOfCount
        titles {
          title
        }
        creators {
          id
          name
        }
      }
    }
  }
}
""")
Run the above query via the GraphQL client
import json
data = client.execute(query, variable_values=json.dumps(query_params))
Display total number of publications by the researcher
Display the total number of the researcher's outputs to date.
# Get the total number of publication to date
publications = data['person']['publications']
display(Markdown(str(publications['totalCount'])))
Plot the researcher's publications co-authors
Display a sankey plot of the co-authors sharing at least two publications with the researcher, highlighting them by frequency of co-authorship.
import plotly.graph_objects as go
import plotly.io as pio
import plotly.express as px
from IPython.display import IFrame

# Retrieve creator names and ORCID ids from all publications
all_creator_ids = []
all_creator_ids_set = set([])
creator_id2name = {}
publications = data['person']['publications']
for r in publications['nodes']:
    if r['versionOfCount'] > 0:
        # If the current output is a version of another one, exclude it
        continue
    creator_ids = list(filter(None, [s['id'] for s in r['creators']]))
    all_creator_ids_set.update(creator_ids)
    all_creator_ids.append(creator_ids)
    for creator in r['creators']:
        if (creator['id'] not in creator_id2name and creator['id'] is not None):
            creator_id2name[creator['id']] = creator['name']

# Collect creator names into all_unique_creator_names - these will be labels in the sankey plot
# Initialise coauthorship_matrix, that will be used to populate lists needed for the sankey plot
all_unique_creator_ids = list(all_creator_ids_set)
length = len(all_unique_creator_ids)
coauthorship_matrix = []
all_unique_creator_names = []
for id in all_unique_creator_ids:
    all_unique_creator_names.append(creator_id2name[id])
    coauthorship_matrix.append([0] * length)

# Populate coauthorship_matrix
for cids in all_creator_ids:
    for cid in cids:
        c_pos = all_unique_creator_ids.index(cid)
        for cid in cids:
            co_pos = all_unique_creator_ids.index(cid)
            if c_pos != co_pos:
                coauthorship_matrix[c_pos][co_pos] += 1

# Use coauthorship_matrix to populate lists needed for the sankey diagram: sourceIndexes, targetIndexes and linkWeights
# For Plotly colour swatches, see: https://plotly.com/python/builtin-colorscales/
colRange = px.colors.sequential.matter;
maxColIndex = len(colRange)
sourceIndexes = []
targetIndexes = []
linkWeights = []
linkColours = []
for c_pos, r in enumerate(coauthorship_matrix):
    # On the left hand side of sankey retain only the researcher in question
    if all_unique_creator_ids[c_pos] != query_params['researcherId']:
        continue
    for co_pos, weight in enumerate(r):
            if coauthorship_matrix[c_pos][co_pos] > 1:
                # Include links to co-authors of at least 2 publications
                sourceIndexes.append(c_pos)
                targetIndexes.append(co_pos)
                linkWeights.append(weight)
                linkColours.append(colRange[min(maxColIndex, weight)])

# Create a sankey plot
fig = go.Figure(data=[go.Sankey(
    node = dict(
      pad = 15,
      thickness = 20,
      line = dict(color = "black", width = 0.5),
      label = all_unique_creator_names,
      color = "rgba(136,65,157, 0.6)"
    ),
    link = dict(
      source = sourceIndexes, # indices correspond to labels in all_unique_creator_names
      target = targetIndexes, # ditto
      value = linkWeights,
      color = linkColours
  ))])

fig.update_layout(title_text="", font_size=10)
# Write interactive plot out to html file
pio.write_html(fig, file='out.html')

# Display plot from the saved html file
display(Markdown("### [%s](%s)'s first degree co-authors:" % (creator_id2name[query_params['researcherId']], query_params['researcherId'])))
IFrame(src="./out.html", width=1000, height=800)
Download a file containing publication DOIs
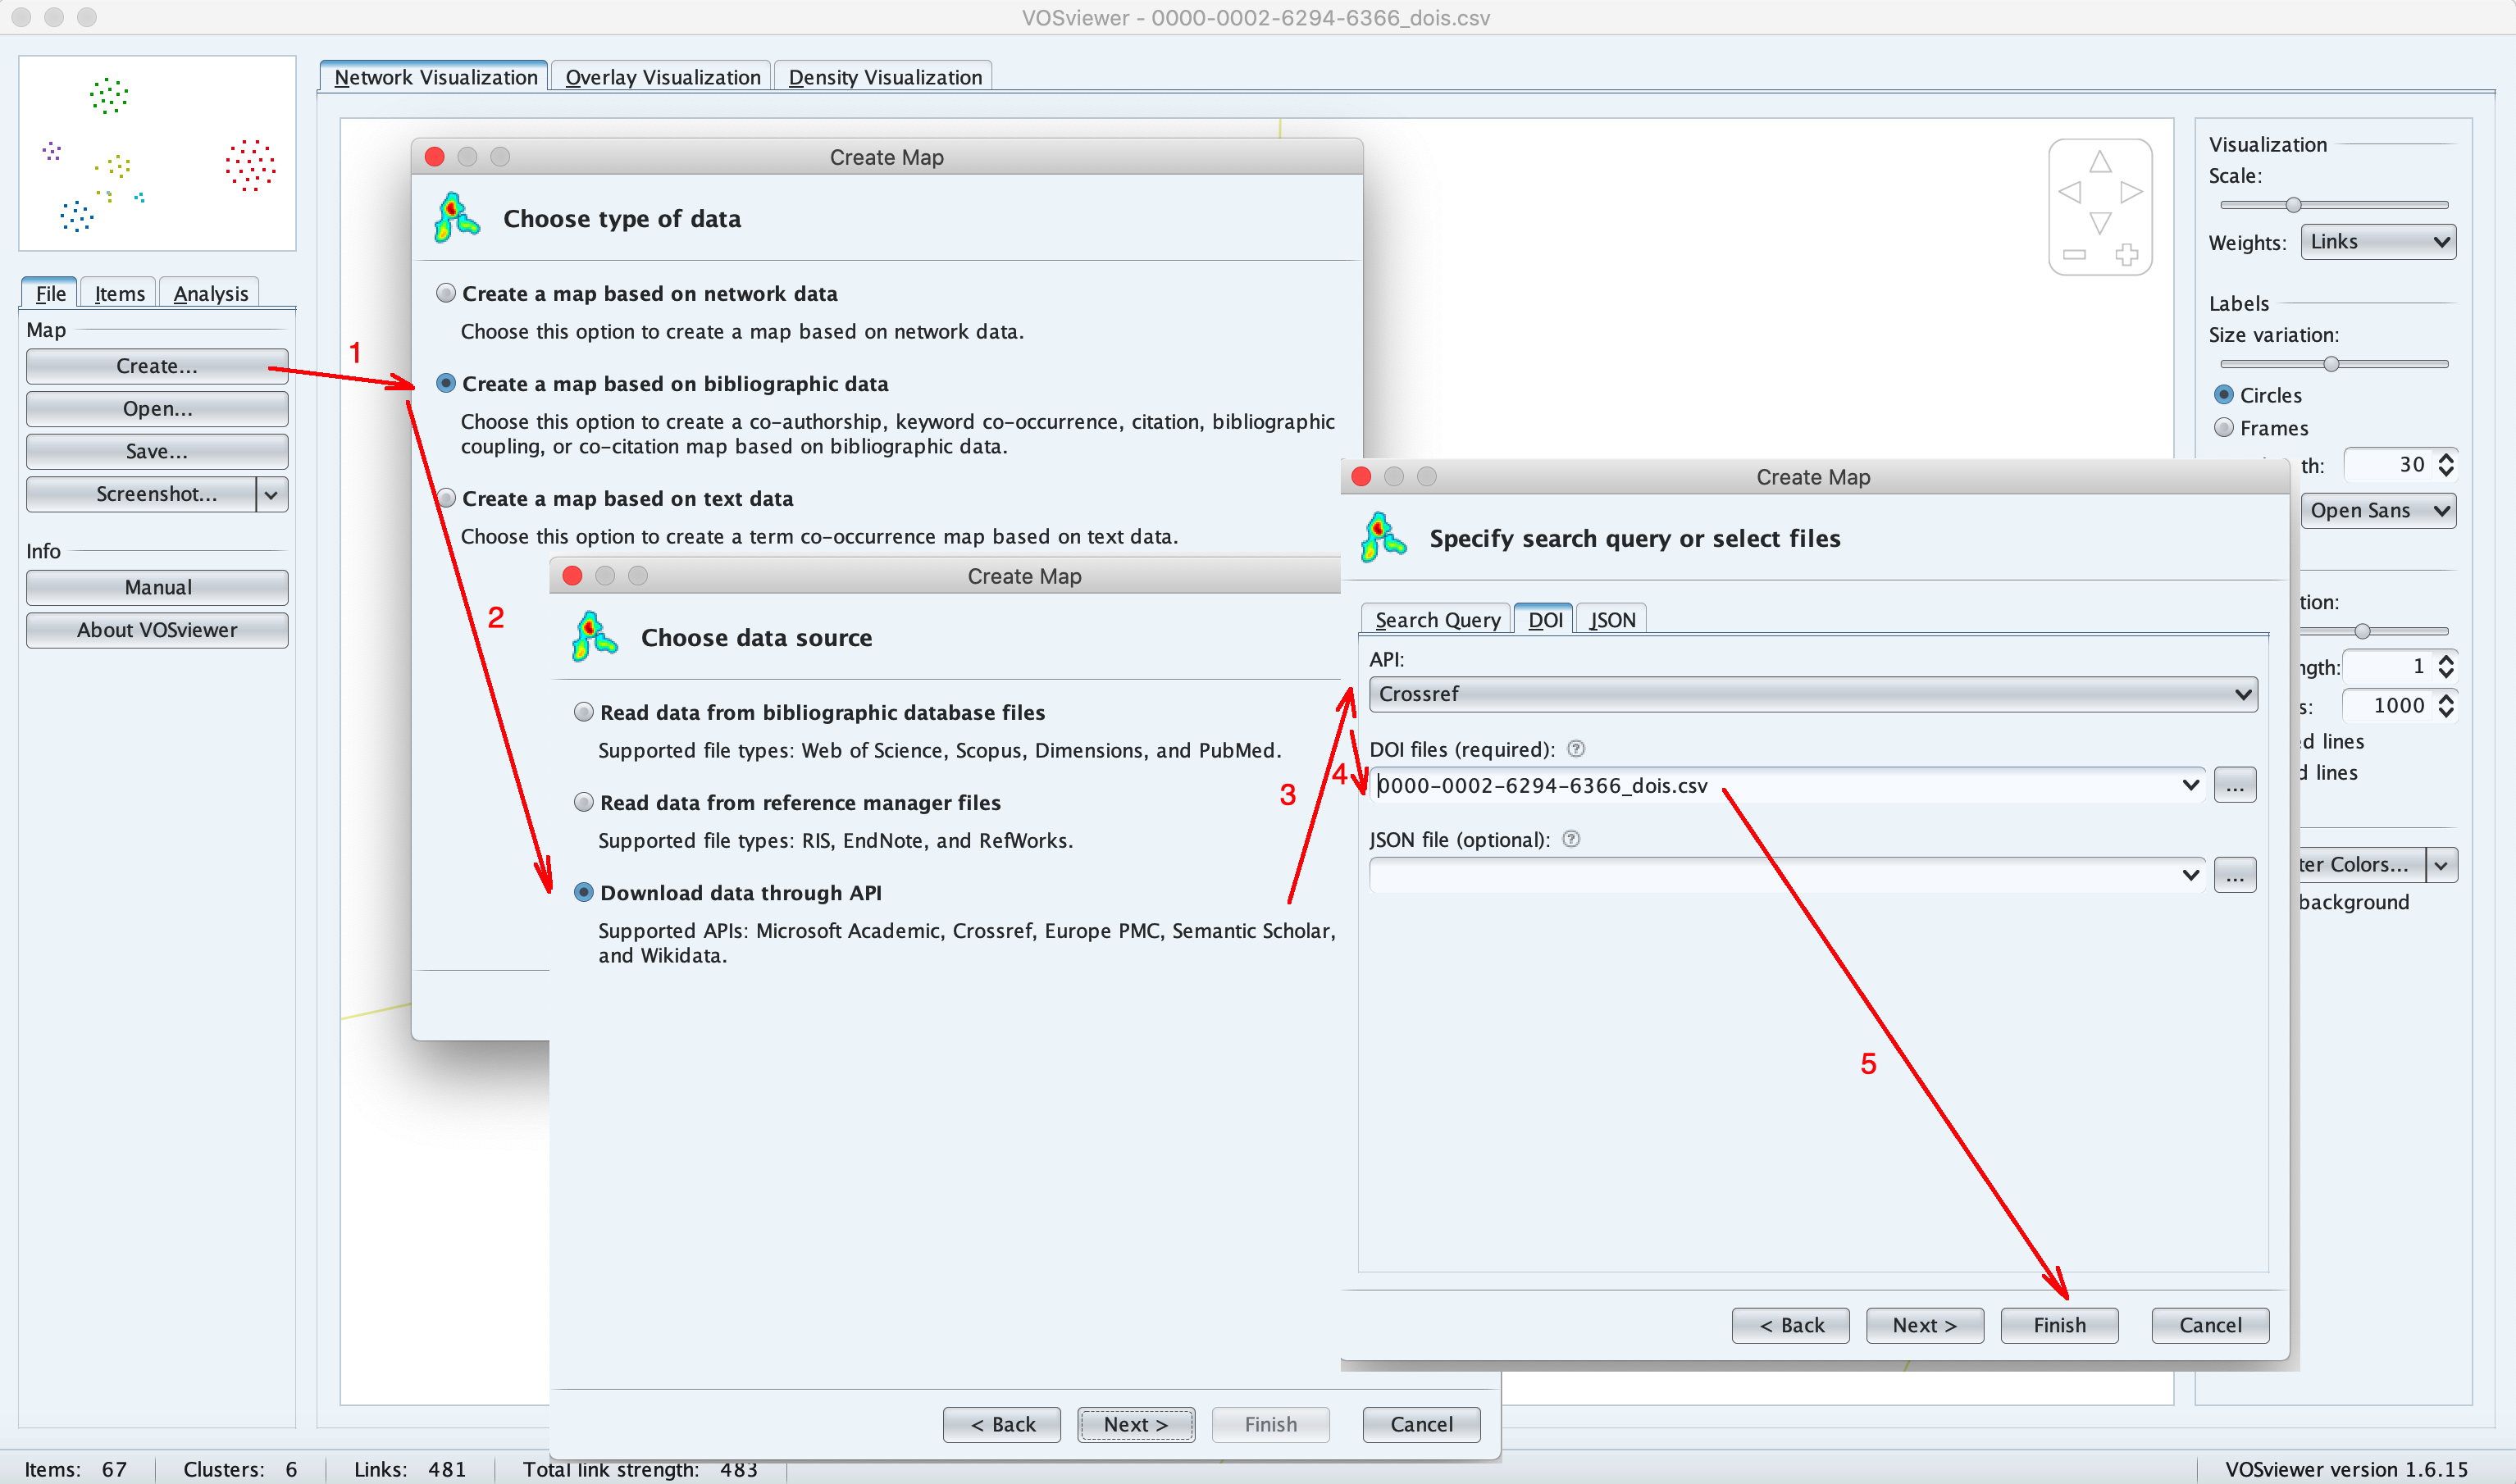
This file can be loaded into VOSviewer tool in order to construct and visualise the researcher's co-authorship network, using the following steps (see the image below):
- Select File tab on the right, then click on Create button
- In the Choose type of data window, select Create a map based on biobliographic data
- In the Choose data source window, select Download data through API
- In the Specify search query or select file select DOI tab, then API: Crossref, then in the DOI files text box type in or select the path to the file of DOIs you downloaded.
- Click on Finish button to construct and display the network.

import pandas as pd
from IPython.display import Javascript
from requests.utils import requote_uri

# Collect publication DOIs so that it can be downloaded
dois = []
publications = data['person']['publications']
for n in publications['nodes']:
    if n['versionOfCount'] > 0:
        # If the current output is a version of another one, exclude it
        continue
    dois.append(n['id'])
df = pd.DataFrame(dois, columns = None)
file_name = "%s_dois.csv" % query_params['researcherId'].split("/")[-1]

js_download = """
var csv = '%s';

var filename = '%s';
var blob = new Blob([csv], { type: 'application/x-bibtex;charset=utf-8;' });
if (navigator.msSaveBlob) { // IE 10+
    navigator.msSaveBlob(blob, filename);
} else {
    var link = document.createElement("a");
    if (link.download !== undefined) { // feature detection
        // Browsers that support HTML5 download attribute
        var url = URL.createObjectURL(blob);
        link.setAttribute("href", url);
        link.setAttribute("download", filename);
        link.style.visibility = 'hidden';
        document.body.appendChild(link);
        link.click();
        document.body.removeChild(link);
    }
}
""" % (df.to_csv(index=False, header=False).replace('\n','\\n').replace("\'","\\'").replace("\"","").replace("\r",""), file_name)

display(Javascript(js_download))
# This section contains an example of co-authorship network for Dr Sarah Teichmann's publications - hence the conditional logic below
if query_params['researcherId'] == "https://orcid.org/0000-0002-6294-6366":
display(Markdown("""
## [Dr Sarah Teichmann](https://orcid.org/0000-0002-6294-6366)'s co-authorship network as shown in VOSviewer
Interestingly, the network (excluding publications with author lists longer than 25) shows clusters with at least three versions of the researcher's author name:
- Teichmann Sarah A.
- Teichmann Sarah A
- Teichmann Sarah

"""))