Data Analysis: Moral Foundations Theory
Professor Amy Tick
Moral Foundations Theory (MFT) hypothesizes that people's sensitivity to the foundations is different based on their political ideology: liberals are more sensitive to care and fairness, while conservatives are equally sensitive to all five. Here, we'll explore whether we can find evidence for MFT in the campaign speeches of 2016 United States presidential candidates. For our main analysis, we'll go through the data science process start to finish to recreate a simplified version of the analysis done by Jesse Graham, Jonathan Haidt, and Brian A. Nosek in their 2009 paper "Liberals and Conservatives Rely on Different Sets of Moral Foundations". Finally, we'll explore other ways to visualize and use this data in rhetorical analysis.
Estimated Time: 50 minutes
Topics Covered
- Word count using a dictionary
- Data visualization with pandas
- Graph interpretations
Table of Contents
1 - [Data Set and Test Statistic](#section 1)
1.1 - [2016 Campaign Speeches](#subsection 1)
1.2 - [Moral Foundations Dictionary](#subsection 2)
2 - [Data Analysis](#section 2)
2.1 - [Calculating Perceptages](#subsection 3)
2.2 - [Filtering Table Rows](#subsection 4)
2.3 - [Democrats](#subsection 5)
2.4 - [Republicans](#subsection 6)
2.5 - [Democrats vs Republicans](#subsection 7)
3 - [Additional Visualizations](#section 3)
Dependencies:
import numpy as np
import pandas as pd
import matplotlib.pyplot as plt
%matplotlib inline
import json
from nltk.stem.snowball import SnowballStemmer
import os
import re
Intro: The Data Science Process
Module 01 defined data science as an interdisciplinary field, combining statistics, computer science, and domain expertise to understand the world and solve problems. The data science process can be thought of like this:
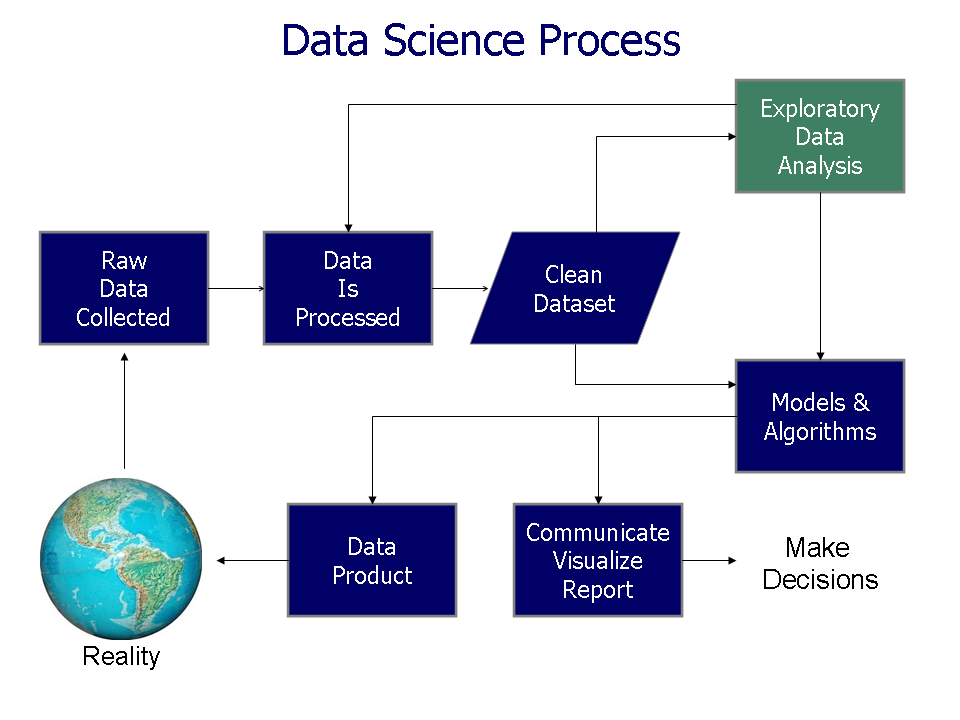
This module walks through a simplified version of the process to explore speech data and probe Moral Foundations Theory. Steps done in this module are in bold.
- Raw Data Collection: speech data is collected into csv files via web-scraping.
- Data Processing/Cleaning: speech data is transformed to enable analysis. Some processing/cleaning has already been done.
- Exploratory Data Analysis: transform, visualize, and summarize data with the goal of understanding the data set, finding possible issues, and looking for potential questions to explore further.
- Models and Algorithms: develop and test a model- a theory of how the data was generated (in this case, Moral Foundations Theory).
- Communicate, Visualize, Report: to be discussed in Module 03.
Part 1: Speech Data and Foundations Dictionary 
In Part 1, we'll get familiar with our data set and determine a way to answer questions using the data.
2016 Campaign Speeches 
Run the cell below to load the data.
# load the data from csv files into a table.

# reate an empty DataFrame
speeches = pd.DataFrame()

# The location of the files
path = '../mft_data/csv/'

# Cycle through the data files
for file in os.listdir(path=path):
    # Select campaign speech texts
    if file.endswith("c.csv"):
        if len(speeches) == 0:
            speeches = pd.read_csv(path + file)
        else:
            speeches = speeches.append(pd.read_csv(path + file))

# Reset the DataFrame index
speeches.reset_index(drop=True, inplace=True)

# Display the first five rows
speeches.head()
Take a moment to look at this table. Before doing any analysis, it's important to understand:
- the size of the table (how much data does it contain?)
- the structure of the table (how is the data organized?)
- what information it contains (what are the aspects of each record described in columns? what does each record (row) represent?)
# use this cell to expore the speeches DataFrame
# the `shape` attribute is useful to get the number of rows and columns
speeches.shape
Moral Foundations Dictionary 
In "Liberals and Conservatives Rely on Different Sets of Moral Foundations", one of the methods Graham, Haidt, and Nosek use to measure people's use of Moral Foundations Theory is to count how often they use words related to each foundation. This will be our test statistic for today. To calculate it, we'll need a dictionary of words related to each moral foundation.
The dictionary we'll use today comes from a database called WordNet, in which "nouns, verbs, adjectives and adverbs are grouped into sets of cognitive synonyms (synsets), each expressing a distinct concept." By querying WordNet for semantically related words, it was possible to build a dictionary automatically using a Python program.
Run the cell below to load the dictionary and assign it to the variable 'mft_dict'.
# Load your hand-coded dictionary into the mft_dict variable
# If you want to load the Wordnet dictionary used in class,
#    replace 'my_dict' with 'foundations_dict' in the next line
with open('../mft_data/my_dict.json') as json_data:
    mft_dict = json.load(json_data)

# Stem the words in your dictionary (this will help you get more matches)
stemmer = SnowballStemmer('english')

for foundation in mft_dict.keys():
    curr_words = mft_dict[foundation]
    stemmed_words = [stemmer.stem(word) for word in curr_words]
    mft_dict[foundation] = stemmed_words
We can see the keys of the dictionary using the .keys() function:
keys = mft_dict.keys()
list(keys)
And we can look up the entries associated with a key by putting the key in brackets:
mft_dict[list(keys)[0]]
Try looking up the entries for the other keys by filling in for '...' in the cell below.
# look up a key in mft_dict
...
There's something odd about some of the entries: they're not words! The entries in this dictionary have been stemmed, meaning they have been reduced to their smallest meaningful root.
We can see why this is helpful with an example. Python can count the number of times a string can be found in another string using the string method 'count':
# Counts the number of times the second string appears in the first string
"Data science is the best major, says data scientist.".count('science')
It returns one match, for the second word. But, 'scientist' is very closely related to 'science', and many times we will want to match them both. A stem allows Python to find all words with a common root. Try running the count again with a stem that matches both 'science' and 'scientist'.
# Fill in the parenthesis with a stem that will match both 'science' and 'scientist'
"Data science is the best major, says data scientist.".count('...')
Another thing you might have noticed is that all the entries in our dictionary are lowercase. This could be a problem when we do our text analysis. Try counting the number of times 'rhetoric' appears in the example sentence.
# Fill in the parenthesis to count how often 'rhetoric' appears in the sentence
"Rhetoric major says back: NEVER argue with a rhetoric student.".count('...')
We can clearly see the word 'rhetoric' appears twice, but the count function only returns 1. That's because Python differentiates between capital and lowercase letters:
'r' is 'R'
To get around this, we can use the .lower() function, which changes all letters in the string to lowercase:
"Rhetoric major says back: NEVER argue with a rhetoric student.".lower()
Let's add a column to our 'speeches' table that contains the lowercase text of the speeches. The clean_text function lowers the case of the text in addition to implementing some of the text cleaning methods seen in Module 01, like removing the punctuation and splitting the text into individual words.
def clean_text(text):
    # remove punctuation using a regular expression (not covered in these modules)
    p = re.compile(r'[^\w\s]')
    no_punc = p.sub(' ', text)
    # convert to lowercase
    no_punc_lower = no_punc.lower()
    # split into individual words
    clean = no_punc_lower.split()
    return clean

speeches['clean_speech'] = [clean_text(s) for s in speeches['Speech']]

speeches.head()
Part 2: Exploratory Data Analysis 
Now that we have our speech data and our dictionary, we can start our exploratory analysis. The exploratory analysis in this module will be more focused than in most cases since we already have a model in mind- Moral Foundations Theory.
To get a sense of how Moral Foundations words were used in campaign speeches, we'll do three things:
- Count the occurances of words from our dictionary in each speech
- Calculate how often words from each category are used by each political party
- Plot the percents on a bar graph
Think about what you know about Moral Foundations Theory. If this data is consistent with the theory, what should our analysis show for Republican candidates? What about for Democratic candidates? Try sketching a possible graph for each political party, assuming that candidates' speech aligns with the theory.
Calculating Percentages 
We're interesting in knowing the percent of words that correspond to a Moral Foundation in speeches- in other words, how often candidates use words related to a specific foundation.
(Bonus question: why don't we just use the number of Moral Foundation words instead of the percent as our test statistic?)
To calculate the percent, we'll first need the total number of words in each speech.
# create a new column called 'total_words'
speeches['total_words'] = [len(speech) for speech in speeches['clean_speech']]
speeches.head()
Next, we need to calculate the number of matches to entries in our dictionary for each foundation for each speech.
Run the next cell to add six new columns to speeches, one per foundation, that show the number of word matches.
#Note: much of the following code is not covered in these modules. Read the comments to get a sense of what it does.

# do the following code for each foundation
for foundation in mft_dict.keys():
    # create a new, empty column
    num_match_words = np.zeros(len(speeches))
    stems = mft_dict[foundation]

    # do the following code for each foundation word
    for stem in stems:
        # find synonym matches
        wd_count = np.array([sum([wd.startswith(stem) for wd in speech]) for speech in speeches['clean_speech']])
        # add the number of matches to the total
        num_match_words += wd_count

    # create a new column for each foundation with the number of foundation words per speech
    speeches[foundation] = num_match_words

speeches.head()
To calculate the percentage of foundation words per speech, divide the number of matched words by the number of total words and multiply by 100.
for foundation in mft_dict.keys():
    speeches[foundation] = (speeches[foundation] / speeches['total_words']) * 100

speeches.head()
Filtering table rows 
To examine the data for a particular political party, it is necessary to filter out rows of our table that correspond to speeches from the other party, something we can do with Boolean indexing.
A Boolean is a Python data type. There are exactly two: True and False. A Boolean expression is an expression that evaluates to True or False. Boolean expressions are often conditions on two variables; that is, they ask how one variable compares to another (e.g. is a greater than b? Does a equal c?).
# These are all Booleans
True

not False

6 > 0

"Ted Cruz" == "zodiac killer"
Note that Python uses == to check if two things are equal. This is because the = sign is already used for variable assignement.
Filtering out DataFrame rows can be broken into three steps:
- identify the correct feature column
- specify the desired condition for that column
- index the Dataframe with that condition in square brackets
Here's an example of how to create a new table with only Bernie Sanders' speeches.
# find the column
speech_col = speeches['Candidate']

# specify the condition
sanders_condition =  speech_col == 'Bernie Sanders'

# index the original DataFrame by the condition
sanders_speeches = speeches[sanders_condition]
sanders_speeches.head()
Democrats 
Let's start by looking at Democratic candidates. First, we need to make a table that only contains Democrats using boolean indexing.
# Filter out non-Democrat speeches
party_col = speeches['Party']

dem_cond = party_col == 'D'

democrats = speeches[dem_cond]

democrats.head()
We have our percentages for the Democratic party, but it's much easier to understand what's going on when the results are in graph form. Let's start by looking at the average percents for Democrats as a group.
# select the foundations columns and calculate the mean percent for each
avg_dem_stats = (democrats.loc[:, list(mft_dict.keys())]
                 .apply(np.mean)
                 .to_frame('D_percent'))

avg_dem_stats
Now, create a horizontal bar plot by calling the .plot.barh() method on avg_dem_stats.
avg_dem_stats.plot.barh()
Take a look at this graph. What does it show? How does it compare with the predictions of MFT?
Republicans 
Now, let's repeat the process for Republicans. Replace the ellipses with the correct code to select only Republican speeches, then run the cell to create the table.
(Hint: look back at how we made the 'democrats' table to see how to fill in the ellipses)
# Filter out non-Republican speeches

# select 'Party' column from 'speeches'
party_col = speeches['Party']

# create a condition (boolean expression) that checks if a party is Republican
republican_cond = party_col == 'R'

# index `speeches` using `republican_cond`
republicans = speeches[republican_cond]

# uncomment the next line to show the first 5 rows of the `republican` DataFrame
republicans.head()
Then, calculate the averages.
# select the foundations columns and calculate the mean percent for each
avg_rep_stats = (republicans.loc[:, list(mft_dict.keys())]
                 .apply(np.mean)
                 .to_frame('R_percent'))

avg_rep_stats
Finally, create a bar plot of avg_rep_stats using the .plot.barh() method.
# your code here
avg_rep_stats.plot.barh()
How does this plot compare with Moral Foundations Theory predictions?
Democrats vs Republicans 
Comparing two groups becomes much easier when they are plotted on the same graph.
First, combine avg_dem_stats and avg_rep_stats into one DataFrame with the join function. join is called on one table using .join(), takes the other table as its argument (in the parentheses), and returns a table with the indices matched.
Here's an example of a simple join:
peanut_butter = pd.DataFrame(data=[2.99, 3.49], index = ['Trader Joes', 'Safeway'], columns=['pb_price'])
peanut_butter
jelly = pd.DataFrame(data=[4.99, 3.59], index = ['Trader Joes', 'Safeway'], columns=['jelly_price'])
jelly
jelly.join(peanut_butter)
Now, write the code to join avg_dem_stats with avg_rep_stats.
# fill in the ellipses with your code
all_avg_stats = avg_dem_stats.join(avg_rep_stats)
all_avg_stats
Then, make a horizontal bar plot for `all_avg_stats'.
# your code here
all_avg_stats.plot.barh()
It can be hard to make comparison judgments if the bar lengsth are very similar. The next cell creates a plot of only the difference in average foundation word usage of Democrats and Republicans. A positive value means Democrats use the word more frequently; a negative value indicates Republicans use it more frequently.
# uncomment the next two lines to plot the difference in percent of foundations words per speech by party
party_diffs = pd.DataFrame(data = avg_dem_stats['D_percent'] - avg_rep_stats['R_percent'],
                          columns = ["dem_rep_pct_diff"],
                          index = mft_dict.keys())
party_diffs.plot.bar()
Part 3: Additional Visualizations
Many different graphs can be generated from the same data set to facilitate different comparisons. For example, we can compare the average use of foundation words by individual Democrats...
dem_indivs = (democrats.loc[:, list(mft_dict.keys()) + ['Candidate']]
             .groupby('Candidate')
             .mean())

dem_indivs.plot.barh(figsize=(8, 8))
...or individual Republicans.
rep_indivs = (republicans.loc[:, list(mft_dict.keys()) + ['Candidate']]
             .groupby('Candidate')
             .mean())

rep_indivs.plot.barh(figsize=(8, 20))
We can also examine how a candidate uses foundation words over time. The following plot shows foundation word usage for Donald Trump in the weeks leading up to the election.
# select Trump's speeches and drop unnecessary columns
trump = (republicans[republicans['Candidate'] == "Donald Trump"]
         .loc[:, list(mft_dict.keys()) + ['Date']])

# set the speech dates as the table index
trump['Date'] = pd.to_datetime(trump['Date'])
trump = (trump.set_index('Date')
         .loc['2016-07-01':])

# plot the data
trump.plot(figsize = (10, 6))
What other kinds of plots could be generated from this data? What other questions might we be able to explore with these or other plots?
Bibliography
- Election documents scraped from http://www.presidency.ucsb.edu/2016_election.php
- Graham, J., Haidt, J., & Nosek, B. A. (2009). Liberals and conservatives rely on different sets of moral foundations. Journal of personality and social psychology, 96(5), 1029. http://projectimplicit.net/nosek/papers/GHN2009.pdf, October 9 2017.
Notebook developed by: Keeley Takimoto, Sean Seungwoo Son, Sujude Dalieh
Data Science Modules: http://data.berkeley.edu/education/modules