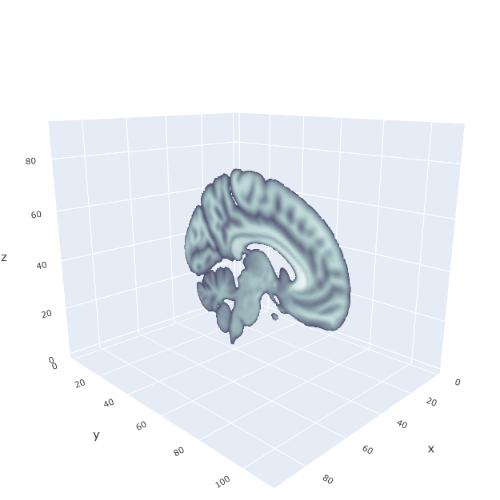
Slice in a volume bounded by an isosurface
Brain slice
Brain slice
A 3D array stores the values of a scalar field defined on a volume. We illustrate how is defined a slice in the sub-volume bounded by an isosurface, without visualizing the isosurface.
We are using the same data file, MNI152.npy, as in the notebook 13-Isosurface-Marching-Cube-Meshing_jl.ipynb
Hence, here is drawn a slice in the brain illustrated in that notebook.
In [ ]:
using PlotlyJS
using NPZ
include("src/plotlyju.jl");
In [ ]:
brain_vol = npzread("data/MNI152.npy");
m, n, p= size(brain_vol)

x = 1:m
y = 1:n
z = 1:p
X = [xi for xi in x, yi in y, zi in z]
Y = [yi for xi in x, yi in y, zi in z]
Z = [zi for xi in x, yi in y, zi in z];

pl_brain = [[0.0, "#4a4b66"], #custom colorscale for brain, derived from Matplotlib bone
            [0.125, "#5d617d"],
            [0.25, "#707b8f"],
            [0.375, "#8294a1"],
            [0.5, "#94aeb4"],
            [0.625, "#aac5c7"],
            [0.75, "#c5dada"],
            [0.875, "#e2eded"],
            [1.0, "#ffffff"]];

isosurf = isosurface(surface_show=false, surface_count=1,
                 colorscale=pl_brain,
                 showscale=false,
                 x=vec(X),
                 y=vec(Y),
                 z=vec(Z),
                 value=vec(brain_vol),
                 slices=attr(x= attr(show=true,
                                     fill= 1.0,
                                     locations= [43])),
                 isomin= 0,
                 isomax=  maximum(brain_vol))


layout= Layout(width=500,
               height=500,
               scene=attr(camera=attr(eye=attr(x=1.48, y=1.48, z=0.6)),
                          #xaxis=attr(visible=false),
                          #yaxis=attr(visible=false),
                          #zaxis=attr(visible=false),
                          aspectmode="data"),
                          margin=attr(t=10, r=0, b=8, l=0))


pl = Plot(isosurf, layout, style=plotlyju)
Animation: successive x-slices.
In [ ]: