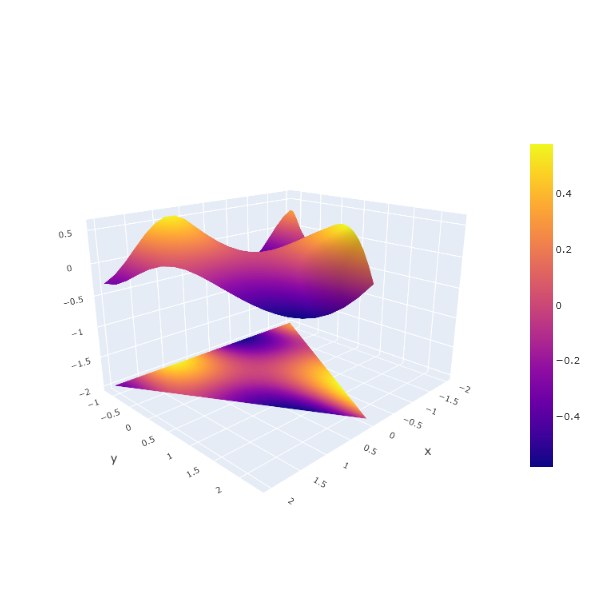
Meshing a triangular surface of equation $z=f(x,y)$ 
We define and plot a surface S, as the graph of a function defined on a 2D triangular region, $\Delta$.
To draw such a surface as a PlotlyJS mesh3d trace, we triangulate the region $\Delta$, by generating a regular grid in barycentric coordinates with respect to the boundary triangle, and converting these coordinates to cartesian ones. Then we map this triangulation onto the surface, via the function f, and project it onto a plane z=h, as well.
In [ ]:
using StaticArrays
using Delaunay
using  PlotlyJS
include("src/plotlyju.jl");
In [ ]:
function gen_trimesh_points(T₁, T₂, T₃, n=21)
    # T_1, T_2, T_3 are  the vertices of a  triangle
    # it generates (n+1)(n+2)/2 points as a triangular grid  over  the triangle T_1T_2T_3

    ## vector of  barycentric coordinates
    B = [[i/n, j/n, (n-(i+j))/n] for i in n:-1:0 for j in n-i:-1:0]
    #conversion to cartesian coordinates
    pts_vect = [SVector{2, Float64}(b[1]*T₁+b[2]*T₂ +b[3]*T₃) for b in B]
    pts_matr = reshape(reinterpret(Float64, pts_vect), (2, length(pts_vect)))'
    return pts_matr
end

f(x,y) = -cos(x)*sin(x*y);
In [ ]:
T₁, T₂, T₃ = [-2.0, -2*sqrt(3)/3],  [2.0, -2*sqrt(3)/3], [0.0, 4*sqrt(3)/3]
points = gen_trimesh_points(T₁, T₂, T₃) #N=22*23/2=253 points
mesh = delaunay(Matrix(points))
triangles = mesh.simplices .- 1;
x, y = points[:, 1], points[:, 2]
z = f.(x,y);

triangular_surf = mesh3d(x=x, y=y,
                         z=z,
                         i=triangles[:, 1],
                         j=triangles[:, 2],
                         k=triangles[:, 3],
                         intensity=z,
                         colorbar_len=0.7
            )
data = AbstractTrace[]
push!(data, triangular_surf)

#project surf onto the plane z=h:
h = -2
z_proj = h * ones(size(z))

proj_surf = mesh3d(x=x, y=y, z=z_proj,
                   i=triangles[:, 1],
                   j=triangles[:, 2],
                   k=triangles[:, 3],
                   intensity=z,
                   showscale=false)
push!(data, proj_surf)
layout = Layout(width=600, height=600,
               #margin=attr(l=50, t=10, r=50, b=10),
               scene_camera_eye=attr(x=1.75, y=1.75, z=0.9))
pl = Plot(data, layout, style=plotlyju)
In [ ]: