INE 410146 - Applied Machine Learning
$\textbf{Author: Prof. Mateus Grellert}$
Bibliographic references used in this lesson:
- Han, Kamber, Data Mining: Concepts and Techniques, Chapter 2
- Aggarwal, Charu C, Data Mining: The Textbook, Chapter 1
- Skiene, Steven, The Data Science Design Manual, Chapter 1
import matplotlib.pyplot as plt
%matplotlib inline
import warnings
warnings.filterwarnings("ignore", message="numpy.dtype size changed")
warnings.filterwarnings("ignore", message="numpy.ufunc size changed")
warnings.filterwarnings("ignore", message="MatplotlibDeprecationWarning")
2 - Getting to Know your Data
In a world where data has is abundant, unclean, and commonly unstructured, it is important to devote some time to understand it before jumping into a machine learning pipeline. As we will learn throughout the course, no one model works best for every data set there is, so we need knowledge about our data to help us design an efficient solution to our problem.
Performing an exploratory data analysis will allow us to confirm previous knowledge we had about the information we're dealing with, occasionally learn new things that will guide future decisions in our project, and foresee some problems that could affect our performance.
In this lesson, we will learn some tools and techniques that can be used to assess, summarize, and visualize our data, but first we must understand some important concepts that are common in the machine learning study. This lesson is composed of the following topics:
- Data Types
- Descriptive Statistics
- Visualization Techniques
First, we will discuss a little bit about the data types that we will work with, then explain how we can analyze and visualize them depending on these types.
We will heavily count on Pandas and its several used methods and data structures to help us in this course, so we recommend you to study the basics of this library if you can. Their website has a quick guide to help you with the basics, and they also provide documentation for all the methods we're going to use. We also recommend you to learn about the DataFrame and Series data structures, as well as their common methods.
The Seaborn library will also be used due to its several methods for data visualization. A tutorial can also be found on their webpage.
2.1 - Data Types
Disclaimer: like many other things in machine learning, there is no consensus on the best way to categorize the different types of data. Psychologist Stanley Smith Stevens proposed a typology in 1946 that is commonly adopted today, using four types (nominal, ordinal, interval and ratio). However, other categories are important for predictive modeling, like temporal or spatial dependency. Therefore, we will build upon a compiled version of recent literature references. The figure below shows an attempt to organize some of the concepts that will be discussed in the following paragraphs.

In his Data Sciende Design Manual, Skiena first categorizes data as being structured or unstructured.
Unstructured data comprises the raw, unprocessed information that is collected from all types of heterogeneous sources, like web pages, text documents, vital signals etc. Unstructured data is usually unorganized and does not follow a format. A preprocessing phase is commonly employed to make this data usable in machine learning algorithms.
Structured data, on the other hand, is well organized and usually well formatted. This data can be easily (in some cases directly( mapped to a set of features that can be used in the machine learning pipeline. However, this does not mean that no preprocessing is required. Structured data may also contain hazards like missing values, outliers, noisy information etc.
Aggarwal, in his Data Mining book, adds the concepts of nondependency-oriented and dependency-oriented data.
Nondependency-oriented represents data whose entries do not have an implicit or explicit relationship among them. For instance, if we interview several people in a randomized fashion, the answers of one interview will not affect the answers of another.
In dependency-oriented data, however, there is an implicit or explicit relationship among neighboring entries. For instance, if a sensor is measuring the temperature of a room periodically, the value that is measured each instant is related to the previous values.
For nondepency-oriented data, the attributes can be further categorized based on the values that they can assume, classified as numerical or categorical. Knowing the correct type of each attribute is very important, because this will define the techniques and algorithms that can be used.
Categorical, qualitative or discrete attributes, as the name suggests, represents variables whose values are limited to a specific, reduced set of categories. Some special types of categorical variables are binary (assume only two values), nominal (assume a set of values with no sense of order), and ordinal (order is important). Examples of categorical variables include: age group (nominal), season of the year, day of the week, size of a lump (ordinal), and all types of flag variables that represent the presence of an event (binary).
Numerical, quantitative or continuous attributes are the variables that can assume several (even infinite) amount of values of an interval, represented as numbers. Numeric features can be interval-scaled, when there is no true zero and therefore comparisons are based on differences, or ratio-scaled, when there is a true zero, so comparisons in terms of ratio can be made. To exemplify the difference, let us consider the temperature measured in the Celsius scale. We cannot say that $10^oC$ is twice as warm as $5^oC$, because this scale does not have a true zero, i.e., $0^oC$ does not mean absence of temperature. If we consider the Kelvin scale, however, we will have a true zero at $0^oK$, so it is safe to say that $10^oK$ is twice as warm as $5^oK$ Other examples of numeric attributes include: calendar years (interval-scale), blood pressure (ratio-scaled), and number of retweets.
Dependency-oriented data also have subcategories based on what type of dependecy occurs. For instance, the spatial category represents data in which spatially-neighboring entries are correlated. Examples include: the number of COVID-19 cases registered each day (time-series, possibly spatial as well), pixels in an image (spatial), and words in a sentence (time-series).
2.2 - Exploratory Data Analysis
Now that we understand how our attributes can be classified, we can start our exploratory analysis. Our goal here is to generate a profile of our data set, showing how attributes are distributed, potential cases of outliers or invalid values, data availability etc.
In this lesson, we will use a data set containing clinical records of native american women from a people called the Pima. This data was collected to understand which biomarkers can assist in diagnosing diabetes.
The attributes of this data set are:
- Pregnancies: Number of times pregnant
- Glucose: Plasma glucose concentration a 2 hours in an oral glucose tolerance test
- BloodPressure: Diastolic blood pressure (mm Hg)
- SkinThickness: Triceps skin fold thickness (mm)
- Insulin: 2-Hour serum insulin (mu U/ml)
- BMI: Body mass index (weight in kg/(height in m)^2)
- DiabetesPedigreeFunction: Diabetes pedigree function
- Age: Age (years)
- Outcome: diabetes test result (1 for positive, 0 for negative)
Let's first remind ourselves that, in the machine learning community, the attributes used as input for prediction are also called features, and the variable that we want to predict is called class, label (for classication) or target variable (can be used for classification and regression).
Note that most of our attributes are numerical, except for our class variable (Outcome).
Let's open it up with Pandas to make use of its powerful DataFrame structure. The info() method is a quick way of viewing the content of our data set.
import pandas as pd
# reading a CSV dataset with comma-separated values (,)
df = pd.read_csv('../DATASETS/pima_diabetes.csv', sep = ',')
df.info()
<class 'pandas.core.frame.DataFrame'> RangeIndex: 768 entries, 0 to 767 Data columns (total 9 columns): # Column Non-Null Count Dtype --- ------ -------------- ----- 0 Pregnancies 768 non-null int64 1 Glucose 768 non-null int64 2 BloodPressure 768 non-null int64 3 SkinThickness 768 non-null int64 4 Insulin 768 non-null int64 5 BMI 768 non-null float64 6 DiabetesPedigreeFunction 768 non-null float64 7 Age 768 non-null int64 8 Outcome 768 non-null int64 dtypes: float64(2), int64(7) memory usage: 54.1 KB
The output of the info() method first shows the number of rows (entries) and columns (attributes) in our dataset. Therefore, 768 entries and 9 columns were read successfully. The following lines show the name of each attribute, the number of entries that are not null, and the data type (based on numpy data types). The last line shows the amount of RAM required by our dataset (important for predicting memory and computing requirements).
The fact that null entries were not detected does not necessarily mean all entries are valid. Null values can be represented in different ways depending on the dataset. If we know it beforehand, the read_csv() function allows us to configure which values should be considered null with the na_values parameter.
Pandas usually does a good job inferring the types of our attributes, but note that our class attribute (Outcome) was detected as being an int64 type. Since we know that our class is binary, we can fix this by converting it to categorical with the astype() method. Since we're at it, let's replace the $0$ and $1$ values for ones that actually tell us what they represent.
# the `inplace` argument is used for altering the values in the dataframe itself,
# instead of returning a new dataframe with the modifications
df["Outcome"].replace(0, 'Negative', inplace = True)
df["Outcome"].replace(1, 'Positive', inplace = True)
df["Outcome"] = df["Outcome"].astype("category")
df.info()
<class 'pandas.core.frame.DataFrame'> RangeIndex: 768 entries, 0 to 767 Data columns (total 9 columns): # Column Non-Null Count Dtype --- ------ -------------- ----- 0 Pregnancies 768 non-null int64 1 Glucose 768 non-null int64 2 BloodPressure 768 non-null int64 3 SkinThickness 768 non-null int64 4 Insulin 768 non-null int64 5 BMI 768 non-null float64 6 DiabetesPedigreeFunction 768 non-null float64 7 Age 768 non-null int64 8 Outcome 768 non-null category dtypes: category(1), float64(2), int64(6) memory usage: 49.0 KB
Now that we have our columns assigned to their most suited type, we can start analyzing its columns using descriptive statistics. This will give us an overall description of our data and is very useful for detecting problems like invalid, noisy or missing values.
There are two basic aspects we can measure in our data: the central tendency, which tells us where most of our data is concentrated, and the dispersion, which shows us how spread out is our data.
2.2.1 - Central Tendency
The measures of central tendency try to tell us where most of our data is concentrated. This is useful, because we can describe with a single value an entire distribution. There is more than one way of measuring the central tendency, and we will discuss the most basic ones:
Mean ($\mu$): it is the sum of all values in a column divided by the number of summed values. It is mathematically expressed as $\mu(X)=\frac{1}{n}\sum_i^nX_i$. It can also be called average.
Median: if we order a series based on its values, the median is the value that separates this ordered list right in the middle. When there is an even number of values, the median of an ordered series $X$ is located in position $\frac{|X|+1}{2}$. If the number is even, we take the average of positions $\frac{|X|}{2}-1$ and $\frac{|X|}{2}+1$.
Mode: this is the most frequent value in a series. So if we count how many times each value occurs, the one with the highest count would be the mode. We can have series with more than one, two (bimodal) or more (multimodal) modes.
For numeric values, the mean and median are recommended predictors of central tendency. If our data is asymmetrical, i.e., the left and right halfs of the distribution are uneven, then it is recommended to use the median instead of the mean. The median is also less sensitive to outliers. For categorical data, the mode is the most recommended descriptor of central tendency.
It is also possible to evaluate the symmetry (or skewness) of a series by simply comparing the central tendency measurements. For instance, the data is considered symmetric when all three are near each other. When the mode is smaller than the median, then we say that the data is positively skewed. Otherwise, it is negatively skewed. The figure below shows this example.

2.2.2 - Dispersion
Measuring the dispersion or the spread of our data is also important to understand how much the central tendencies are representative. The mean of series that is too disperse does not hold much description value. Let's see some ways of measuring this dispersion.
Standard Deviation ($\sigma$): it is the rooted squared difference between each sample and the mean, i.e., $\sigma(X)=\sqrt{\frac{1}{n}\sum_i^n(X_i-\mu)^2}$. The square of the standard deviation is called variance and is also commonly used in descriptive statistics.
Quantiles: consider that we plot the distribution of a series and divide it into equally-spaced intervals (in terms of percentage). The data points where each new interval begins are called quantiles. These values are used to summarize how our distribution behaves. The quantiles are represented as percentages, so if we split our data into four points, we would have 0.25, 0.5 and 0.75 quantiles (also called quartiles in this case). The figure below illustrates this.

The 50% percentile (or second quartile - Q2) is also the median, and represents the point where our data is divided into two equally-distributed parts. Also, if the set composed of (min, Q1, Q2, Q3, max) is called the 5-number summary.
Interquartile range (IQR): a final metric for defining the spread is the interquartile range. This value represents the distance between the first and third quartiles, i.e., $IQR=Q_3-Q_1$. The IQR can be used to measure dispersion, and some authors defend that a good rule of thumb for removing outliers is to drop values falling at least $1.5\times IQR$ above the third quartile or below the first quartile.
2.3 - Putting it to practice
Let's see how we can obtain all these values in Python. Thankfully, the describe() method will already give us the main descriptors we need.
df.describe()
| Pregnancies | Glucose | BloodPressure | SkinThickness | Insulin | BMI | DiabetesPedigreeFunction | Age | |
|---|---|---|---|---|---|---|---|---|
| count | 768.000000 | 768.000000 | 768.000000 | 768.000000 | 768.000000 | 768.000000 | 768.000000 | 768.000000 |
| mean | 3.845052 | 120.894531 | 69.105469 | 20.536458 | 79.799479 | 31.992578 | 0.471876 | 33.240885 |
| std | 3.369578 | 31.972618 | 19.355807 | 15.952218 | 115.244002 | 7.884160 | 0.331329 | 11.760232 |
| min | 0.000000 | 0.000000 | 0.000000 | 0.000000 | 0.000000 | 0.000000 | 0.078000 | 21.000000 |
| 25% | 1.000000 | 99.000000 | 62.000000 | 0.000000 | 0.000000 | 27.300000 | 0.243750 | 24.000000 |
| 50% | 3.000000 | 117.000000 | 72.000000 | 23.000000 | 30.500000 | 32.000000 | 0.372500 | 29.000000 |
| 75% | 6.000000 | 140.250000 | 80.000000 | 32.000000 | 127.250000 | 36.600000 | 0.626250 | 41.000000 |
| max | 17.000000 | 199.000000 | 122.000000 | 99.000000 | 846.000000 | 67.100000 | 2.420000 | 81.000000 |
The output of this method shows, for each column, the count of valid entries, the mean and standard deviation (std), as well as the 5-number summary.
We can see that most of our columns are asymmetrical, since the mean and the meadian (50% quartile) are different. We can alo see only adult women were included in the analysis (minimum age is 21).
It is also worth mentioning that the maximum amount of pregnancies is 17, which is far what is expected. This case can be considered an outlier, i.e., a value that is too distant from the mean and that usually represents an anomalous event. This is probably what's causing the difference between the mean and the median in this column.
By looking at the min and max values, we can observe that the min value for blood pressure is $0$. This is likely an invalid measurement, since it would represent that the patient is dead. The same goes for glucose with a value of $0$.
A final observation is that the Outcome attribute was not included in this analysis. This is because the describe() only shows numeric attributes by default. We can change this with the include parameter.
df.describe(include = 'category')
| Outcome | |
|---|---|
| count | 768 |
| unique | 2 |
| top | Negative |
| freq | 500 |
Note that the descriptors used here are different, showing values that are more suitable for categorical data. The output shows us we have $2$ unique values, which makes sense for a binary variable. It also shows us that the most frequent element (top) is Negative, which is also expected.
Finally, we can see that the most frequent case occured in $500$ of $768$ entries. This is an important information because it shows that our dataset is imbalanced, i.e., the occurrences of each class value are different. We will get back to this matter in future lessons, but you should know now that imbalanced data is usually unwanted and must be handled somehow.
2.3.1 - Visualizing Central Tendency and Dispersion
A great tool for visualizing the five-number summary is the box plot. Let's first take a look at it before explaining what it shows. We will use the plot method of the Pandas library for this.
# the kind parameter is used to select the boxplot, and the figsize is used to define the size of the plot
df.plot(kind = "box", figsize= (15,5))
<AxesSubplot:>

# creating three subplots in the same figure (one row, three columns)
# the axes variable will hold a list with the three subplots for referencing
fig, axes = plt.subplots(1,3, figsize = (15,5))
# plotting a specific series in each element of the axes list
df["Pregnancies"].plot(kind = "box", ax = axes[0])
df["Glucose"].plot(kind = "box", ax = axes[1])
df["BloodPressure"].plot(kind = "box", ax = axes[2])
<AxesSubplot:>

Showing the boxplot for all columns on the same chart (first figure) makes it difficult to read due to differences in scale. In such cases, it is better to create a single plot for each column individually. Now let's see how we can read this chart.
The box represents the area between quartiles Q1 and Q3. The green line in the middle of the box is the meduan (Q2). The whiskers can mean two things: if there is no outlier, the whisker indicates the minimum or the maximum value. If the series has outliers, the whisker is extended as far as $1.5\times IQR$, and samples out of this limit are plotted as rounded points.
To exemplify, let's take the glucose chart in the middle. This chart has a median of ${\sim}100$, an IQR of ${\sim}50$, a maximum of $200$ and a minimum of $0$. Since this minimum is smaller than $Q1 - 1.5\times IQR$, it is plotted as an outlier.
If we want to stratify our boxplot by a category, for instance our class variable, we can use the boxplot implementation of the seaborn library. This library contains several useful visualization techniques, so we will be using it a lot in our course.
import seaborn as sns
fig, axes = plt.subplots(1,3, figsize = (15,5))
# The `hue` parameter tells pandas to stratify the plots based on the values of that variable
# We can use any column for x, y, and hue, but we must always tell which Data Frame is referenced
# using the `data` parameter
sns.boxplot(x=[""]*len(df), y = 'Pregnancies', hue = 'Outcome', data = df, ax = axes[0])
sns.boxplot(x=[""]*len(df), y = 'Glucose', hue = 'Outcome', data = df, ax = axes[1])
sns.boxplot(x=[""]*len(df), y = 'BloodPressure', hue = 'Outcome', data = df, ax = axes[2])
plt.show()

As we can see, the distributions of the Pregnancies and Glucose variables are quite different depending on the Outcome for diabetes. This means that these variables are associated with each other, and that they will probably be useful if we need to estimate the odds of a patient testing positive for diabetes. Keep in mind, though, that this does not necessarily mean that they cause diabetes.
A second useful visual aid is the quantile-quantile plot (QQ plot). The goal here is to compare an observed series with a teorical one in terms of quantiles. If both distributions are the same, the QQ plot will follow a straight line.
QQ plots are useful to check if a given attribute follow a known distribution (line Gaussian or Poisson). It can also be used to see if the attributes in the train and test sets follow the same distribution.
We can plot QQ plots using the problot() method of the scipy.stats library. The dist parameter defines what distribution we are trying to compare our data with. This distribution is plotted as a straight line in the charts.
import scipy.stats as stats
fig, axes = plt.subplots(1,3, figsize = (15,5))
# comparing attributes with a Gaussian (normal) distribution
stats.probplot(df["Insulin"], dist = 'norm', plot = axes[0])
stats.probplot(df["Glucose"], dist = 'norm', plot = axes[1])
stats.probplot(df["BloodPressure"], dist = 'norm', plot = axes[2])
axes[0].set_title("Insulin")
axes[1].set_title("Glucose")
axes[2].set_title("BloodPressure")
plt.show()

As we can see the plots above, the glucose and blood pressure attributes follow a distribution that is somewhat close the normal. The are some discrepancies in the right and left ends, but most of the range falls on the line with the expected values.
2.3.2 - Measuring and Visualizing Associations in Data
Besides box and QQ plots, there are several other visualization techniques that allow us to detect associations in our data. Let's view some other examples, explaining the idea behind them, how to use them in Python, and how to interpret the results.
Histograms and Scatter plots
Histograms are graphical representations of a distribution. In the $x$ axis, the ordered values are shown, and the $y$ axis shows the number of occurences (or frequency) of each value. To make visualization simpler, histograms typically group ranges of values in bins (also called buckets), adding up all the occurrences of the values inside each bin. Like what we did in the boxplots, we can also plot stratified histograms, comparing the distribution of a variable for different categories of another variable.
While histograms are usually shown for a single variable, scatter plots are visualization tools used to evaluate the relationship between two (or three) variables. Given two series $X$ and $Y$ with the same length, the scatter plot is formed with $(x_i,y_i)$ pairs of these variables.
Let's illustrate these concepts with some Python code. There is more than one option for plotting histograms, and scatter plots, but we will stick to the pandas and seaborn libraries for convenience.
fig, axes = plt.subplots(1,3, figsize = (15,5))
sns.histplot(data=df, x="Glucose", ax = axes[0])
sns.histplot(data=df, x="Glucose", hue = "Outcome", ax = axes[1])
sns.scatterplot(data=df, x="SkinThickness", y ="BMI", ax = axes[2])
<AxesSubplot:xlabel='SkinThickness', ylabel='BMI'>

Note that the histogram of the Glucose variable on the left is almost bell-shaped, but it's right half has a more disperse behavior. However, when we stratify this histogram to separate positive from negative cases of diabetes, we observe that the negative distribution is normally distributed, and the positive cases where the ones disrupting the normality of this distribution.
We can also see here that the central tendencies of positive and negative histograms are clearly different, with positive patientes presenting higher levels of glucose. In predictive modeling, we say that we can separate the positive and negative cases with some degree of confidence using the Glucose information. For instance, the chances of a test being positive for glucose levels close to 175 are much higher than a lower level of 75.
In some cases, one or more features are capable of separating the class distributions completely. In these cases, we say that our data are linearly separable. However, this almost never the case for real data sets, so we should always expect some misclassifications even with very efficient models.
By observing the scatter plot on the right side, we can conclude that skin thickness is associated with the body mass index. More than that, we can say that the former is positively correlated with the latter. In other words, when the skin thickness grows, the BMI also grows proportionally in a linear fashion.
Association, Correlation, and Causation
We've mentioned the words association and correlation when analyzing the relationships between two variabels. These terms might be new to some of you, so it is important to talk about them a little bit.
Both association and correlation are terms used to express a notion of dependency among variables. When two variables are dependent, there is a predictability relationship between them, i.e., we gain information from one varibale by knowing about another. For instance, if we know that a person has a greater value of skin thickness, I can predict that this same person will have a greater BMI.
Association is the term used when two variables are related to each other in some way. It simply means that they are dependent, but nothing else. Therefore, it is a more flexible, general term.
Correlation is used when the association follows a trend, i.e., when variable $X$ changes, varibale $Y$ also changes with a consistent behavior. When both variables grow in the same direction, the correlation is said to be positive (as in the BMI-skin thickness examples). A negative correlation means that, if one variable grows, the other is reduced and vice-versa.
Correlation can be measured in more than one way, but the most usual ones use the Person's correlation ($\rho$ or $r$) coefficient and the Spearman's rank coefficient ($\rho$ or $r_s$). Both can assume values between $-1$ and $1$, with $0$ representing uncorrelated variables. The difference between them is that Pearson is suitable when there is a linear correlation. Spearman can be used even the corelation is not linear, but it must be monotonic. The figure below shows the difference between series with association and correlation.

Regardless of whether our data is associated, correlated, both, or neither, we must always remember a very important lesson.
Correlation and association DO NOT imply causation!
This is a very recurrent statistical falacy that we always need to avoid when working with such analyses.
Scatter Plot Matrix (Pairplot)
Another tool that is available off the self is the pairplot() from the seaborn library. This plot shows the 2D scatter plots of all the numeric variables in out data set. It can be used to easily detect relationships between our variables, as well as their ditribution.
The seaborn implementation allows us to stratify the data based on a category, making this plot even more informative.
sns.pairplot(data = df, hue = "Outcome")
<seaborn.axisgrid.PairGrid at 0x1569e1d00>

By observing the pairplot, we can identify a relationship between the variables Age and Pregancies, which also makes sense, as older woman are more likely to have been pregnant more times than younger ones. We can also see that there are several patients that did not have their skin thickness and blood pressure measured, which explains the large concentration of samples with at $0$.
Correlation Matrix
It is also interesting to analyze the correlation between our pairs of values, features with high correlation are usually redundant, meaning that they convey similar information to our predictive models. Therefore, we can choose to eliminate one of them or combine them into a single feature that contains the information from both.
For regression problems, we can also compute the correaltion with the target variable. This will give us a hint of which features will likely be useful for the models that will be trained later. However, even features with low correlation still can prove useful in some cases (remember the correlation-association discussion).
Plotting a correlation matrix with seaborn and pandas is quite easy:
- first we compute the correlation with the
corr()method of the pandas library. This will give us a 2D matrix containing the correlation between each pair of variables. - then we plot this matrix using the
heatmap()function of theseabornpackage, which will allow us to visualize the correlations with a color map.
By default, the corr() computes the Pearson's coefficient, but other methods can be selected with the method parameter.
import seaborn as sns
fig = plt.figure( figsize = (10,8))
df_correlation = df.corr(method = 'pearson')
# setting vmin, vmax to -1,1 will force the heatmap to map colors in this range
# annot = True will show the actual values in the heatmap
sns.heatmap(df_correlation, cmap = 'coolwarm',
vmax = 1, vmin = -1, annot=True,
xticklabels = df_correlation.columns.values,
yticklabels = df_correlation.columns.values)
<AxesSubplot:>

The correlation table has symmetrical upper and lower triangulars, since $\rho(A,B) = \rho(B,A)$, and the main diagonal has the maximum correlation of $1$. We can see that most of our attributes are positively correlated. We can also confirm what was observed in the pairplot, showing that Age and Pregnancies are indeed correlated ($\rho=0.54$).
Note that our matrix only computes the correlation between pairs of numerical attributes. That is because measuring the association between categorical or between categorical and numeric values involves different approaches. The following table shows some alternatives for measuring association depending on the variables you are handling. For more details, we recommend the following reading: The search for categorical correlation by Shaked Zychlinski.
| Categorical | Numeric | |
|---|---|---|
| Categorical | Cramer's V, Theil's U |
Correlation Ratio |
| Numeric | Correlation Ratio |
Pearson's, Spearman's, Kendall Coefficient |
Contingency tables, pivot tables and count plots
When we have categorical variables, organizing them in tables can be useful for understanding their distribution and detecting possible relationships. This approach is actually used in several methods for detecting associations in categorical variables.
A contingency table over two categorical variables $A$ and $B$ organizes the categories of variable $A$ in its rows, and the values of $B$ in its columns. The value of each cell represents the total number of items that have the corresponding values of $A$ and $B$.
Let's visualize this using pandas and its crosstab method. Since our Pima data set only has a single categorical value, we will use a different data set for this section. This data set is used to predict the presense of heart disease, which is represented as a binary variable ($0$ means having the disease, $1$ otherwise). The data set can be obtained in this link, and it contains clinical variables as features, some of which are categorical. More details about this data set can be views in this link.
df2 = pd.read_csv('../DATASETS/heart.csv', sep = ',')
df2.info()
df2["target"].replace(0, "has disease", inplace = True)
df2["target"].replace(1, "no disease", inplace = True)
df2["sex"].replace(0, "Female", inplace = True)
df2["sex"].replace(1, "Male", inplace = True)
df2["target"] = df2["target"].astype("category")
df2["sex"] = df2["sex"].astype("category")
<class 'pandas.core.frame.DataFrame'> RangeIndex: 303 entries, 0 to 302 Data columns (total 14 columns): # Column Non-Null Count Dtype --- ------ -------------- ----- 0 age 303 non-null int64 1 sex 303 non-null int64 2 cp 303 non-null int64 3 trestbps 303 non-null int64 4 chol 303 non-null int64 5 fbs 303 non-null int64 6 restecg 303 non-null int64 7 thalach 303 non-null int64 8 exang 303 non-null int64 9 oldpeak 303 non-null float64 10 slope 303 non-null int64 11 ca 303 non-null int64 12 thal 303 non-null int64 13 target 303 non-null int64 dtypes: float64(1), int64(13) memory usage: 33.3 KB
# sex: 0 - female, 1 - male
# the normalize = 'index' parameter will divide the counts by the total number of items in each row
pd.crosstab(df2["sex"], df2["target"], normalize = 'index')
| target | has disease | no disease |
|---|---|---|
| sex | ||
| Female | 0.250000 | 0.750000 |
| Male | 0.550725 | 0.449275 |
We can observe that the most of the patients in this dataset are men ($114+93=207$ against $24+72=96$ women). In addition, the prevalence of heart disease is much stronger in men as well (55% of men present heart disease, against 25% for women). In some cases, it is better to visualize these counts using a bar chart. This can be done with the countplot method of the seaborn library.
sns.countplot(data= df2, x='sex',hue='target')
<AxesSubplot:xlabel='sex', ylabel='count'>

Pivot tables work in a similar fashion, but they represent a broader concept of aggregation tables. In other words, we can aggregate our data using different types of functions (mean, max, count etc). It is also possible to configure how missing values are treated in pivot tables, which happens in most practical scenarios. The only drawback
The pandas implementation of pivot tables involve four parameters:
- index: variables whose categories will be grouped in the rows
- columns: variables whose categories will be grouped in the columns
- aggfunc: aggregation functon, which by default is the
np.mean(of thenumpylibrary) - data: reference to the DataFrame
import numpy as np
# cp stands for 'chest pain': 0: typical angina, 1: atypical angina, 2: non-anginal pain, 3: asymptomatic
# chol stands for 'serum cholestoral in mg/dl
pd.pivot_table(index = ["sex", "target"], values = ["age", "chol"], data = df2, fill_value = 0)
| age | chol | ||
|---|---|---|---|
| sex | target | ||
| Female | has disease | 59.041667 | 274.958333 |
| no disease | 54.555556 | 256.750000 | |
| Male | has disease | 56.087719 | 246.061404 |
| no disease | 50.903226 | 230.989247 |
An interesting observation from this table is that heart disease seems to be associated with age and cholesterol as well, which is something that we learn at school.
Visualizing text and mixed data
Many interesting problems involve handling data with complex and unstructured information for the same problem. In such cases, different visualization approaches are necessary.
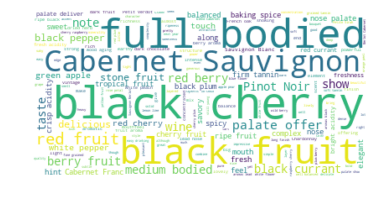
For text data, a common visualization approach involves plotting a word cloud. This technique shows the terms that happen more frequently in a corpus (a large body of text data). Of course that this involves a series of preprocessing steps to remove stop words, typos etc. The figure below shows a word cloud created from a body of wine reviews.
Another tool that is very useful for interpreting mixed data are tree maps. A tree map allows us to view hierarchical structures represented by rectangles. Categories can be used to define the hierararchies, whereas the area of rectangles can be configured based on a numeric attributes.
The plotly library has a very express method for plotting tree maps. A very interesting feature of plotly is that it allows interactive charts. The treemap() method expects the following parameters:
- the first positional argument is the DataFrame to be processed
- path: variables used to build the hiearchies
- values: numeric column used to define the size of rectangles
- color: adds a color scale based on a numeric attribute
The example below shows a tree map built using a "Video Game Sales" data set (available here).
import plotly.express as px
df3 = pd.read_csv('../DATASETS/vgsales.csv')
df3.dropna(inplace=True)
fig = px.treemap(df3,
path=['Platform', 'Genre'],
values='Global_Sales',
color='NA_Sales'
)
fig.show()
2.4 - Summary
- Our data sets are composed of variables that can be categorized in different ways based on the values that they can assume
- Many methods rely on knowing if the variables are categorical (assume a limited set of values) or numerical (assume a very large set of values)
- The purpose of an exploraratory analysis is to draw important conclusions and to posit relationships between variables, as well as detect problems in our data
- Binary variables are a special type of categorical values that are widely employed in classification studies
- We can use descriptive statistics appropriate methods also depend of the type of data being evaluated.
- Correlation and association are important to analyze the dependency between variables, but they do not imply causation
- Visualizing data can be tricky, because it depends on which type of information we want to convey. The good news is that most methods are already implemented in libraries like
pandas,seaborn, andplotly
In the next lesson, we will discuss how we can clean and treat our data to make it easier to understand and also to make it more useful for the prediction models that will rely on them.
Exercises
Implement the solution in Python for the following exercises:
Han, Kamber, Data Mining: Concepts and Techniques, Chapter 2:
Exercises 2.2, 2.4
Aggarwal, Charu C, Data Mining: The Textbook, Section 1.9:
Exercises 2, 3, 4
Skiene, Steven, The Data Science Design Manual, Section 1.9:
Exercises 1.3, 1.4, 1.12