Test 2 Review
- l10 -> end
- sentiment analysis
- lexicons
- wordnet
- how to combine words with different sentiment?
- classification
- workflow (collect, label, train, test, etc)
- computing feature vectors
- generalization error
- variants of SimpleMachine
- computing cross-validation accuracy (why?)
- bias vs. variance
- demographics
- pitfalls of using name lists
- computing odds ratio
- smoothing
- ngrams
- tokenization
- stop words
- regularization (why?)
- logistic regression, linear regression
- no need to do calculus, but do you understand the formula?
- apply classification function given data/parameters
- what does the gradient represent?
- feature representation
- tf-idf
- csr_matrix: how does this data structure work? (data, column index, row pointer)
- recommendation systems
- content-based
- tf-idf
- cosine similarity
- collaborative filtering
- user-user
- item-item
- measures: jaccard, cosine, pearson. Why choose one over another
- How to compute the recommended score for a specific item?
- content-based
- k-means
- compute cluster assignment, means, and error function
- what effect does k have?
- representing word context vectors
Project tips
So you've collected data, implemented a baseline, and have an F1 of 78%.
Now what??
- Error analysis
- Check for data biases
- Over/under fitting
- Parameter tuning
Reminder: train/validation/test splits
Training data
- To fit model
- May use cross-validation loop
Validation data
- To evaluate model while debugging/tuning
Testing data
- Evaluate once at the end of the project
- Best estimate of accuracy on some new, as-yet-unseen data
- be sure you are evaluating against true labels
- e.g., not the output of some other noisy labeling algorithm
Error analysis
What did you get wrong and why?
- Fit model on all training data
- Predict on validation data
- Collect and categorize errors
- false positives
- false negatives
- Sort by:
- Label probability
A useful diagnostic:
- Find the top 10 most wrong predictions
- I.e., probability of incorrect label is near 1
- For each, print the features that are "most responsible" for decision
E.g., for logistic regression
$$ p(y \mid x) = \frac{1}{1 + e^{-x^T \theta}} $$If true label was $-1$, but classifier predicted $+1$, sort features in descending order of $x_j * \theta_j$
Error analysis often helps designing new features.
- E.g., "not good" classified as positive because $x_{\mathrm{good}} * \theta_{\mathrm{good}} >> 0$
- Instead, replace feature "good" with "not_good"
- similarly for other negation words
May also discover incorrectly labeled data
- Common in classification tasks in which labels are not easily defined
- E.g., is the sentence "it's not bad" positive or negative?
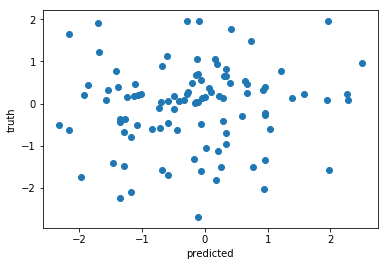
For regression, make a scatter plot - look at outliers
Inter-annotator agreement
How often do two human annotators give the same label to the same example?
E.g., consider two humans labeling 100 documents:
| **Person 1** | |||
| Relevant | Not Relevant | ||
| **Person 2** | Relevant | 50 | 20 |
| Not Relevant | 10 | 20 | |
- Simple agreement: fraction of documents with matching labels. $\frac{70}{100} = 70\%$
But, how much agreement would we expect by chance?
Person 1 says Relevant $60\%$ of the time.
Person 2 says Relevant $70\%$ of the time.
Chance that they both say relevant at the same time? $60\% \times 70\% = 42\%$.
Person 1 says Not Relevant $40\%$ of the time.
Person 2 says Not Relevant $30\%$ of the time.
Chance that they both say not relevant at the same time? $40\% \times 30\% = 12\%$.
Chance that they agree on any document (both say yes or both say no): $42\% + 12\% = 54\%$
** Cohen's Kappa ** $\kappa$
- Percent agreement beyond that expected by chance
$ \kappa = \frac{P(A) - P(E)}{1 - P(E)}$
- $P(A)$ = simple agreement proportion
- $P(E)$ = agreement proportion expected by chance
E.g., $\kappa = \frac{.7 - .54}{1 - .54} = .3478$
- $k=0$ if no better than chance, $k=1$ if perfect agreement
Data biases
How similar is the testing data to the training data?
If you were to deploy the system to run in real-time, would the data it sees be comparable to the testing data?
Assumption that test/train data drawn from same distribution often wrong:
Label shift:
$p_{\mathrm{train}}(y) \ne p_{\mathrm{test}}(y)$
- e.g., positive examples more likely in testing data
- Why does this matter?
In logistic regression:
$$ p(y \mid x) = \frac{1}{1 + e^{-(x^T\theta + b)}} $$- bias term $b$ adjusts predictions to match overall $p(y)$
More bias
Confounders
- Are there variables that predict the label that are not in the feature representation?
- e.g., some products have higher ratings than others; gender bias; location bias;
- May add additional features to model these attributes
- Or, may need to train separate classifiers for each gender/location/etc.
Temporal Bias
- Do testing instances come later, chronologically, than the training instances?
- E.g., we observe that user X likes Superman II, she probably also likes Superman I
- Why does this matter?
- inflates estimate of accuracy in production setting
Cross-validation splits
- E.g., classifying a user/organization's tweets: does the same user appear in both training/testing
- could just be learning a user-specific classifier; won't generalize to new user
- speech recognition
- Again, will inflate estimate of accuracy.
Over/under fitting
What is training vs validation accuracy?
If training accuracy is low, we are probably underfitting. Consider:
- adding new features
- adding combinations of existing features (e.g., ngrams, conjunctions/disjunctions)
- adding hidden units/layers
- try non-linear classifier
- SVM, decision trees, neural nets
If training accuracy is very high (>99%), but validation accuracy is low, we are probably overfitting
- Do the opposite of above
- reduce number of features
- Regularization (L2, L1)
- Early stopping for gradient descent
- look at learning curves
- may need more training data
Parameter tuning
Many "hyperparameters"
regularization strength
number of gradient descent iterations
...
Be sure to tune these on the validation set, not the test set.
Grid search
- Exhaustively search over all combinations
- Discretize continous variables
{'C': [.01, .1, 1, 10, 100, 1000], 'n_hidden': [5, 10, 50], 'regularizer': ['l1', 'l2']},
Random search
- Define a probability distribution over each parameter
- Each iteration samples from that distribution
- Allows you to express prior knowledge over the likely best settings
- E.g.,
regularizer={'l1': .3, 'l2': .7}```
See more at http://scikit-learn.org/stable/modules/grid_search.html
While building model, may want to avoid evaluating on validation set too much
double cross-validation can be used instead
Using only the training set:
- split into $k$ (train, test) splits
- for each split ($D_{tr}, D_{te}$)
- split $D_{tr}$ into $m$ splits
- pick hyperparameters that maximize this nested cross-validation accuracy
- train on all of $D_{tr}$ with those parameters
Evaluates how well your hyperparameter selection algorithm does.