In [1]:
import pandas as pd
import numpy as np

pd.__version__
Out[1]:
'0.25.1'
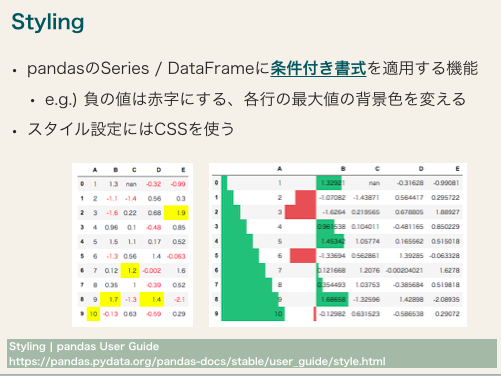
最初の一歩
スタイル設定しないまま表示
In [2]:
import pandas as pd
# テストの成績表を読み込む
df = pd.read_csv('../data/exam.csv', index_col='index')
df
Out[2]:
| Araki | Baba | Chou | |
|---|---|---|---|
| index | |||
| 国語 | 75 | 80 | 95 |
| 数学 | 55 | 80 | 70 |
| 理科 | 80 | 90 | 85 |
| 社会 | 90 | 30 | 70 |
In [3]:
def color_red_akaten(val):
    color = 'red' if val < 60 else 'black'
    return f'color: {color}'

# テストの成績表を読み込む
df = pd.read_csv('../data/exam.csv', index_col='index')
df.style.applymap(color_red_akaten)
Out[3]:
| Araki | Baba | Chou | |
|---|---|---|---|
| index | |||
| 国語 | 75 | 80 | 95 |
| 数学 | 55 | 80 | 70 |
| 理科 | 80 | 90 | 85 |
| 社会 | 90 | 30 | 70 |
In [4]:
def highlight_akaten(val):
    color = 'yellow' if val < 60 else 'None'
    return f'background-color: {color}'

df.style.applymap(highlight_akaten)
Out[4]:
| Araki | Baba | Chou | |
|---|---|---|---|
| index | |||
| 国語 | 75 | 80 | 95 |
| 数学 | 55 | 80 | 70 |
| 理科 | 80 | 90 | 85 |
| 社会 | 90 | 30 | 70 |
In [5]:
def fill_nan(val):
    bg_color = 'gray' if pd.isnull(val) else 'None'
    color = 'white' if pd.isnull(val) else 'black'
    return f'background-color: {bg_color}; color: {color}'

# 欠損値を含むデータを読み込む
df = pd.read_csv('../data/exam_with_nan.csv', index_col='index')
df.style.applymap(fill_nan)
Out[5]:
| Araki | Baba | Chou | |
|---|---|---|---|
| index | |||
| 国語 | 75 | 80 | 95 |
| 数学 | 55 | nan | 70 |
| 理科 | 80 | 90 | 85 |
| 社会 | 90 | 30 | 70 |
In [6]:
type(df.style)
Out[6]:
pandas.io.formats.style.Styler
In [7]:
df.style
Out[7]:
| Araki | Baba | Chou | |
|---|---|---|---|
| index | |||
| 国語 | 75 | 80 | 95 |
| 数学 | 55 | nan | 70 |
| 理科 | 80 | 90 | 85 |
| 社会 | 90 | 30 | 70 |
In [8]:
# のぞいてみよう
df.style.render().split('\n')[:20]
Out[8]:
['<style  type="text/css" >',
 '</style><table id="T_8d699aca_d826_11e9_a63f_94942601c652" ><thead>    <tr>        <th class="blank level0" ></th>        <th class="col_heading level0 col0" >Araki</th>        <th class="col_heading level0 col1" >Baba</th>        <th class="col_heading level0 col2" >Chou</th>    </tr>    <tr>        <th class="index_name level0" >index</th>        <th class="blank" ></th>        <th class="blank" ></th>        <th class="blank" ></th>    </tr></thead><tbody>',
 '                <tr>',
 '                        <th id="T_8d699aca_d826_11e9_a63f_94942601c652level0_row0" class="row_heading level0 row0" >国語</th>',
 '                        <td id="T_8d699aca_d826_11e9_a63f_94942601c652row0_col0" class="data row0 col0" >75</td>',
 '                        <td id="T_8d699aca_d826_11e9_a63f_94942601c652row0_col1" class="data row0 col1" >80</td>',
 '                        <td id="T_8d699aca_d826_11e9_a63f_94942601c652row0_col2" class="data row0 col2" >95</td>',
 '            </tr>',
 '            <tr>',
 '                        <th id="T_8d699aca_d826_11e9_a63f_94942601c652level0_row1" class="row_heading level0 row1" >数学</th>',
 '                        <td id="T_8d699aca_d826_11e9_a63f_94942601c652row1_col0" class="data row1 col0" >55</td>',
 '                        <td id="T_8d699aca_d826_11e9_a63f_94942601c652row1_col1" class="data row1 col1" >nan</td>',
 '                        <td id="T_8d699aca_d826_11e9_a63f_94942601c652row1_col2" class="data row1 col2" >70</td>',
 '            </tr>',
 '            <tr>',
 '                        <th id="T_8d699aca_d826_11e9_a63f_94942601c652level0_row2" class="row_heading level0 row2" >理科</th>',
 '                        <td id="T_8d699aca_d826_11e9_a63f_94942601c652row2_col0" class="data row2 col0" >80</td>',
 '                        <td id="T_8d699aca_d826_11e9_a63f_94942601c652row2_col1" class="data row2 col1" >90</td>',
 '                        <td id="T_8d699aca_d826_11e9_a63f_94942601c652row2_col2" class="data row2 col2" >85</td>',
 '            </tr>']
In [9]:
# スタイル適用後のCSSの設定
df.style.applymap(color_red_akaten).render().split('\n')[:20]
Out[9]:
['<style  type="text/css" >',
 '    #T_8d6fb9b4_d826_11e9_9e34_94942601c652row0_col0 {',
 '            color:  black;',
 '        }    #T_8d6fb9b4_d826_11e9_9e34_94942601c652row0_col1 {',
 '            color:  black;',
 '        }    #T_8d6fb9b4_d826_11e9_9e34_94942601c652row0_col2 {',
 '            color:  black;',
 '        }    #T_8d6fb9b4_d826_11e9_9e34_94942601c652row1_col0 {',
 '            color:  red;',
 '        }    #T_8d6fb9b4_d826_11e9_9e34_94942601c652row1_col1 {',
 '            color:  black;',
 '        }    #T_8d6fb9b4_d826_11e9_9e34_94942601c652row1_col2 {',
 '            color:  black;',
 '        }    #T_8d6fb9b4_d826_11e9_9e34_94942601c652row2_col0 {',
 '            color:  black;',
 '        }    #T_8d6fb9b4_d826_11e9_9e34_94942601c652row2_col1 {',
 '            color:  black;',
 '        }    #T_8d6fb9b4_d826_11e9_9e34_94942601c652row2_col2 {',
 '            color:  black;',
 '        }    #T_8d6fb9b4_d826_11e9_9e34_94942601c652row3_col0 {']
スタイル関数を複数適用する
applymap()はStylerオブジェクトを返す- その
Stylerオブジェクトも(当然だが)applymap()を持つ - 数珠つなぎのようにスタイルの重ねがけができる
In [10]:
df.style.applymap(fill_nan).applymap(color_red_akaten)
Out[10]:
| Araki | Baba | Chou | |
|---|---|---|---|
| index | |||
| 国語 | 75 | 80 | 95 |
| 数学 | 55 | nan | 70 |
| 理科 | 80 | 90 | 85 |
| 社会 | 90 | 30 | 70 |
最後に適用したCSSが優先される
In [11]:
def fill_nan_1(val):
    # 背景を灰色、文字を白にする
    bg_color = 'gray' if pd.isnull(val) else 'None'
    color = 'white' if pd.isnull(val) else 'black'
    return f'background-color: {bg_color}; color: {color}'

def fill_nan_2(val):
    # 背景を黒、文字を黄色にする
    bg_color = 'black' if pd.isnull(val) else 'None'
    color = 'yellow' if pd.isnull(val) else 'black'
    return f'background-color: {bg_color}; color: {color}'

df.style.applymap(fill_nan_1).applymap(fill_nan_2)
Out[11]:
| Araki | Baba | Chou | |
|---|---|---|---|
| index | |||
| 国語 | 75 | 80 | 95 |
| 数学 | 55 | nan | 70 |
| 理科 | 80 | 90 | 85 |
| 社会 | 90 | 30 | 70 |
In [12]:
# CSSの中身を確認
s = df.style.applymap(fill_nan_1).applymap(fill_nan_2)
s.render().split('\n')[:50]
Out[12]:
['<style  type="text/css" >',
 '    #T_8d8ce446_d826_11e9_b7fa_94942601c652row0_col0 {',
 '            background-color:  None;',
 '             color:  black;',
 '            background-color:  None;',
 '             color:  black;',
 '        }    #T_8d8ce446_d826_11e9_b7fa_94942601c652row0_col1 {',
 '            background-color:  None;',
 '             color:  black;',
 '            background-color:  None;',
 '             color:  black;',
 '        }    #T_8d8ce446_d826_11e9_b7fa_94942601c652row0_col2 {',
 '            background-color:  None;',
 '             color:  black;',
 '            background-color:  None;',
 '             color:  black;',
 '        }    #T_8d8ce446_d826_11e9_b7fa_94942601c652row1_col0 {',
 '            background-color:  None;',
 '             color:  black;',
 '            background-color:  None;',
 '             color:  black;',
 '        }    #T_8d8ce446_d826_11e9_b7fa_94942601c652row1_col1 {',
 '            background-color:  gray;',
 '             color:  white;',
 '            background-color:  black;',
 '             color:  yellow;',
 '        }    #T_8d8ce446_d826_11e9_b7fa_94942601c652row1_col2 {',
 '            background-color:  None;',
 '             color:  black;',
 '            background-color:  None;',
 '             color:  black;',
 '        }    #T_8d8ce446_d826_11e9_b7fa_94942601c652row2_col0 {',
 '            background-color:  None;',
 '             color:  black;',
 '            background-color:  None;',
 '             color:  black;',
 '        }    #T_8d8ce446_d826_11e9_b7fa_94942601c652row2_col1 {',
 '            background-color:  None;',
 '             color:  black;',
 '            background-color:  None;',
 '             color:  black;',
 '        }    #T_8d8ce446_d826_11e9_b7fa_94942601c652row2_col2 {',
 '            background-color:  None;',
 '             color:  black;',
 '            background-color:  None;',
 '             color:  black;',
 '        }    #T_8d8ce446_d826_11e9_b7fa_94942601c652row3_col0 {',
 '            background-color:  None;',
 '             color:  black;',
 '            background-color:  None;']
ここでやっていることは次の2点です
- スタイル関数を用意する
- ここでは、
color_all_red関数を自分で定義している - 要素の値を受け取って、要素ごとのCSSを返す
- ここでは、
- スタイル関数を、
applymapメソッドを使って各要素に対して適用するapplymapはStylerオブジェクトを返す
列全体、行全体、テーブル全体
先ほどまでの「値が60点未満かどうか」「値が80点以上かどうか」は、その要素単体を見れば判断できました。
では、「全ての行で一番大きい値の背景色を黄色にする」「全ての列で一番小さい値の文字を太字にする」といった場合はどうすればよいでしょうか。
このようなケースでは、要素単体の値からは判断できないので、「列全体」「行全体」「テーブル全体」を見て判断する必要があります。
このような場合は、 applymap ではなく、applyを使います。
In [15]:
def highlight_green_max(series):
    # 最大値だったらlightgreen, それ以外だったらnone(スタイルなし)にする
    color_list = ['lightgreen' if val == series.max() else 'none'
                  for val in series]

    return [f'background-color: {color}' for color in color_list]

# axis=1だと、列全体を見る (axis=0だと行全体を見る)
df.style.apply(highlight_green_max, axis=1)
Out[15]:
| Araki | Baba | Chou | |
|---|---|---|---|
| index | |||
| 国語 | 75 | 80 | 95 |
| 数学 | 55 | nan | 70 |
| 理科 | 80 | 90 | 85 |
| 社会 | 90 | 30 | 70 |
In [16]:
def highlight_green_max(series):
    # 最大値だったらlightgreen, それ以外だったらnone(スタイルなし)にする
    color_list = ['lightgreen' if val == series.max() else 'none'
                  for val in series]

    # 中身の確認(解説用)
    print(color_list)

    return [f'background-color: {color}' for color in color_list]

# axis=1だと、列全体を見る (axis=0だと行全体を見る)
df.style.apply(highlight_green_max, axis=1)
['none', 'none', 'lightgreen']
['none', 'none', 'lightgreen']
['none', 'lightgreen', 'none']
['lightgreen', 'none', 'none']
Out[16]:
| Araki | Baba | Chou | |
|---|---|---|---|
| index | |||
| 国語 | 75 | 80 | 95 |
| 数学 | 55 | nan | 70 |
| 理科 | 80 | 90 | 85 |
| 社会 | 90 | 30 | 70 |
In [17]:
# 各生徒において一番成績がよかった教科はどれ?
df.style.apply(highlight_green_max, axis=0) # axis=0だと、列全体を見る
['none', 'none', 'none', 'lightgreen']
['none', 'none', 'lightgreen', 'none']
['lightgreen', 'none', 'none', 'none']
Out[17]:
| Araki | Baba | Chou | |
|---|---|---|---|
| index | |||
| 国語 | 75 | 80 | 95 |
| 数学 | 55 | nan | 70 |
| 理科 | 80 | 90 | 85 |
| 社会 | 90 | 30 | 70 |
In [18]:
# axis=1だと、列全体を見る
df.style.apply(highlight_green_max, axis=1)
['none', 'none', 'lightgreen']
['none', 'none', 'lightgreen']
['none', 'lightgreen', 'none']
['lightgreen', 'none', 'none']
Out[18]:
| Araki | Baba | Chou | |
|---|---|---|---|
| index | |||
| 国語 | 75 | 80 | 95 |
| 数学 | 55 | nan | 70 |
| 理科 | 80 | 90 | 85 |
| 社会 | 90 | 30 | 70 |
テーブル全体を見る場合は、axis=Noneにする。
applymapとapplyのまとめ

Quiz
- 以下の場合、applymapとapplyのどちらを使えばよいか考えてみよう
- 値がnullだったら文字色を灰色にする
- その人が一番点数が低い教科の背景色を変える
highlight_max, highlight_min
In [19]:
df.style.highlight_max()
Out[19]:
| Araki | Baba | Chou | |
|---|---|---|---|
| index | |||
| 国語 | 75 | 80 | 95 |
| 数学 | 55 | nan | 70 |
| 理科 | 80 | 90 | 85 |
| 社会 | 90 | 30 | 70 |
In [20]:
df.style.highlight_min()
Out[20]:
| Araki | Baba | Chou | |
|---|---|---|---|
| index | |||
| 国語 | 75 | 80 | 95 |
| 数学 | 55 | nan | 70 |
| 理科 | 80 | 90 | 85 |
| 社会 | 90 | 30 | 70 |
highlight_null
In [21]:
sample_df = pd.read_csv('../data/styling_sample_02.csv')
In [22]:
sample_df
Out[22]:
| A | B | |
|---|---|---|
| 0 | 0.0 | NaN |
| 1 | 10.0 | 80.0 |
| 2 | 20.0 | 60.0 |
| 3 | 30.0 | 40.0 |
| 4 | 40.0 | 20.0 |
| 5 | NaN | 0.0 |
| 6 | 60.0 | -20.0 |
| 7 | 70.0 | -40.0 |
| 8 | 80.0 | -60.0 |
| 9 | 100.0 | -80.0 |
In [23]:
sample_df.style.highlight_null()
Out[23]:
| A | B | |
|---|---|---|
| 0 | 0 | nan |
| 1 | 10 | 80 |
| 2 | 20 | 60 |
| 3 | 30 | 40 |
| 4 | 40 | 20 |
| 5 | nan | 0 |
| 6 | 60 | -20 |
| 7 | 70 | -40 |
| 8 | 80 | -60 |
| 9 | 100 | -80 |
bar
In [24]:
sample_df = pd.read_csv('../data/styling_sample_02.csv')
sample_df.style.bar()
Out[24]:
| A | B | |
|---|---|---|
| 0 | 0 | nan |
| 1 | 10 | 80 |
| 2 | 20 | 60 |
| 3 | 30 | 40 |
| 4 | 40 | 20 |
| 5 | nan | 0 |
| 6 | 60 | -20 |
| 7 | 70 | -40 |
| 8 | 80 | -60 |
| 9 | 100 | -80 |
In [25]:
sample_df.style.bar(align='mid')
Out[25]:
| A | B | |
|---|---|---|
| 0 | 0 | nan |
| 1 | 10 | 80 |
| 2 | 20 | 60 |
| 3 | 30 | 40 |
| 4 | 40 | 20 |
| 5 | nan | 0 |
| 6 | 60 | -20 |
| 7 | 70 | -40 |
| 8 | 80 | -60 |
| 9 | 100 | -80 |
In [26]:
sample_df.style.bar(align='mid', color='skyblue')
Out[26]:
| A | B | |
|---|---|---|
| 0 | 0 | nan |
| 1 | 10 | 80 |
| 2 | 20 | 60 |
| 3 | 30 | 40 |
| 4 | 40 | 20 |
| 5 | nan | 0 |
| 6 | 60 | -20 |
| 7 | 70 | -40 |
| 8 | 80 | -60 |
| 9 | 100 | -80 |
In [27]:
sample_df.style.bar(align='mid', color=['red', 'lightgreen'])
Out[27]:
| A | B | |
|---|---|---|
| 0 | 0 | nan |
| 1 | 10 | 80 |
| 2 | 20 | 60 |
| 3 | 30 | 40 |
| 4 | 40 | 20 |
| 5 | nan | 0 |
| 6 | 60 | -20 |
| 7 | 70 | -40 |
| 8 | 80 | -60 |
| 9 | 100 | -80 |
スタイルを適用する範囲を絞る
In [28]:
sample_df.style.bar(subset=['A'])
Out[28]:
| A | B | |
|---|---|---|
| 0 | 0 | nan |
| 1 | 10 | 80 |
| 2 | 20 | 60 |
| 3 | 30 | 40 |
| 4 | 40 | 20 |
| 5 | nan | 0 |
| 6 | 60 | -20 |
| 7 | 70 | -40 |
| 8 | 80 | -60 |
| 9 | 100 | -80 |
キャプションをつける(set_caption)
In [29]:
df.style.applymap(color_red_akaten).set_caption("期末試験の結果")
Out[29]:
| Araki | Baba | Chou | |
|---|---|---|---|
| index | |||
| 国語 | 75 | 80 | 95 |
| 数学 | 55 | nan | 70 |
| 理科 | 80 | 90 | 85 |
| 社会 | 90 | 30 | 70 |
Excelにスタイル付でエクスポートする
to_excel
openpyxlを別途インストールする必要があります。
In [30]:
df.style.highlight_max()
Out[30]:
| Araki | Baba | Chou | |
|---|---|---|---|
| index | |||
| 国語 | 75 | 80 | 95 |
| 数学 | 55 | nan | 70 |
| 理科 | 80 | 90 | 85 |
| 社会 | 90 | 30 | 70 |
In [31]:
df.style.highlight_max().to_excel('exam_df.xlsx')
In [32]:
sample_df.style.bar()
Out[32]:
| A | B | |
|---|---|---|
| 0 | 0 | nan |
| 1 | 10 | 80 |
| 2 | 20 | 60 |
| 3 | 30 | 40 |
| 4 | 40 | 20 |
| 5 | nan | 0 |
| 6 | 60 | -20 |
| 7 | 70 | -40 |
| 8 | 80 | -60 |
| 9 | 100 | -80 |
In [33]:
sample_df.style.bar().to_excel('bar_df.xlsx')
Stylingの注意点
- まだprovisinal
- GitHubにupしたときはスタイルが消える
- nbviewerを使うとスタイルが保持されるよ
- nbviewer: https://nbviewer.jupyter.org/
- githubリポジトリ上のipynbのurlを指定すると描画してくれる(JavaScriptの動作も反映される)
- このノートブックの場合: https://nbviewer.jupyter.org/github/komo-fr/PyConJP2019_pandas_styling/blob/master/notebooks/styling.ipynb
- nbviewerを使うとスタイルが保持されるよ
- 変なCSSを当てても例外は発生しない
変なCSSを当ててみる
In [34]:
def strange_css(val):
    return 'background-color: yellowwwwww'

# 例外は発生しない
df.style.applymap(strange_css)
Out[34]:
| Araki | Baba | Chou | |
|---|---|---|---|
| index | |||
| 国語 | 75 | 80 | 95 |
| 数学 | 55 | nan | 70 |
| 理科 | 80 | 90 | 85 |
| 社会 | 90 | 30 | 70 |
Appendix
In [36]:
exp_df = pd.read_csv('../data/example.csv')
exp_df
Out[36]:
| ラベル | 教師データ数 | |
|---|---|---|
| 0 | 猫 | 4800 |
| 1 | 犬 | 3000 |
| 2 | ねずみ | 1000 |
| 3 | うさぎ | 500 |
| 4 | キリン | 480 |
| 5 | パンダ | 300 |
| 6 | 蛇 | 70 |
| 7 | トカゲ | 30 |
In [37]:
def is_small_data(val):
    if type(val) == int:
        color = 'red' if val < 100 else 'black'
    else:
        return ''
    return f'color: {color}'
exp_df.style.bar(color='skyblue').applymap(is_small_data)
Out[37]:
| ラベル | 教師データ数 | |
|---|---|---|
| 0 | 猫 | 4800 |
| 1 | 犬 | 3000 |
| 2 | ねずみ | 1000 |
| 3 | うさぎ | 500 |
| 4 | キリン | 480 |
| 5 | パンダ | 300 |
| 6 | 蛇 | 70 |
| 7 | トカゲ | 30 |