Accessing Daymet data with the Planetary Computer STAC API
The Daymet dataset contains daily minimum temperature, maximum temperature, precipitation, shortwave radiation, vapor pressure, snow water equivalent, and day length at 1km resolution for North America, Hawaii, and Puerto Rico. Annual and monthly summaries are also available. The dataset covers the period from January 1, 1980 to December 31, 2020.
Daymet is available in both NetCDF and Zarr format on Azure; this notebook demonstrates using the Planetary Computer STAC API to access to the Zarr data, which can be read into an xarray Dataset. If you just need a subset of the data, we recommend using xarray and Zarr to avoid downloading the full dataset unnecessarily.
Environment setup
import cartopy.crs as ccrs
import fsspec
import matplotlib.pyplot as plt
import pystac
import xarray as xr
import warnings
from dask_gateway import GatewayCluster


warnings.simplefilter("ignore", RuntimeWarning)
Data access
There are 9 STAC Collections representing the unique combination of the 3 regions (na, hi, pr) and 3 frequencies (daily, monthly, annual), each prefixed with the daymet key. For example, daymet-monthly-na or daymet-annual-pr. Each collection contains all the metadata necessary to load the dataset with xarray, and can be read by PySTAC.
Let's start by loading the daily data for Hawaii.
url = "https://planetarycomputer.microsoft.com/api/stac/v1/collections/daymet-daily-hi"
collection = pystac.read_file(url)
collection
<Collection id=daymet-daily-hi>
The collection contains assets, which are links to the root of a Zarr store, and can be opened with xarray.
asset = collection.assets["zarr-https"]
asset
<Asset href=https://daymeteuwest.blob.core.windows.net/daymet-zarr/daily/hi.zarr>
store = fsspec.get_mapper(asset.href)
ds = xr.open_zarr(store, **asset.extra_fields["xarray:open_kwargs"])
ds
<xarray.Dataset>
Dimensions:                  (time: 14965, y: 584, x: 284, nv: 2)
Coordinates:
    lat                      (y, x) float32 dask.array<chunksize=(584, 284), meta=np.ndarray>
    lon                      (y, x) float32 dask.array<chunksize=(584, 284), meta=np.ndarray>
  * time                     (time) datetime64[ns] 1980-01-01T12:00:00 ... 20...
  * x                        (x) float32 -5.802e+06 -5.801e+06 ... -5.519e+06
  * y                        (y) float32 -3.9e+04 -4e+04 ... -6.21e+05 -6.22e+05
Dimensions without coordinates: nv
Data variables:
    dayl                     (time, y, x) float32 dask.array<chunksize=(365, 584, 284), meta=np.ndarray>
    lambert_conformal_conic  int16 ...
    prcp                     (time, y, x) float32 dask.array<chunksize=(365, 584, 284), meta=np.ndarray>
    srad                     (time, y, x) float32 dask.array<chunksize=(365, 584, 284), meta=np.ndarray>
    swe                      (time, y, x) float32 dask.array<chunksize=(365, 584, 284), meta=np.ndarray>
    time_bnds                (time, nv) datetime64[ns] dask.array<chunksize=(365, 2), meta=np.ndarray>
    tmax                     (time, y, x) float32 dask.array<chunksize=(365, 584, 284), meta=np.ndarray>
    tmin                     (time, y, x) float32 dask.array<chunksize=(365, 584, 284), meta=np.ndarray>
    vp                       (time, y, x) float32 dask.array<chunksize=(365, 584, 284), meta=np.ndarray>
    yearday                  (time) int16 dask.array<chunksize=(365,), meta=np.ndarray>
Attributes:
    Conventions:       CF-1.6
    Version_data:      Daymet Data Version 4.0
    Version_software:  Daymet Software Version 4.0
    citation:          Please see http://daymet.ornl.gov/ for current Daymet ...
    references:        Please see http://daymet.ornl.gov/ for current informa...
    source:            Daymet Software Version 4.0
start_year: 1980- time: 14965
- y: 584
- x: 284
- nv: 2
- lat(y, x)float32dask.array<chunksize=(584, 284), meta=np.ndarray>
- long_name :
- latitude coordinate
- standard_name :
- latitude
- units :
- degrees_north
Array Chunk Bytes 647.88 kiB 647.88 kiB Shape (584, 284) (584, 284) Count 2 Tasks 1 Chunks Type float32 numpy.ndarray - lon(y, x)float32dask.array<chunksize=(584, 284), meta=np.ndarray>
- long_name :
- longitude coordinate
- standard_name :
- longitude
- units :
- degrees_east
Array Chunk Bytes 647.88 kiB 647.88 kiB Shape (584, 284) (584, 284) Count 2 Tasks 1 Chunks Type float32 numpy.ndarray - time(time)datetime64[ns]1980-01-01T12:00:00 ... 2020-12-...
- bounds :
- time_bnds
- long_name :
- 24-hour day based on local time
- standard_name :
- time
array(['1980-01-01T12:00:00.000000000', '1980-01-02T12:00:00.000000000', '1980-01-03T12:00:00.000000000', ..., '2020-12-28T12:00:00.000000000', '2020-12-29T12:00:00.000000000', '2020-12-30T12:00:00.000000000'], dtype='datetime64[ns]') - x(x)float32-5.802e+06 ... -5.519e+06
- long_name :
- x coordinate of projection
- standard_name :
- projection_x_coordinate
- units :
- m
array([-5802250., -5801250., -5800250., ..., -5521250., -5520250., -5519250.], dtype=float32) - y(y)float32-3.9e+04 -4e+04 ... -6.22e+05
- long_name :
- y coordinate of projection
- standard_name :
- projection_y_coordinate
- units :
- m
array([ -39000.,  -40000.,  -41000., ..., -620000., -621000., -622000.],
      dtype=float32)
- dayl(time, y, x)float32dask.array<chunksize=(365, 584, 284), meta=np.ndarray>
- cell_methods :
- area: mean
- grid_mapping :
- lambert_conformal_conic
- long_name :
- daylength
- units :
- s
Array Chunk Bytes 9.25 GiB 230.93 MiB Shape (14965, 584, 284) (365, 584, 284) Count 42 Tasks 41 Chunks Type float32 numpy.ndarray - lambert_conformal_conic()int16...
- false_easting :
- 0.0
- false_northing :
- 0.0
- grid_mapping_name :
- lambert_conformal_conic
- inverse_flattening :
- 298.257223563
- latitude_of_projection_origin :
- 42.5
- longitude_of_central_meridian :
- -100.0
- semi_major_axis :
- 6378137.0
- standard_parallel :
- [25.0, 60.0]
array(-32767, dtype=int16)
- prcp(time, y, x)float32dask.array<chunksize=(365, 584, 284), meta=np.ndarray>
- cell_methods :
- area: mean time: sum
- grid_mapping :
- lambert_conformal_conic
- long_name :
- daily total precipitation
- units :
- mm/day
Array Chunk Bytes 9.25 GiB 230.93 MiB Shape (14965, 584, 284) (365, 584, 284) Count 42 Tasks 41 Chunks Type float32 numpy.ndarray - srad(time, y, x)float32dask.array<chunksize=(365, 584, 284), meta=np.ndarray>
- cell_methods :
- area: mean time: mean
- grid_mapping :
- lambert_conformal_conic
- long_name :
- daylight average incident shortwave radiation
- units :
- W/m2
Array Chunk Bytes 9.25 GiB 230.93 MiB Shape (14965, 584, 284) (365, 584, 284) Count 42 Tasks 41 Chunks Type float32 numpy.ndarray - swe(time, y, x)float32dask.array<chunksize=(365, 584, 284), meta=np.ndarray>
- cell_methods :
- area: mean time: mean
- grid_mapping :
- lambert_conformal_conic
- long_name :
- snow water equivalent
- units :
- kg/m2
Array Chunk Bytes 9.25 GiB 230.93 MiB Shape (14965, 584, 284) (365, 584, 284) Count 42 Tasks 41 Chunks Type float32 numpy.ndarray - time_bnds(time, nv)datetime64[ns]dask.array<chunksize=(365, 2), meta=np.ndarray>
Array Chunk Bytes 233.83 kiB 5.70 kiB Shape (14965, 2) (365, 2) Count 42 Tasks 41 Chunks Type datetime64[ns] numpy.ndarray - tmax(time, y, x)float32dask.array<chunksize=(365, 584, 284), meta=np.ndarray>
- cell_methods :
- area: mean time: maximum
- grid_mapping :
- lambert_conformal_conic
- long_name :
- daily maximum temperature
- units :
- degrees C
Array Chunk Bytes 9.25 GiB 230.93 MiB Shape (14965, 584, 284) (365, 584, 284) Count 42 Tasks 41 Chunks Type float32 numpy.ndarray - tmin(time, y, x)float32dask.array<chunksize=(365, 584, 284), meta=np.ndarray>
- cell_methods :
- area: mean time: minimum
- grid_mapping :
- lambert_conformal_conic
- long_name :
- daily minimum temperature
- units :
- degrees C
Array Chunk Bytes 9.25 GiB 230.93 MiB Shape (14965, 584, 284) (365, 584, 284) Count 42 Tasks 41 Chunks Type float32 numpy.ndarray - vp(time, y, x)float32dask.array<chunksize=(365, 584, 284), meta=np.ndarray>
- cell_methods :
- area: mean time: mean
- grid_mapping :
- lambert_conformal_conic
- long_name :
- daily average vapor pressure
- units :
- Pa
Array Chunk Bytes 9.25 GiB 230.93 MiB Shape (14965, 584, 284) (365, 584, 284) Count 42 Tasks 41 Chunks Type float32 numpy.ndarray - yearday(time)int16dask.array<chunksize=(365,), meta=np.ndarray>
- long_name :
- day of year (DOY) starting with day 1 on Januaray 1st
Array Chunk Bytes 29.23 kiB 730 B Shape (14965,) (365,) Count 42 Tasks 41 Chunks Type int16 numpy.ndarray
- Conventions :
- CF-1.6
- Version_data :
- Daymet Data Version 4.0
- Version_software :
- Daymet Software Version 4.0
- citation :
- Please see http://daymet.ornl.gov/ for current Daymet data citation information
- references :
- Please see http://daymet.ornl.gov/ for current information on Daymet references
- source :
- Daymet Software Version 4.0
- start_year :
- 1980
Working with the data
Using xarray, we can quickly select subsets of the data, perform an aggregation, and plot the result. For example, we'll plot the average of the maximum temperature for the year 2020. We can tell xarray to keep the attributes from the Dataset on the resulting DataArray.
xr.set_options(keep_attrs=True)

avg_tmax = ds.sel(time="2020")["tmax"].mean(dim="time")
avg_tmax
<xarray.DataArray 'tmax' (y: 584, x: 284)>
dask.array<mean_agg-aggregate, shape=(584, 284), dtype=float32, chunksize=(584, 284), chunktype=numpy.ndarray>
Coordinates:
    lat      (y, x) float32 dask.array<chunksize=(584, 284), meta=np.ndarray>
    lon      (y, x) float32 dask.array<chunksize=(584, 284), meta=np.ndarray>
  * x        (x) float32 -5.802e+06 -5.801e+06 -5.8e+06 ... -5.52e+06 -5.519e+06
  * y        (y) float32 -3.9e+04 -4e+04 -4.1e+04 ... -6.21e+05 -6.22e+05
Attributes:
    cell_methods:  area: mean time: maximum
    grid_mapping:  lambert_conformal_conic
    long_name:     daily maximum temperature
units: degrees C- y: 584
- x: 284
- dask.array<chunksize=(584, 284), meta=np.ndarray>
Array Chunk Bytes 647.88 kiB 647.88 kiB Shape (584, 284) (584, 284) Count 45 Tasks 1 Chunks Type float32 numpy.ndarray - lat(y, x)float32dask.array<chunksize=(584, 284), meta=np.ndarray>
- long_name :
- latitude coordinate
- standard_name :
- latitude
- units :
- degrees_north
Array Chunk Bytes 647.88 kiB 647.88 kiB Shape (584, 284) (584, 284) Count 2 Tasks 1 Chunks Type float32 numpy.ndarray - lon(y, x)float32dask.array<chunksize=(584, 284), meta=np.ndarray>
- long_name :
- longitude coordinate
- standard_name :
- longitude
- units :
- degrees_east
Array Chunk Bytes 647.88 kiB 647.88 kiB Shape (584, 284) (584, 284) Count 2 Tasks 1 Chunks Type float32 numpy.ndarray - x(x)float32-5.802e+06 ... -5.519e+06
- long_name :
- x coordinate of projection
- standard_name :
- projection_x_coordinate
- units :
- m
array([-5802250., -5801250., -5800250., ..., -5521250., -5520250., -5519250.], dtype=float32) - y(y)float32-3.9e+04 -4e+04 ... -6.22e+05
- long_name :
- y coordinate of projection
- standard_name :
- projection_y_coordinate
- units :
- m
array([ -39000.,  -40000.,  -41000., ..., -620000., -621000., -622000.],
      dtype=float32)
- cell_methods :
- area: mean time: maximum
- grid_mapping :
- lambert_conformal_conic
- long_name :
- daily maximum temperature
- units :
- degrees C
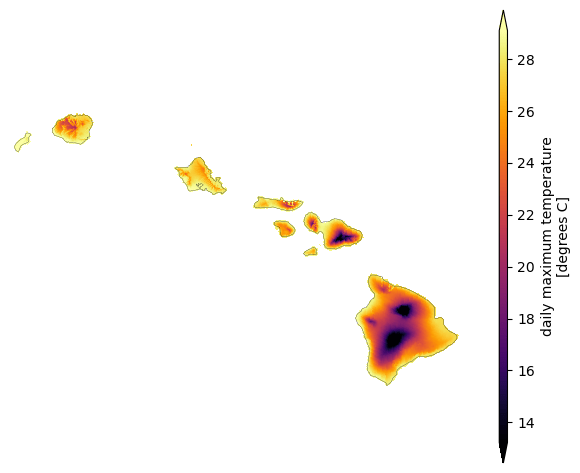
Pull the Coordinate Reference System (CRS) out from the dataset attributes and plot the variable in a geographic projection.
lcc = ds.variables["lambert_conformal_conic"].attrs

prj_kwargs = dict(
    central_latitude=lcc["latitude_of_projection_origin"],
    central_longitude=lcc["longitude_of_central_meridian"],
    standard_parallels=(lcc["standard_parallel"]),
)
crs = ccrs.LambertConformal(**prj_kwargs)

fig = plt.figure(figsize=(10, 6), dpi=100)
ax = plt.axes(projection=ccrs.PlateCarree(), frameon=False)
avg_tmax.plot(
    ax=ax, transform=crs, cmap="inferno", cbar_kwargs={"aspect": 50}, robust=True
)
ax.coastlines(linewidth=0.2)
plt.show()
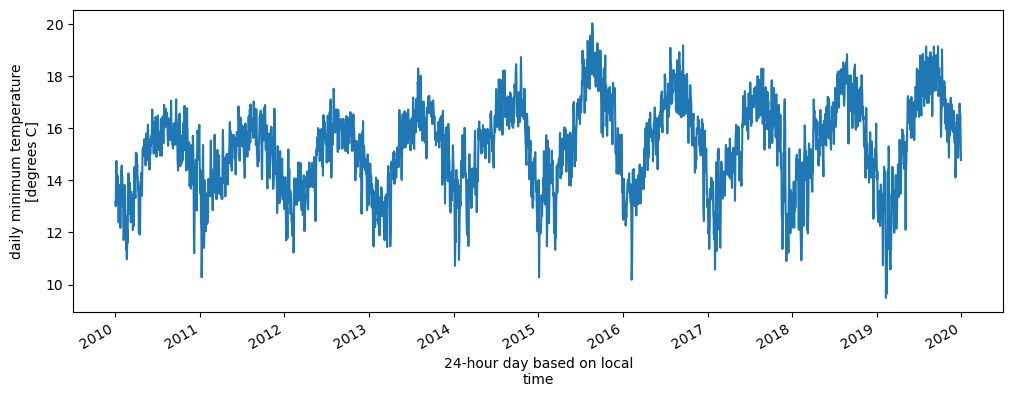
Next, we can visualize the timeseries of the minimum temperature over the past decade.
fig, ax = plt.subplots(figsize=(12, 4), dpi=100)
ds.sel(time=slice("2010", "2019"))["tmin"].mean(dim=["x", "y"]).plot(ax=ax);
Chunking
Each of the datasets is chunked to allow for parallel and out-of-core or distributed processing with Dask. The different frequencies (daily, monthly, annual) are chunked so that each year is in a single chunk. The different regions in the x and y coordinates are chunked so that no single chunk is larger than about 250 MB, which is primarily important for the na region.
ds["prcp"]
<xarray.DataArray 'prcp' (time: 14965, y: 584, x: 284)>
dask.array<open_dataset-595ca69f45056a9390cc796740b685d6prcp, shape=(14965, 584, 284), dtype=float32, chunksize=(365, 584, 284), chunktype=numpy.ndarray>
Coordinates:
    lat      (y, x) float32 dask.array<chunksize=(584, 284), meta=np.ndarray>
    lon      (y, x) float32 dask.array<chunksize=(584, 284), meta=np.ndarray>
  * time     (time) datetime64[ns] 1980-01-01T12:00:00 ... 2020-12-30T12:00:00
  * x        (x) float32 -5.802e+06 -5.801e+06 -5.8e+06 ... -5.52e+06 -5.519e+06
  * y        (y) float32 -3.9e+04 -4e+04 -4.1e+04 ... -6.21e+05 -6.22e+05
Attributes:
    cell_methods:  area: mean time: sum
    grid_mapping:  lambert_conformal_conic
    long_name:     daily total precipitation
units: mm/day- time: 14965
- y: 584
- x: 284
- dask.array<chunksize=(365, 584, 284), meta=np.ndarray>
Array Chunk Bytes 9.25 GiB 230.93 MiB Shape (14965, 584, 284) (365, 584, 284) Count 42 Tasks 41 Chunks Type float32 numpy.ndarray - lat(y, x)float32dask.array<chunksize=(584, 284), meta=np.ndarray>
- long_name :
- latitude coordinate
- standard_name :
- latitude
- units :
- degrees_north
Array Chunk Bytes 647.88 kiB 647.88 kiB Shape (584, 284) (584, 284) Count 2 Tasks 1 Chunks Type float32 numpy.ndarray - lon(y, x)float32dask.array<chunksize=(584, 284), meta=np.ndarray>
- long_name :
- longitude coordinate
- standard_name :
- longitude
- units :
- degrees_east
Array Chunk Bytes 647.88 kiB 647.88 kiB Shape (584, 284) (584, 284) Count 2 Tasks 1 Chunks Type float32 numpy.ndarray - time(time)datetime64[ns]1980-01-01T12:00:00 ... 2020-12-...
- bounds :
- time_bnds
- long_name :
- 24-hour day based on local time
- standard_name :
- time
array(['1980-01-01T12:00:00.000000000', '1980-01-02T12:00:00.000000000', '1980-01-03T12:00:00.000000000', ..., '2020-12-28T12:00:00.000000000', '2020-12-29T12:00:00.000000000', '2020-12-30T12:00:00.000000000'], dtype='datetime64[ns]') - x(x)float32-5.802e+06 ... -5.519e+06
- long_name :
- x coordinate of projection
- standard_name :
- projection_x_coordinate
- units :
- m
array([-5802250., -5801250., -5800250., ..., -5521250., -5520250., -5519250.], dtype=float32) - y(y)float32-3.9e+04 -4e+04 ... -6.22e+05
- long_name :
- y coordinate of projection
- standard_name :
- projection_y_coordinate
- units :
- m
array([ -39000.,  -40000.,  -41000., ..., -620000., -621000., -622000.],
      dtype=float32)
- cell_methods :
- area: mean time: sum
- grid_mapping :
- lambert_conformal_conic
- long_name :
- daily total precipitation
- units :
- mm/day
So our prcp array has a shape (14965, 584, 284) where each chunk is (365, 584, 284). Examining the store for monthly North America, we see the chunks each have size (12, 2000, 2000).
na_url = (
    "https://planetarycomputer.microsoft.com/api/stac/v1/collections/"
    "daymet-monthly-na"
)
na_collection = pystac.read_file(na_url)
na_asset = na_collection.assets["zarr-https"]

na_store = fsspec.get_mapper(na_asset.href)
na = xr.open_zarr(na_store, **na_asset.extra_fields["xarray:open_kwargs"])

na["prcp"]
<xarray.DataArray 'prcp' (time: 492, y: 8075, x: 7814)>
dask.array<open_dataset-ad827208ca8df83aa595cc31d9e59422prcp, shape=(492, 8075, 7814), dtype=float32, chunksize=(12, 2000, 2000), chunktype=numpy.ndarray>
Coordinates:
    lat      (y, x) float32 dask.array<chunksize=(2000, 2000), meta=np.ndarray>
    lon      (y, x) float32 dask.array<chunksize=(2000, 2000), meta=np.ndarray>
  * time     (time) datetime64[ns] 1980-01-16T12:00:00 ... 2020-12-16
  * x        (x) float32 -4.56e+06 -4.559e+06 -4.558e+06 ... 3.252e+06 3.253e+06
  * y        (y) float32 4.984e+06 4.983e+06 4.982e+06 ... -3.089e+06 -3.09e+06
Attributes:
    cell_methods:  area: mean time: sum within days time: sum over days
    grid_mapping:  lambert_conformal_conic
    long_name:     monthly total precipitation
units: mm- time: 492
- y: 8075
- x: 7814
- dask.array<chunksize=(12, 2000, 2000), meta=np.ndarray>
Array Chunk Bytes 115.65 GiB 183.11 MiB Shape (492, 8075, 7814) (12, 2000, 2000) Count 821 Tasks 820 Chunks Type float32 numpy.ndarray - lat(y, x)float32dask.array<chunksize=(2000, 2000), meta=np.ndarray>
- long_name :
- latitude coordinate
- standard_name :
- latitude
- units :
- degrees_north
Array Chunk Bytes 240.70 MiB 15.26 MiB Shape (8075, 7814) (2000, 2000) Count 21 Tasks 20 Chunks Type float32 numpy.ndarray - lon(y, x)float32dask.array<chunksize=(2000, 2000), meta=np.ndarray>
- long_name :
- longitude coordinate
- standard_name :
- longitude
- units :
- degrees_east
Array Chunk Bytes 240.70 MiB 15.26 MiB Shape (8075, 7814) (2000, 2000) Count 21 Tasks 20 Chunks Type float32 numpy.ndarray - time(time)datetime64[ns]1980-01-16T12:00:00 ... 2020-12-16
- bounds :
- time_bnds
- long_name :
- 24-hour day based on local time
- standard_name :
- time
array(['1980-01-16T12:00:00.000000000', '1980-02-15T12:00:00.000000000', '1980-03-16T12:00:00.000000000', ..., '2020-10-16T12:00:00.000000000', '2020-11-16T00:00:00.000000000', '2020-12-16T00:00:00.000000000'], dtype='datetime64[ns]') - x(x)float32-4.56e+06 -4.559e+06 ... 3.253e+06
- long_name :
- x coordinate of projection
- standard_name :
- projection_x_coordinate
- units :
- m
array([-4560250., -4559250., -4558250., ..., 3250750., 3251750., 3252750.], dtype=float32) - y(y)float324.984e+06 4.983e+06 ... -3.09e+06
- long_name :
- y coordinate of projection
- standard_name :
- projection_y_coordinate
- units :
- m
array([ 4984000.,  4983000.,  4982000., ..., -3088000., -3089000., -3090000.],
      dtype=float32)
- cell_methods :
- area: mean time: sum within days time: sum over days
- grid_mapping :
- lambert_conformal_conic
- long_name :
- monthly total precipitation
- units :
- mm
Analyze and plot North America
North America is considerably larger than the Hawaii or Puerto Rico dataset, so let's downsample a bit for quicker plotting. We'll also start up a Dask cluster to do reads and processing in parallel. If you're running this on the Hub, use the following URL in the Dask Extension to see progress. If you're not running it on the hub, you can use a distributed.LocalCluster to achieve the same result (but it will take longer, since it's running on a single machine).
cluster = GatewayCluster()
cluster.scale(16)
client = cluster.get_client()
print(cluster.dashboard_link)
https://pcc-staging.westeurope.cloudapp.azure.com/compute/services/dask-gateway/clusters/staging.02a98b3f7f434728b104ebc8f04617a4/status
na_prcp = (
    na["prcp"]
    .sel(time="2020-06")
    .coarsen(dim={"x": 4, "y": 4}, boundary="trim")
    .mean()
    .load()
)
First, grab monthly total precipitation from June 2020 and plot it over the continent to get a sense of the distribution.
fig, ax = plt.subplots(
    figsize=(10, 6), dpi=100, subplot_kw=dict(projection=crs, frameon=False)
)
na_prcp.plot(
    ax=ax, transform=crs, cmap="YlGnBu", cbar_kwargs={"aspect": 50}, robust=True
)
ax.set_extent([-145, -58, 5, 84])
ax.coastlines(linewidth=0.2)
plt.show()

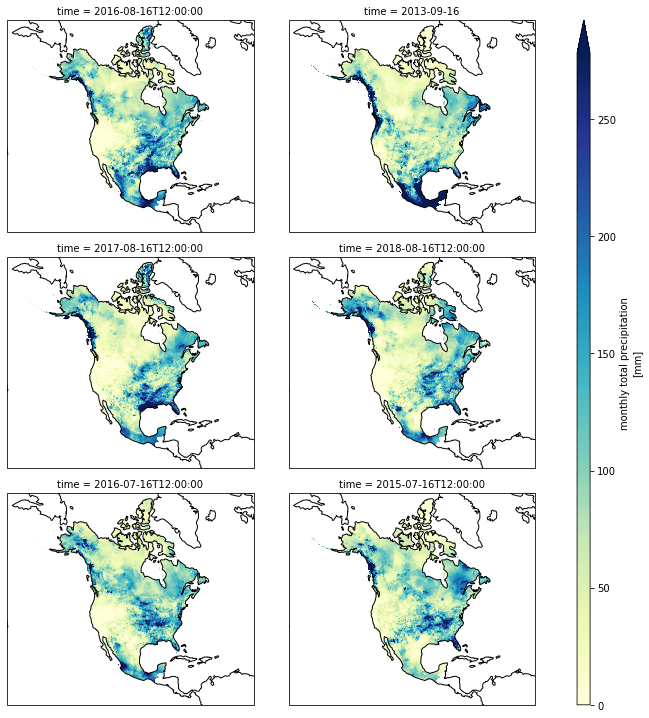
The dataset contains a lot of months. Let's compute the average precipition over the whole continent for each month in the last 10 years. From that, we'll grab the top 6 wettest months and plot them.
%%time

total_avg_prcp = na["prcp"].isel(time=slice(-12 * 10, None)).mean(["x", "y"]).load()
df = total_avg_prcp.to_dataframe()
top6 = df.sort_values("prcp", ascending=False).head(6)
top6
CPU times: user 68 ms, sys: 16 ms, total: 84 ms
Wall time: 13.1 s
| prcp | |
|---|---|
| time | |
| 2016-08-16 12:00:00 | 91.286697 |
| 2013-09-16 00:00:00 | 87.022514 |
| 2017-08-16 12:00:00 | 84.558136 |
| 2018-08-16 12:00:00 | 83.572380 |
| 2016-07-16 12:00:00 | 83.075722 |
| 2015-07-16 12:00:00 | 82.569794 |
%%time

wettest_months = top6.index.to_list()
da = (
    na["prcp"]
    .sel(time=wettest_months)
    .coarsen(dim={"x": 8, "y": 8}, boundary="trim")
    .mean()
)
p = da.plot(
    col="time",
    col_wrap=2,
    figsize=(12, 10),
    cmap="YlGnBu",
    robust=True,
    subplot_kws=dict(projection=crs),
    cbar_kwargs={"aspect": 50},
)

for ax in p.axes.flat:
    ax.set_extent([-145, -58, 5, 84])
    ax.coastlines()
CPU times: user 1.26 s, sys: 167 ms, total: 1.42 s
Wall time: 8.13 s