Assess income level predictions on adult census data
This notebook demonstrates the use of the responsibleai API to assess a model trained on census data. It walks through the API calls necessary to create a widget with model analysis insights, then guides a visual analysis of the model.
Launch Responsible AI Toolbox
The following section examines the code necessary to create datasets and a model. It then generates insights using the responsibleai API that can be visually analyzed.
Train a Model
The following section can be skipped. It loads a dataset and trains a model for illustrative purposes.
import zipfile

from sklearn.pipeline import Pipeline
from sklearn.impute import SimpleImputer
from sklearn.preprocessing import StandardScaler, OneHotEncoder
from sklearn.compose import ColumnTransformer

import pandas as pd
from lightgbm import LGBMClassifier
First, load the census dataset and specify the different types of features. Compose a pipeline which contains a preprocessor and estimator.
from raiutils.dataset import fetch_dataset
from sklearn.pipeline import Pipeline
from sklearn.impute import SimpleImputer
from sklearn.preprocessing import StandardScaler, OneHotEncoder
from sklearn.compose import ColumnTransformer

def split_label(dataset, target_feature):
    X = dataset.drop([target_feature], axis=1)
    y = dataset[[target_feature]]
    return X, y

def create_classification_pipeline(X):
    pipe_cfg = {
        'num_cols': X.dtypes[X.dtypes == 'int64'].index.values.tolist(),
        'cat_cols': X.dtypes[X.dtypes == 'object'].index.values.tolist(),
    }
    num_pipe = Pipeline([
        ('num_imputer', SimpleImputer(strategy='median')),
        ('num_scaler', StandardScaler())
    ])
    cat_pipe = Pipeline([
        ('cat_imputer', SimpleImputer(strategy='constant', fill_value='?')),
        ('cat_encoder', OneHotEncoder(handle_unknown='ignore', sparse=False))
    ])
    feat_pipe = ColumnTransformer([
        ('num_pipe', num_pipe, pipe_cfg['num_cols']),
        ('cat_pipe', cat_pipe, pipe_cfg['cat_cols'])
    ])

    # Append classifier to preprocessing pipeline.
    # Now we have a full prediction pipeline.
    pipeline = Pipeline(steps=[('preprocessor', feat_pipe),
                               ('model', LGBMClassifier(random_state=0))])

    return pipeline

outdirname = 'responsibleai.12.28.21'
zipfilename = outdirname + '.zip'

fetch_dataset('https://publictestdatasets.blob.core.windows.net/data/' + zipfilename, zipfilename)

with zipfile.ZipFile(zipfilename, 'r') as unzip:
    unzip.extractall('.')

target_feature = 'income'
categorical_features = ['workclass', 'education', 'marital-status',
                        'occupation', 'relationship', 'race', 'gender', 'native-country']


train_data = pd.read_csv('adult-train.csv', skipinitialspace=True)
test_data = pd.read_csv('adult-test.csv', skipinitialspace=True)

X_train_original, y_train = split_label(train_data, target_feature)
X_test_original, y_test = split_label(test_data, target_feature)

pipeline = create_classification_pipeline(X_train_original)

y_train = y_train[target_feature].to_numpy()
y_test = y_test[target_feature].to_numpy()


# Take 500 samples from the test data
test_data_sample = test_data.sample(n=500, random_state=5)
Train the classification pipeline composed in the previous cell on the training data.
model = pipeline.fit(X_train_original, y_train)
Create Model and Data Insights
from raiwidgets import ResponsibleAIDashboard
from responsibleai import RAIInsights
To use Responsible AI Toolbox, initialize a RAIInsights object upon which different components can be loaded.
RAIInsights accepts the model, the full dataset, the test dataset, the target feature string, the task type string, and a list of strings of categorical feature names as its arguments.
rai_insights = RAIInsights(model, train_data, test_data_sample, target_feature, 'classification',
                           categorical_features=categorical_features)
Add the components of the toolbox that are focused on model assessment.
# Interpretability
rai_insights.explainer.add()
# Error Analysis
rai_insights.error_analysis.add()
# Counterfactuals: accepts total number of counterfactuals to generate, the label that they should have, and a list of
                # strings of categorical feature names
rai_insights.counterfactual.add(total_CFs=10, desired_class='opposite')
Once all the desired components have been loaded, compute insights on the test set.
rai_insights.compute()
Compose some cohorts which can be injected into the ResponsibleAIDashboard.
from raiwidgets.cohort import Cohort, CohortFilter, CohortFilterMethods

# Cohort on age and hours-per-week features in the dataset
cohort_filter_age = CohortFilter(
    method=CohortFilterMethods.METHOD_LESS,
    arg=[65],
    column='age')
cohort_filter_hours_per_week = CohortFilter(
    method=CohortFilterMethods.METHOD_GREATER,
    arg=[40],
    column='hours-per-week')

user_cohort_age_and_hours_per_week = Cohort(name='Cohort Age and Hours-Per-Week')
user_cohort_age_and_hours_per_week.add_cohort_filter(cohort_filter_age)
user_cohort_age_and_hours_per_week.add_cohort_filter(cohort_filter_hours_per_week)

# Cohort on marital-status feature in the dataset
cohort_filter_marital_status = CohortFilter(
    method=CohortFilterMethods.METHOD_INCLUDES,
    arg=["Never-married", "Divorced"],
    column='marital-status')

user_cohort_marital_status = Cohort(name='Cohort Marital-Status')
user_cohort_marital_status.add_cohort_filter(cohort_filter_marital_status)

# Cohort on index of the row in the dataset
cohort_filter_index = CohortFilter(
    method=CohortFilterMethods.METHOD_LESS,
    arg=[20],
    column='Index')

user_cohort_index = Cohort(name='Cohort Index')
user_cohort_index.add_cohort_filter(cohort_filter_index)

# Cohort on predicted target value
cohort_filter_predicted_y = CohortFilter(
    method=CohortFilterMethods.METHOD_INCLUDES,
    arg=['>50K'],
    column='Predicted Y')

user_cohort_predicted_y = Cohort(name='Cohort Predicted Y')
user_cohort_predicted_y.add_cohort_filter(cohort_filter_predicted_y)

# Cohort on predicted target value
cohort_filter_true_y = CohortFilter(
    method=CohortFilterMethods.METHOD_INCLUDES,
    arg=['>50K'],
    column='True Y')

user_cohort_true_y = Cohort(name='Cohort True Y')
user_cohort_true_y.add_cohort_filter(cohort_filter_true_y)

cohort_list = [user_cohort_age_and_hours_per_week,
               user_cohort_marital_status,
               user_cohort_index,
               user_cohort_predicted_y,
               user_cohort_true_y]
Finally, visualize and explore the model insights. Use the resulting widget or follow the link to view this in a new tab.
ResponsibleAIDashboard(rai_insights, cohort_list=cohort_list)
Assess Your Model
Aggregate Analysis
The Error Analysis component is displayed at the top of the dashboard widget. To visualize how error is broken down across cohorts, use the tree map view to understand how it filters through the nodes.
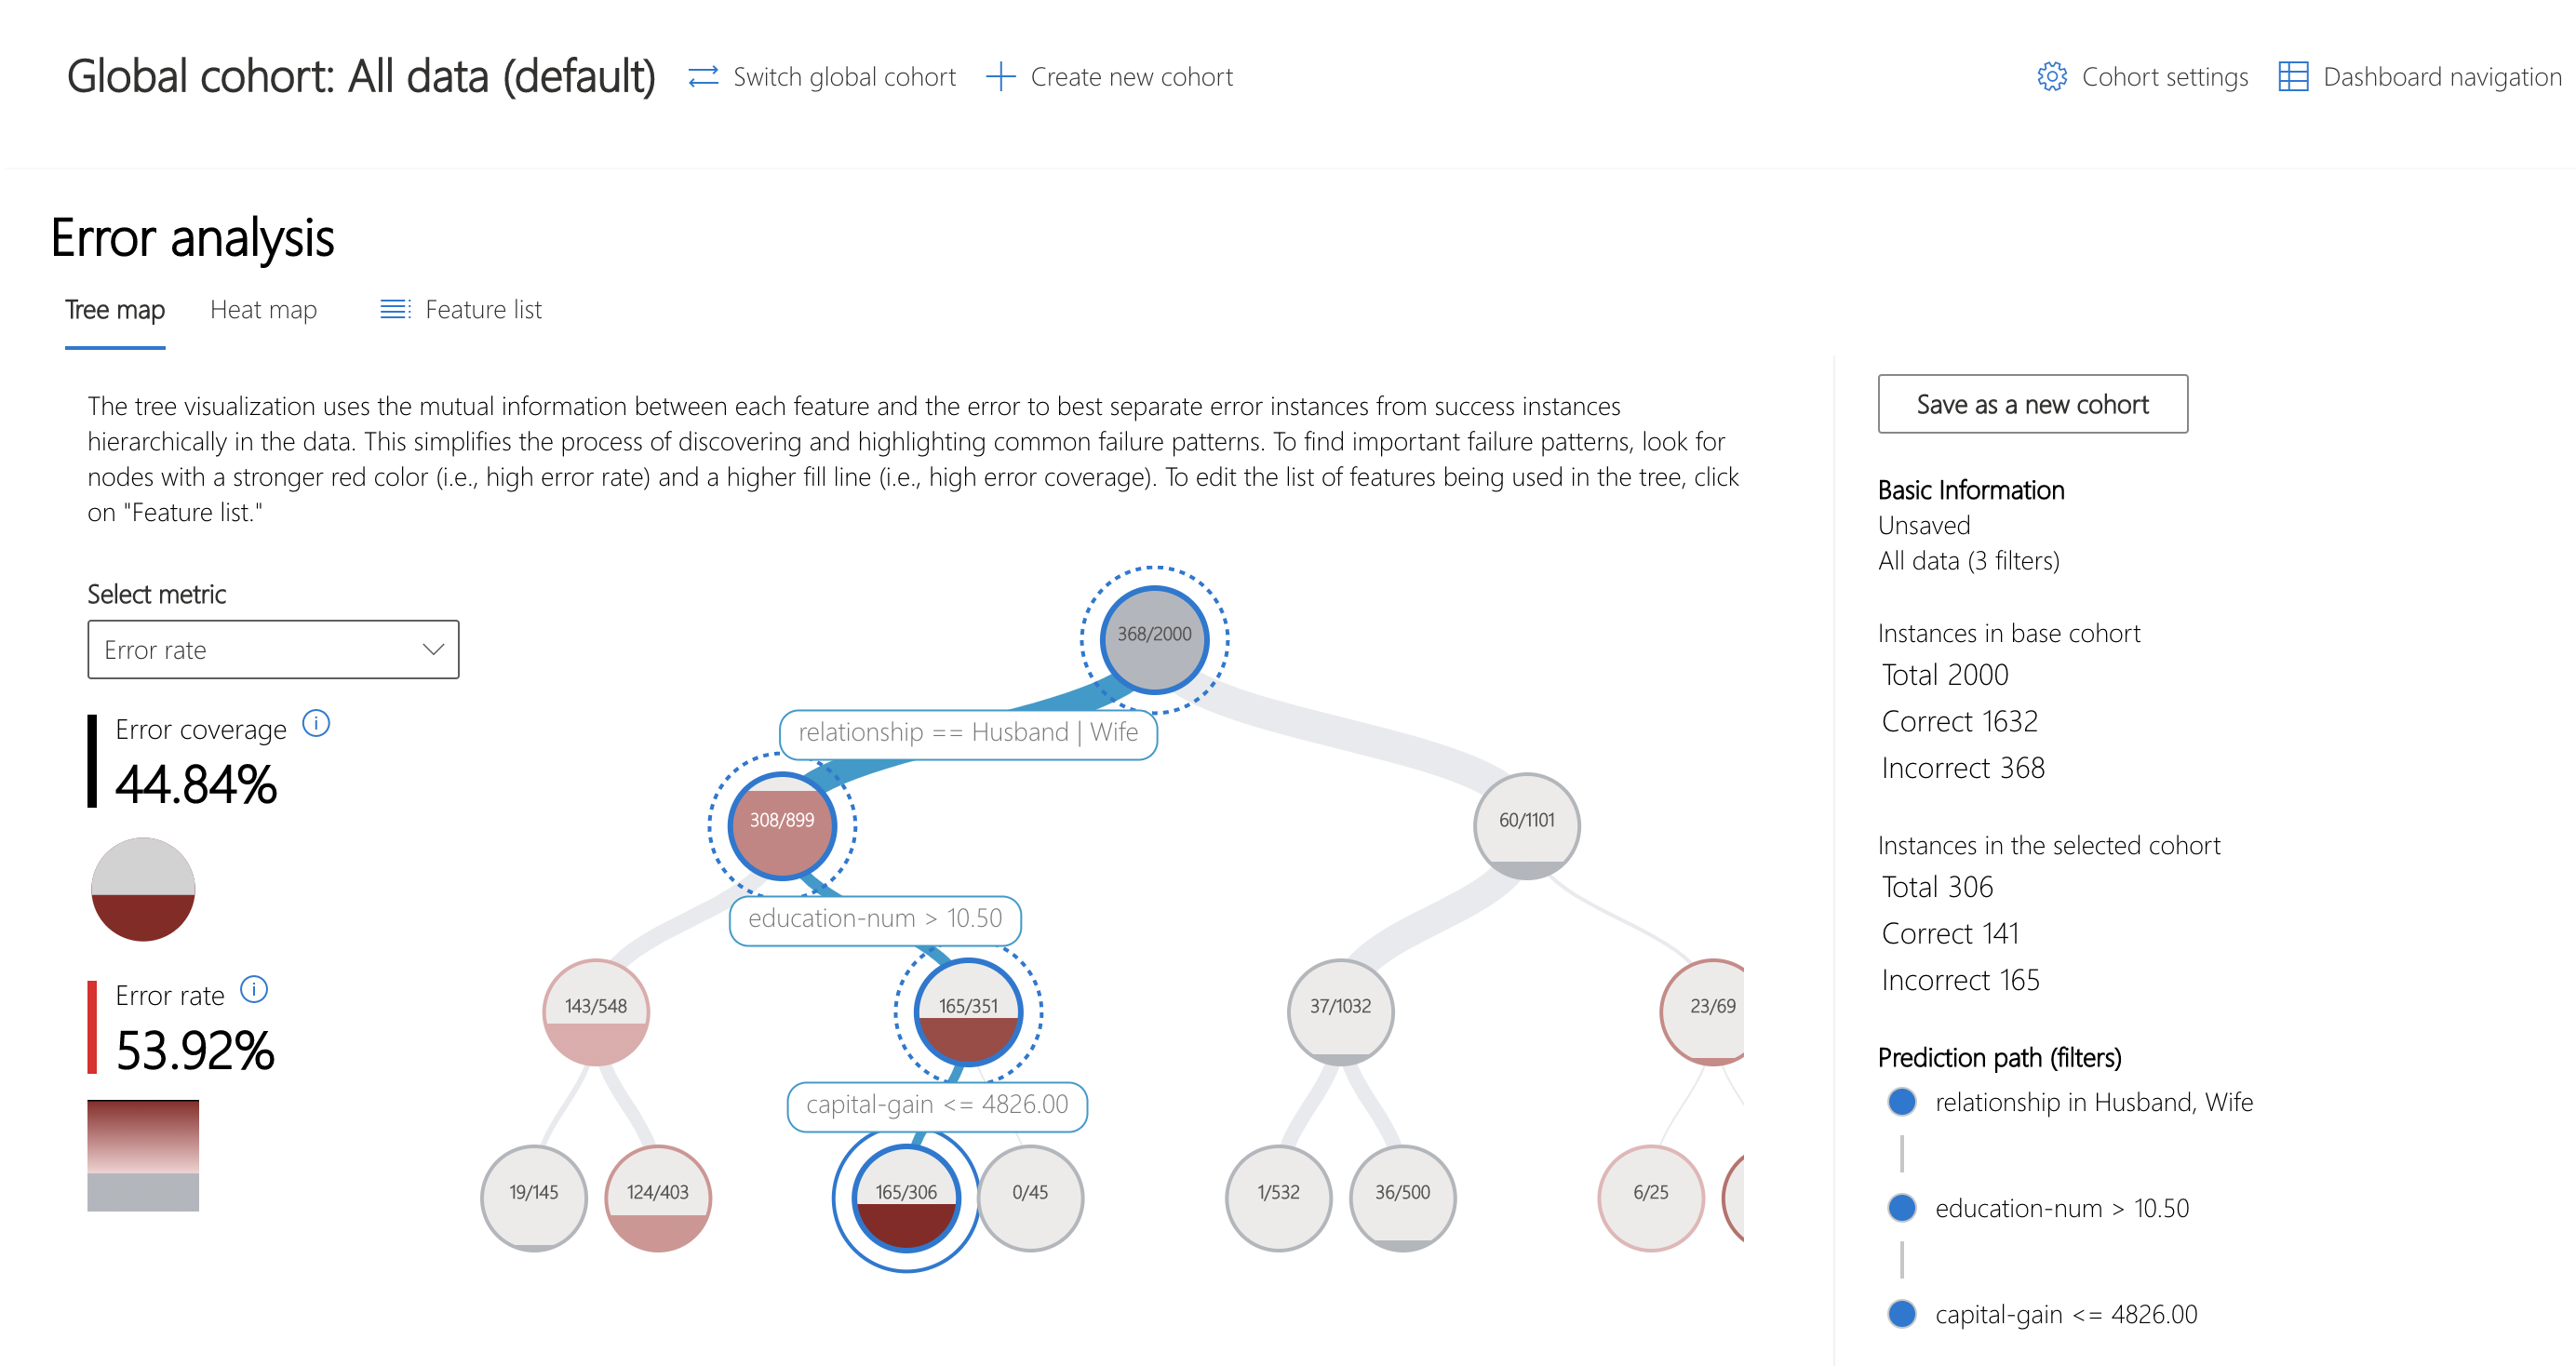
Over 40% of the error in this model is concentrated in datapoints of people who are married, have higher education and minimal capital gain.
Let's see what else we can discover about this cohort.
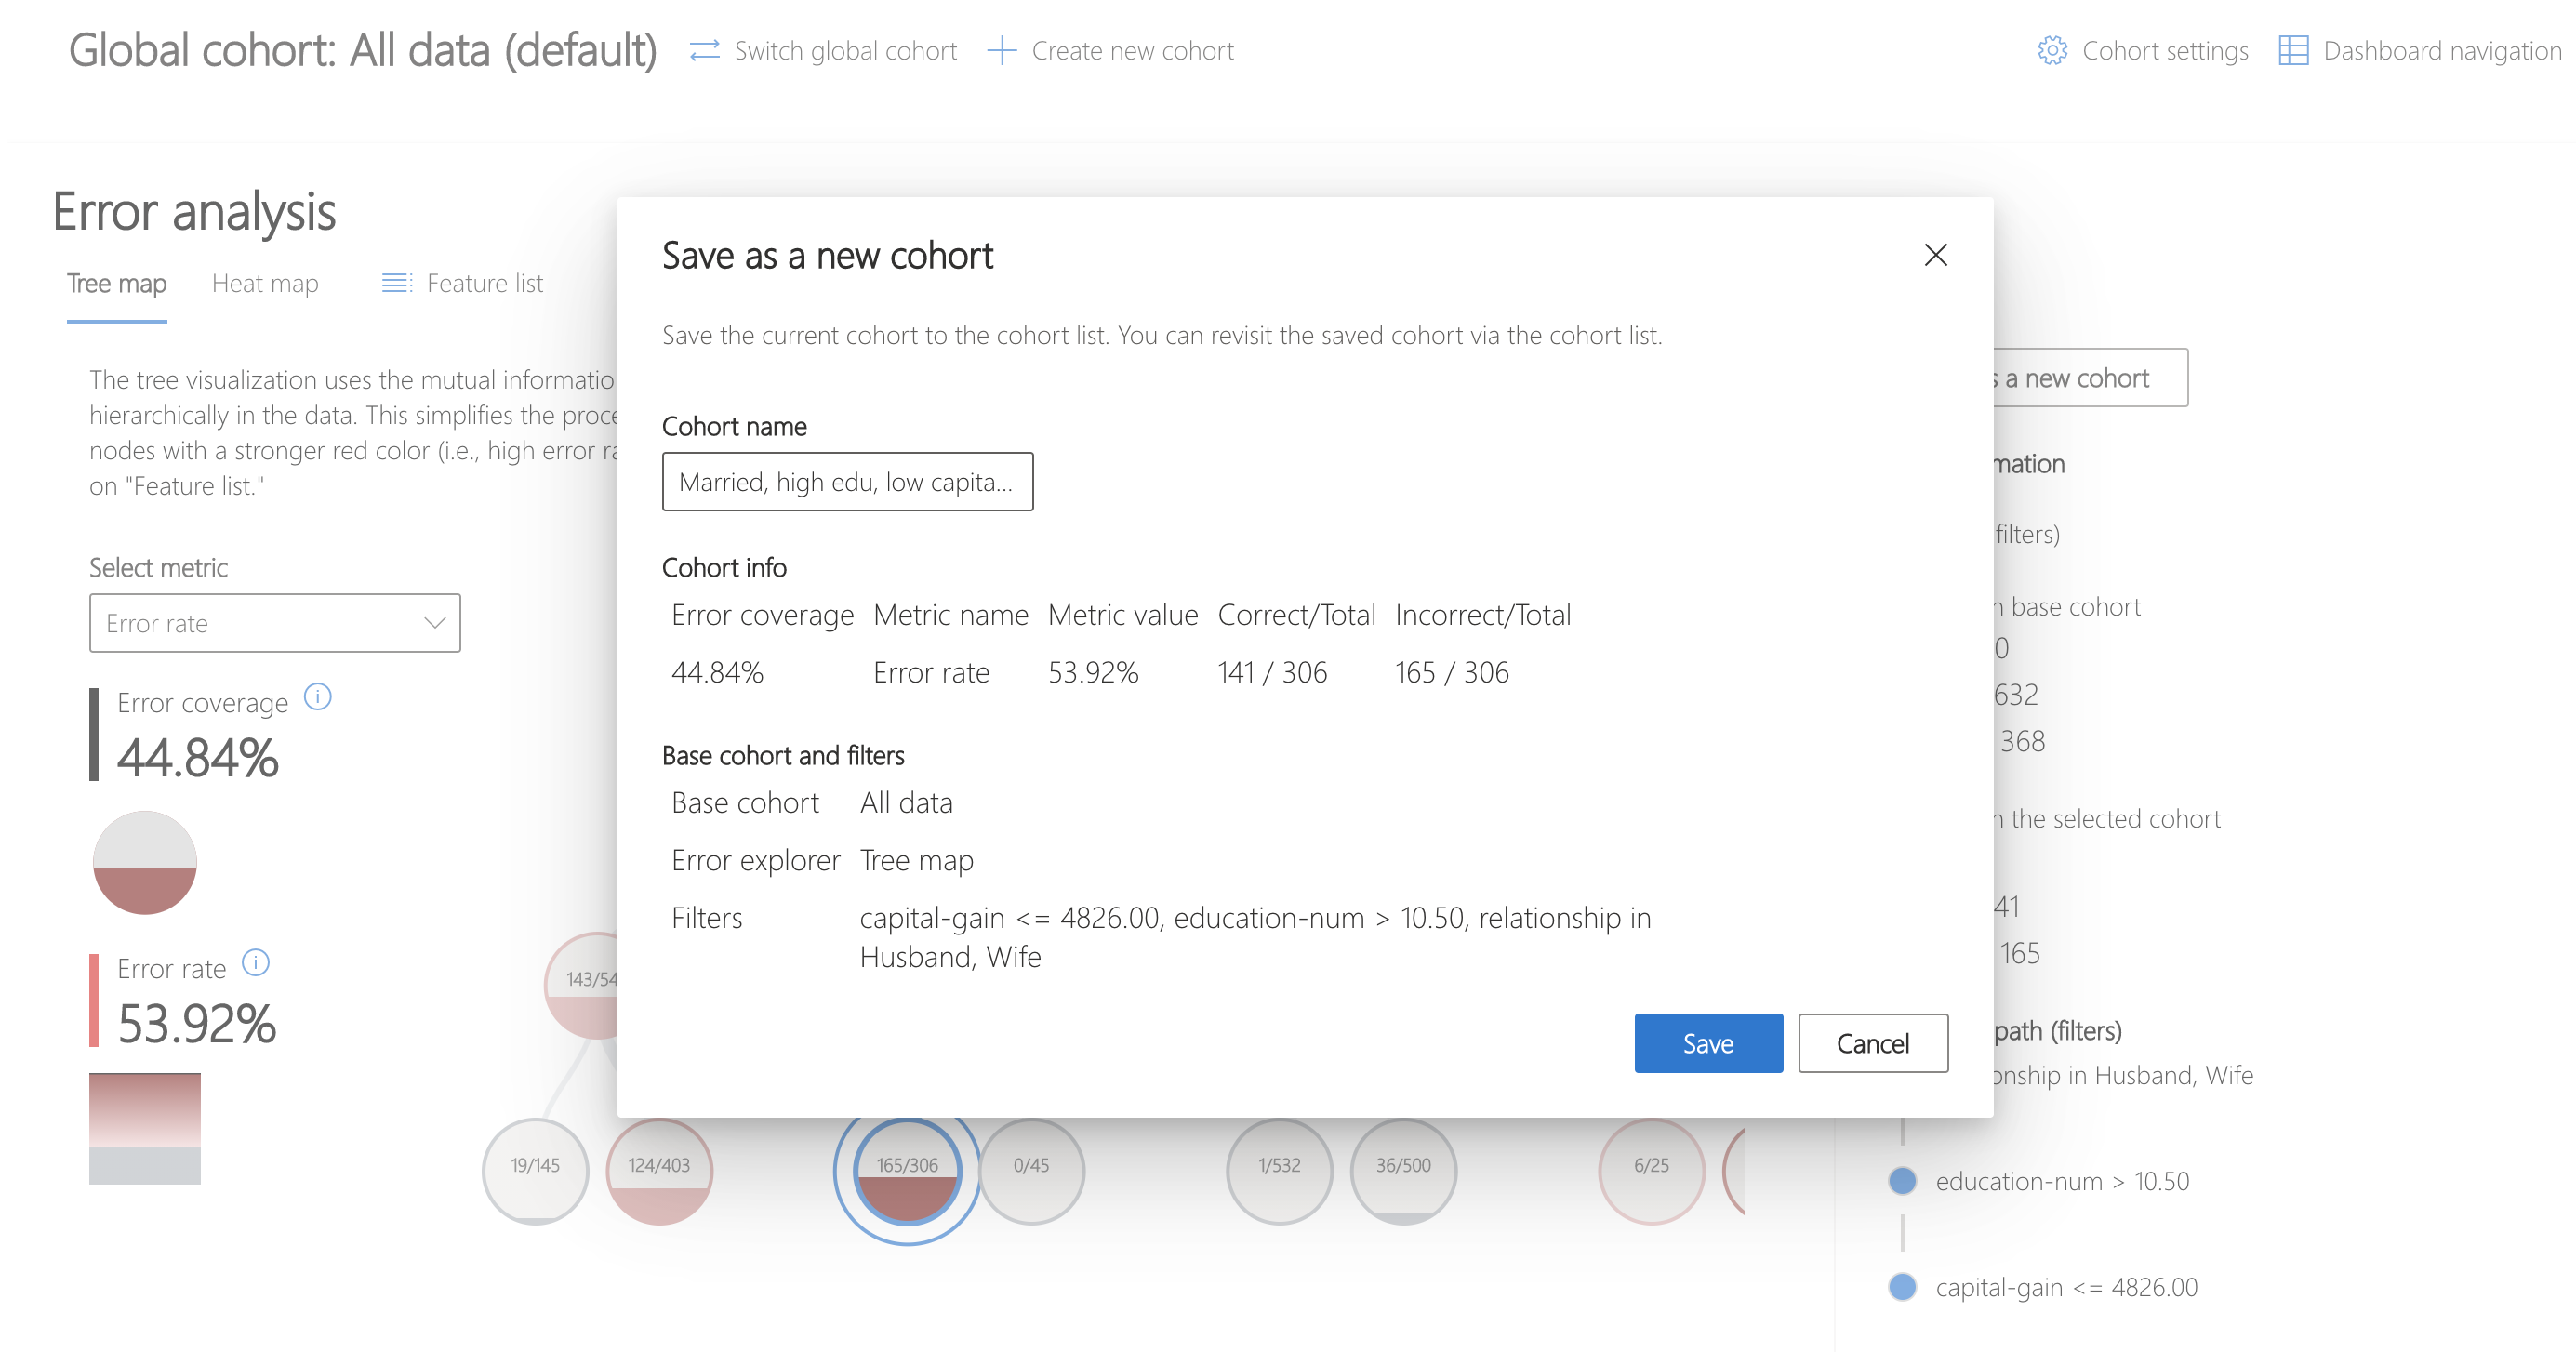
First, save the cohort by clicking "Save as a new cohort" on the right side panel of the Error Analysis component.
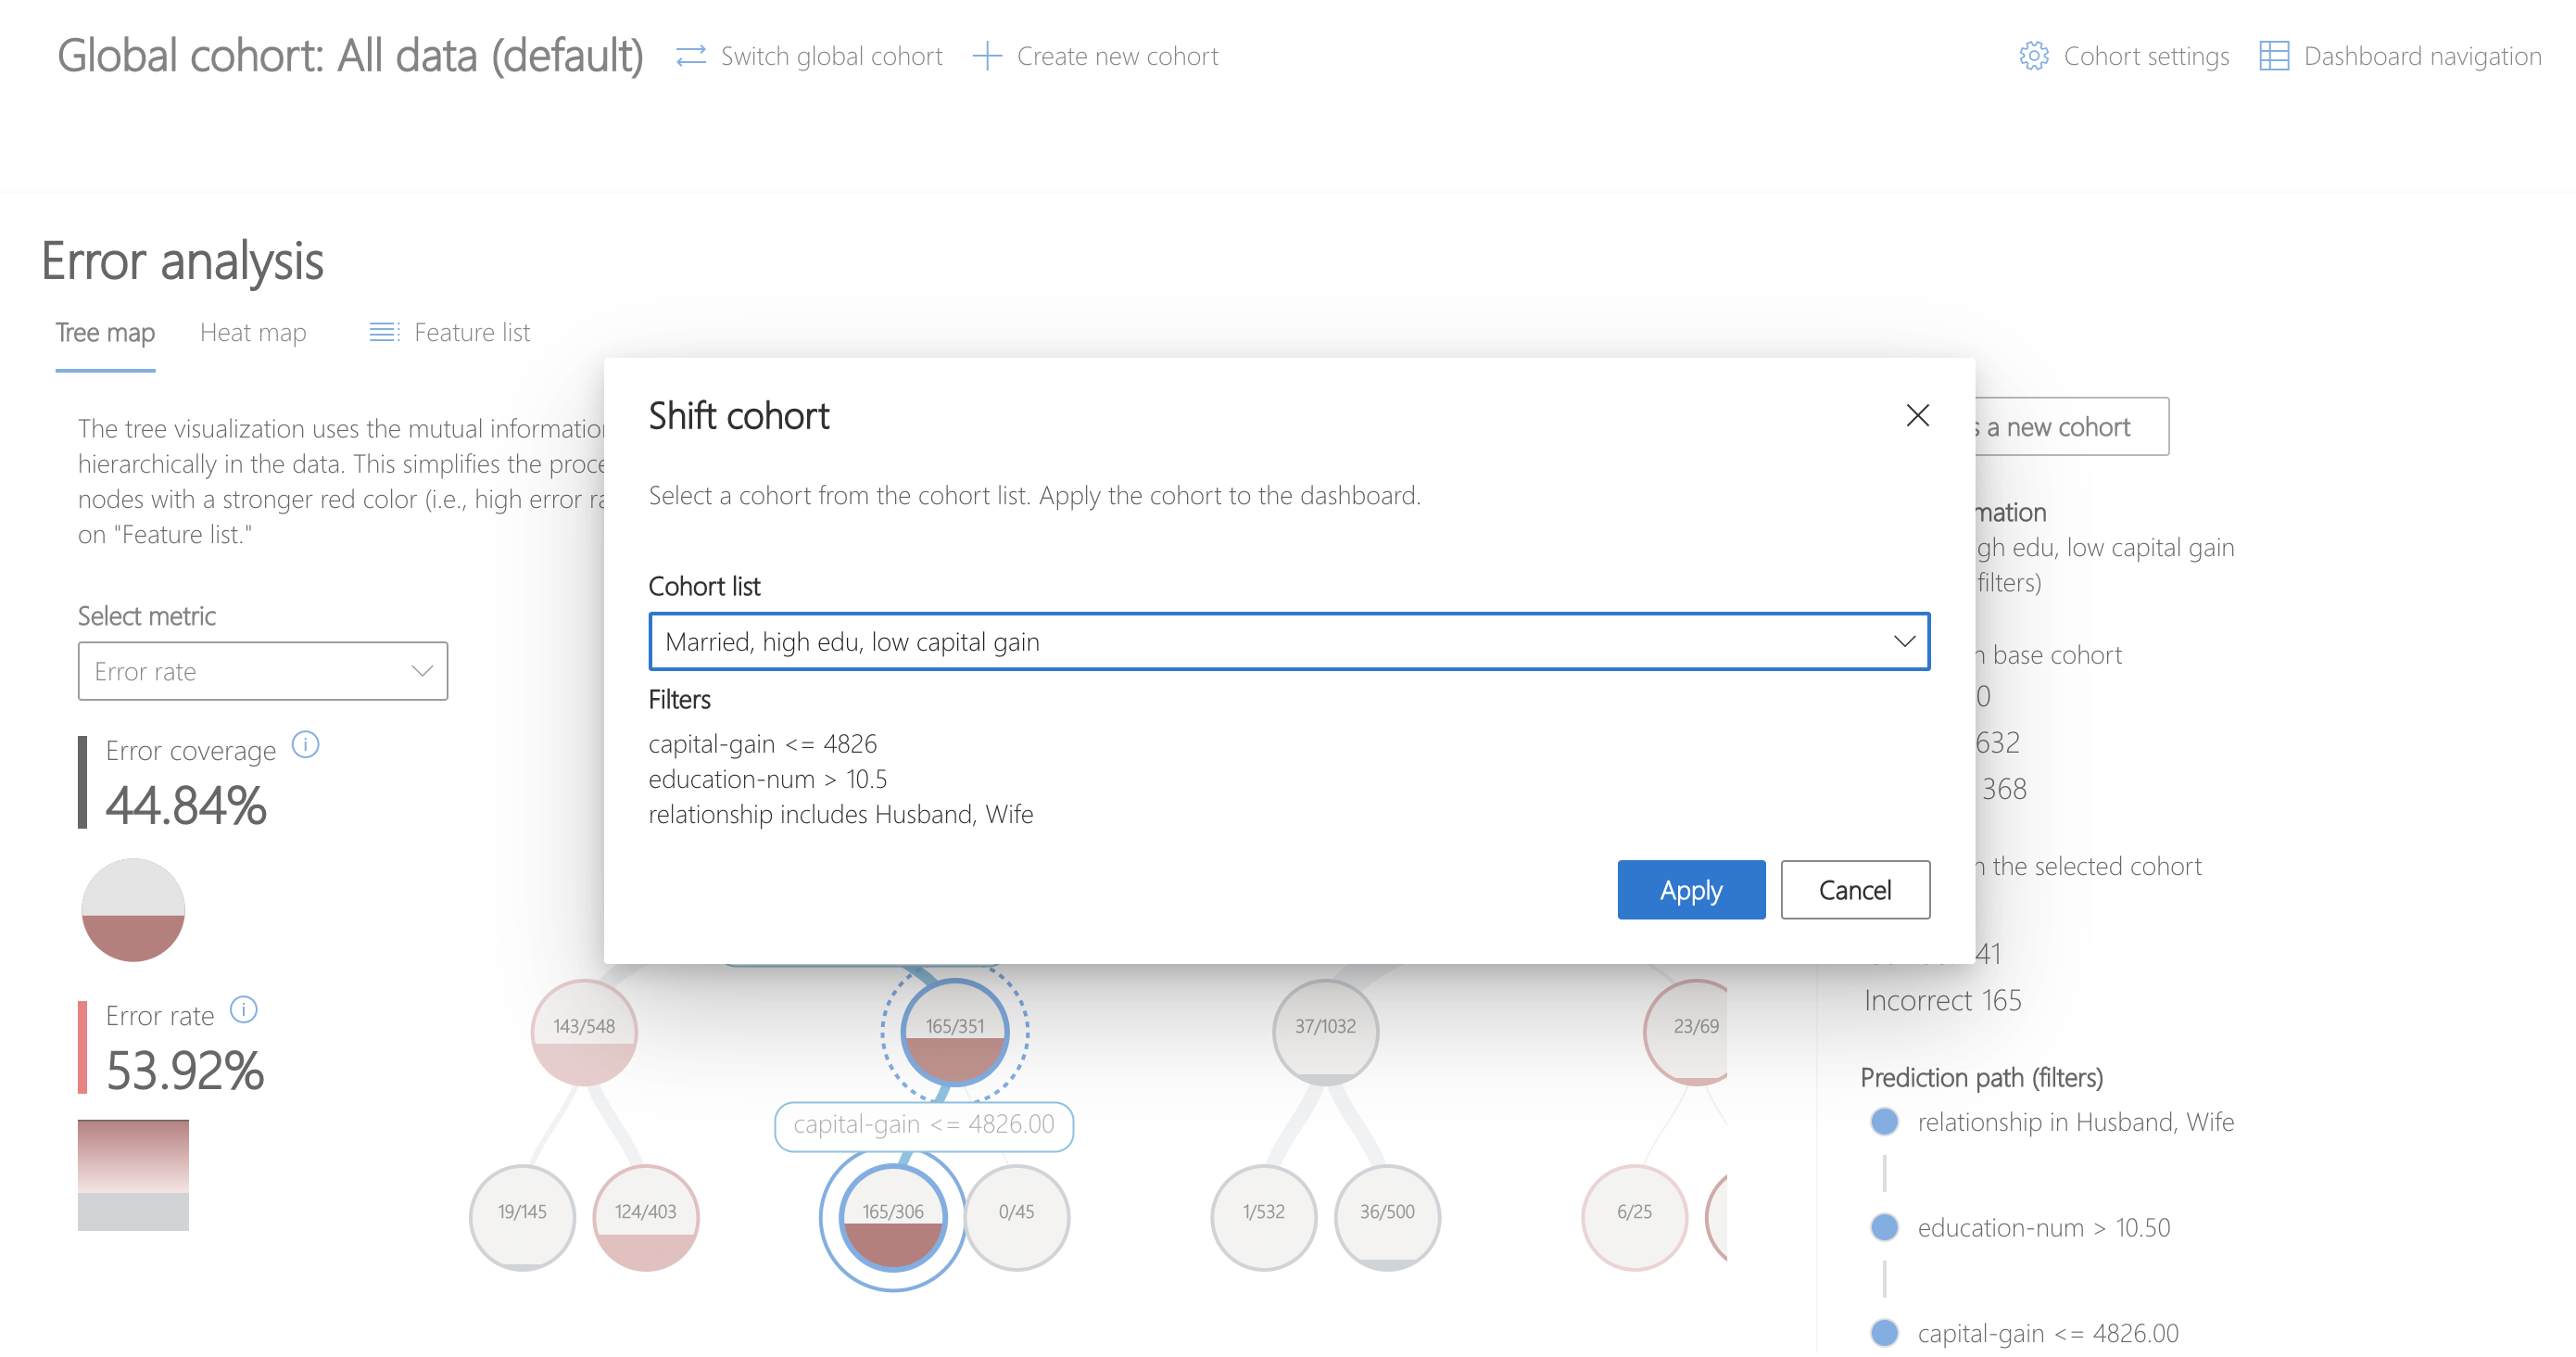
To switch to this cohort for analysis, click "Switch global cohort" and select the recently saved cohort from the dropdown.
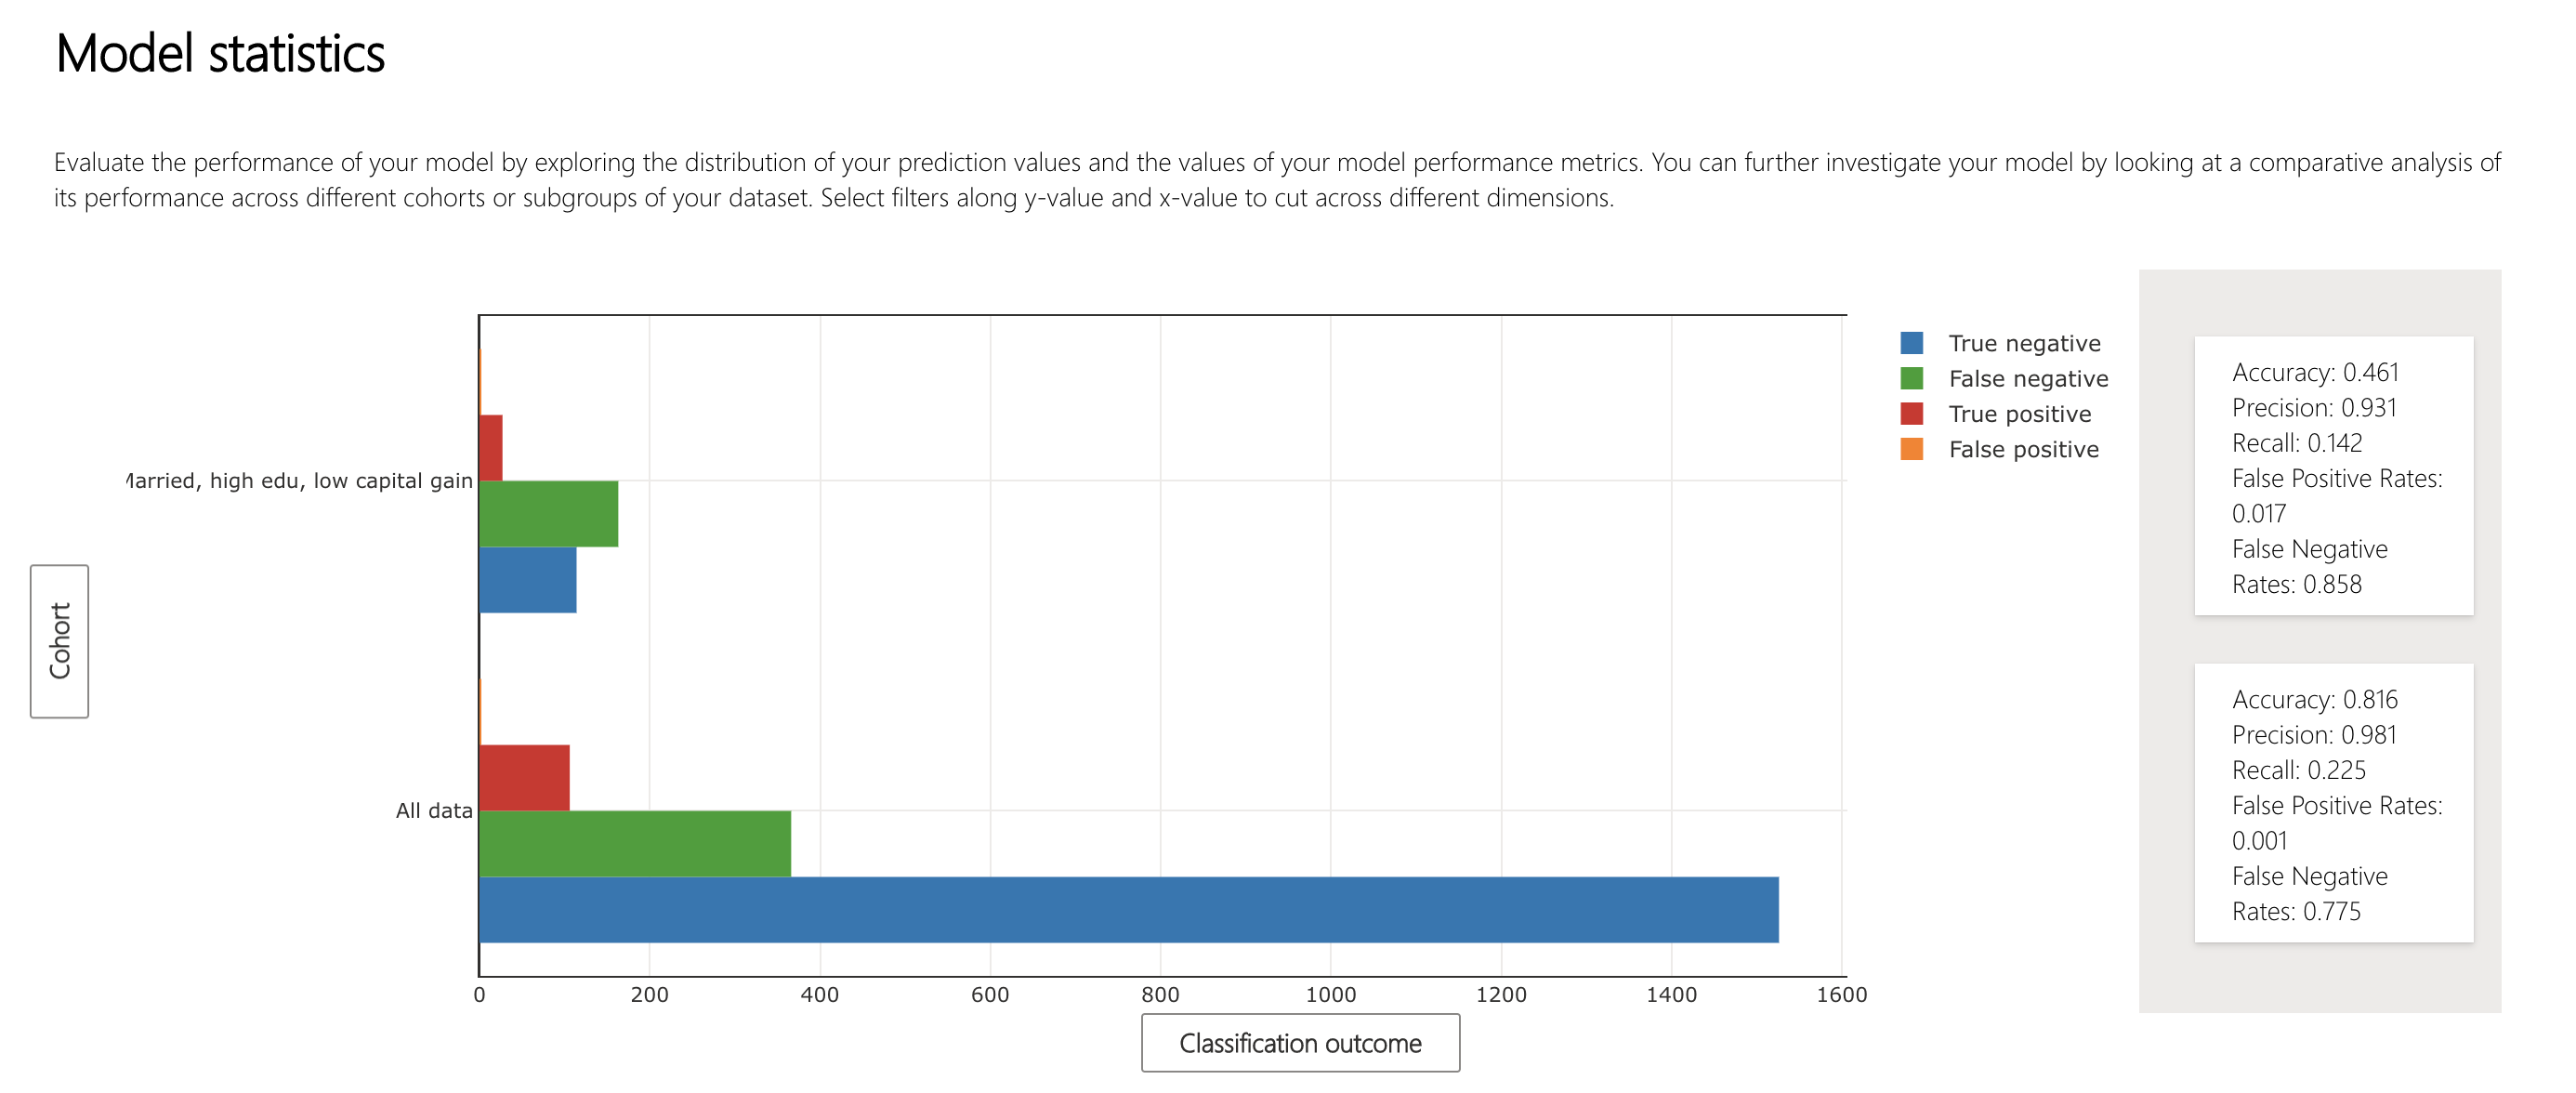
The Model Overview component allows the comparison of statistics across multiple saved cohorts.
The diagram indicates that the model is misclassifying datapoints of married individuals with low capital gains and high education as lower income (false negative).
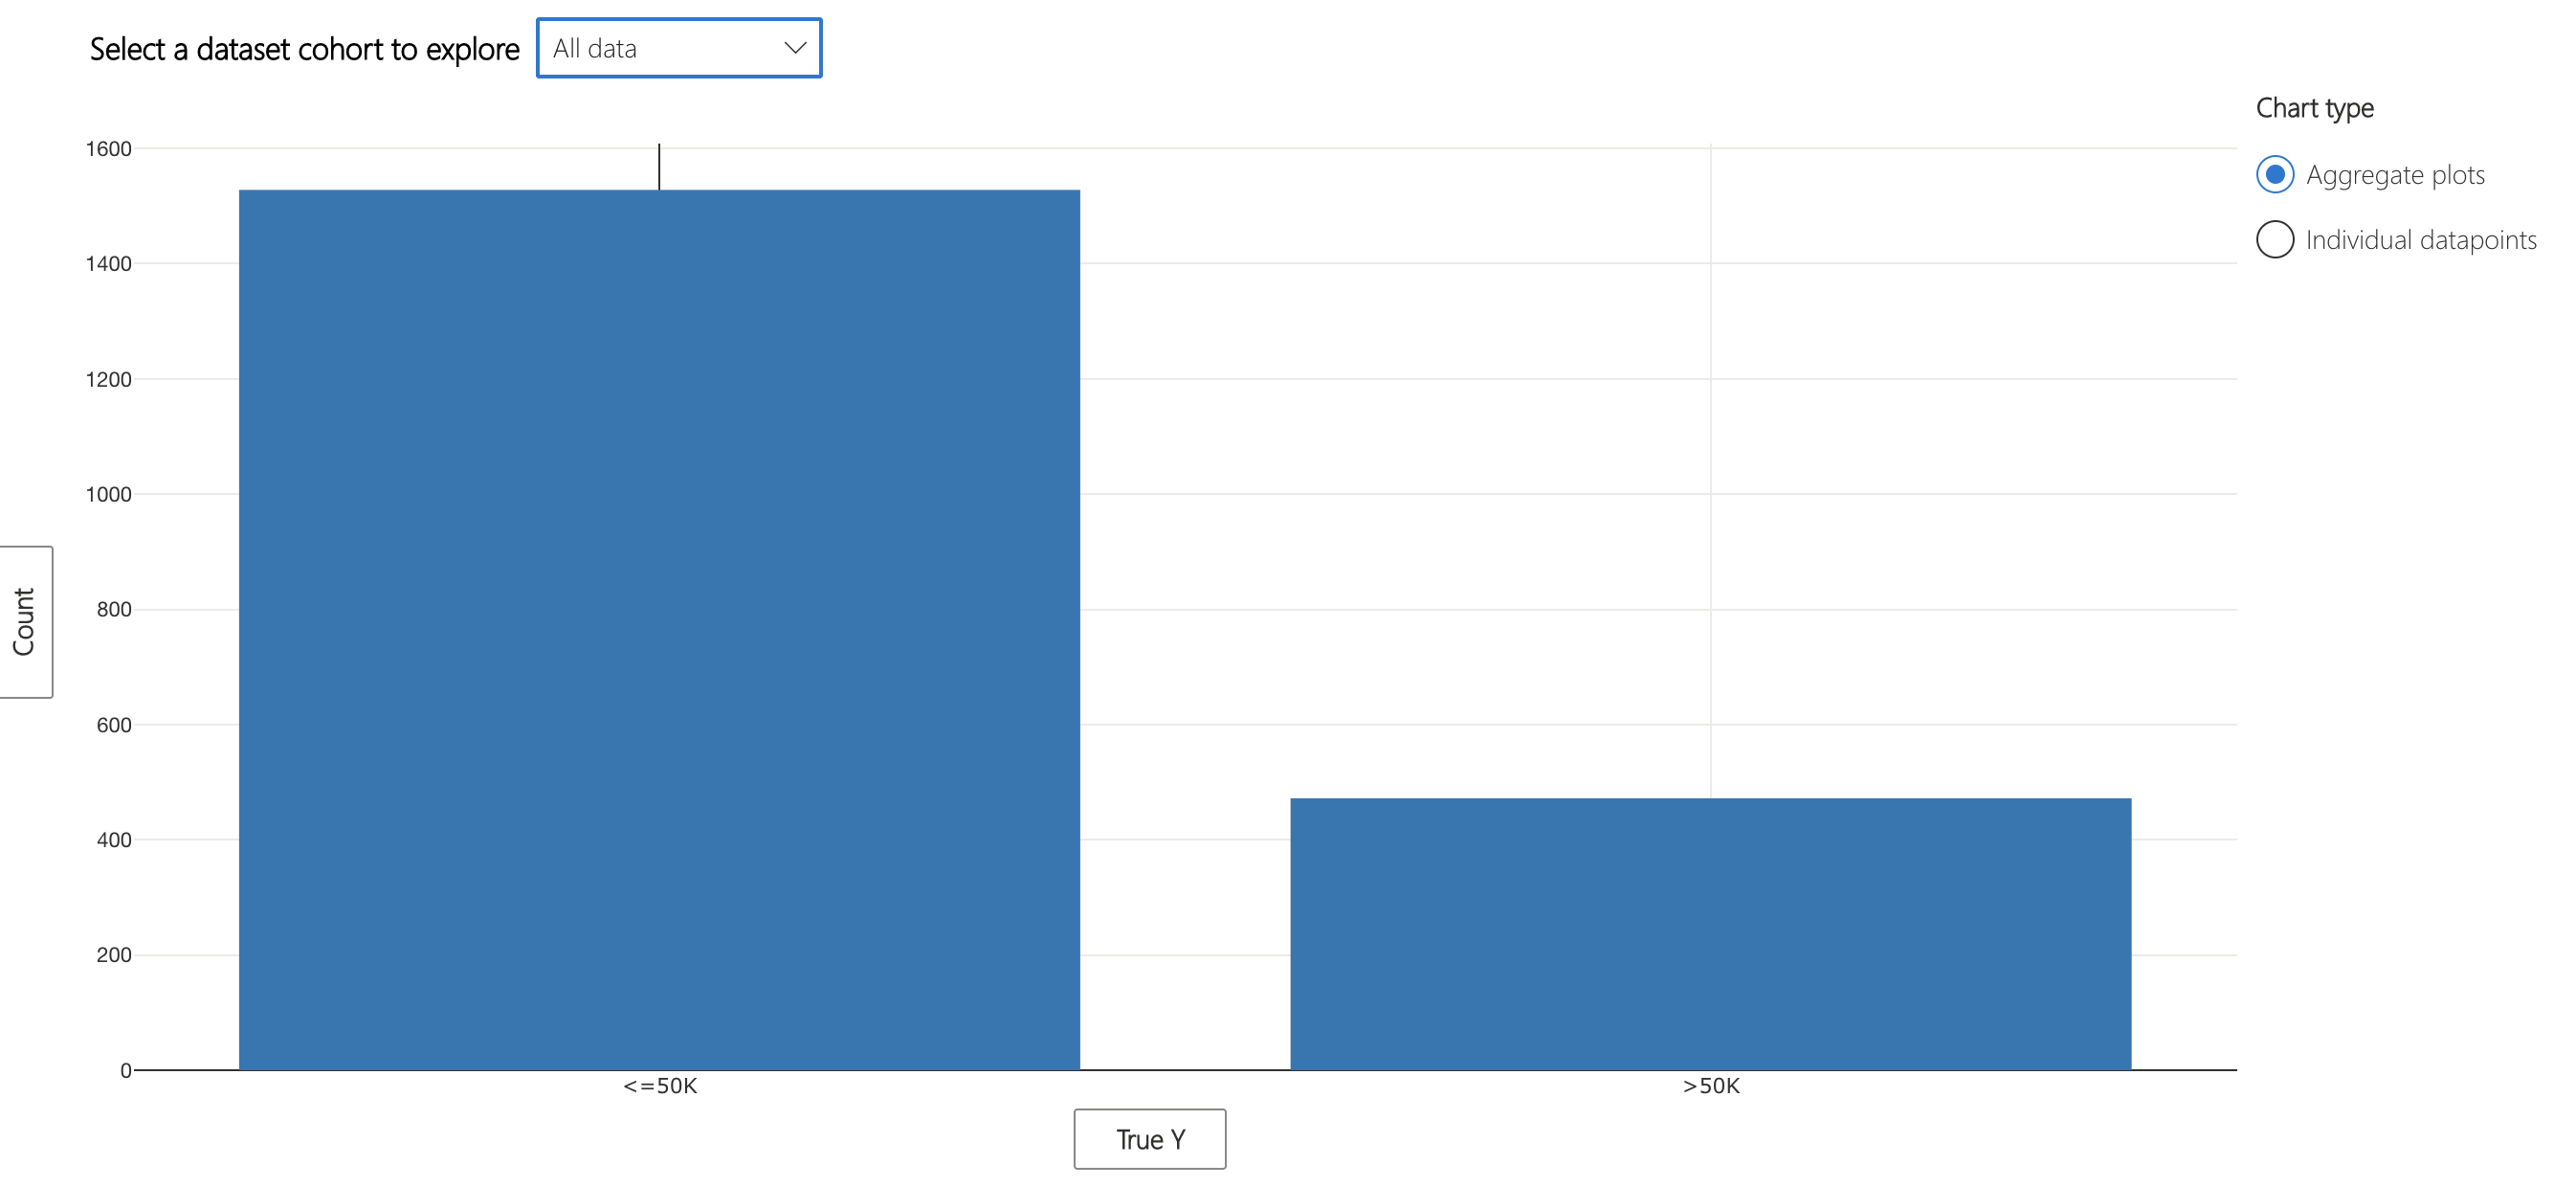
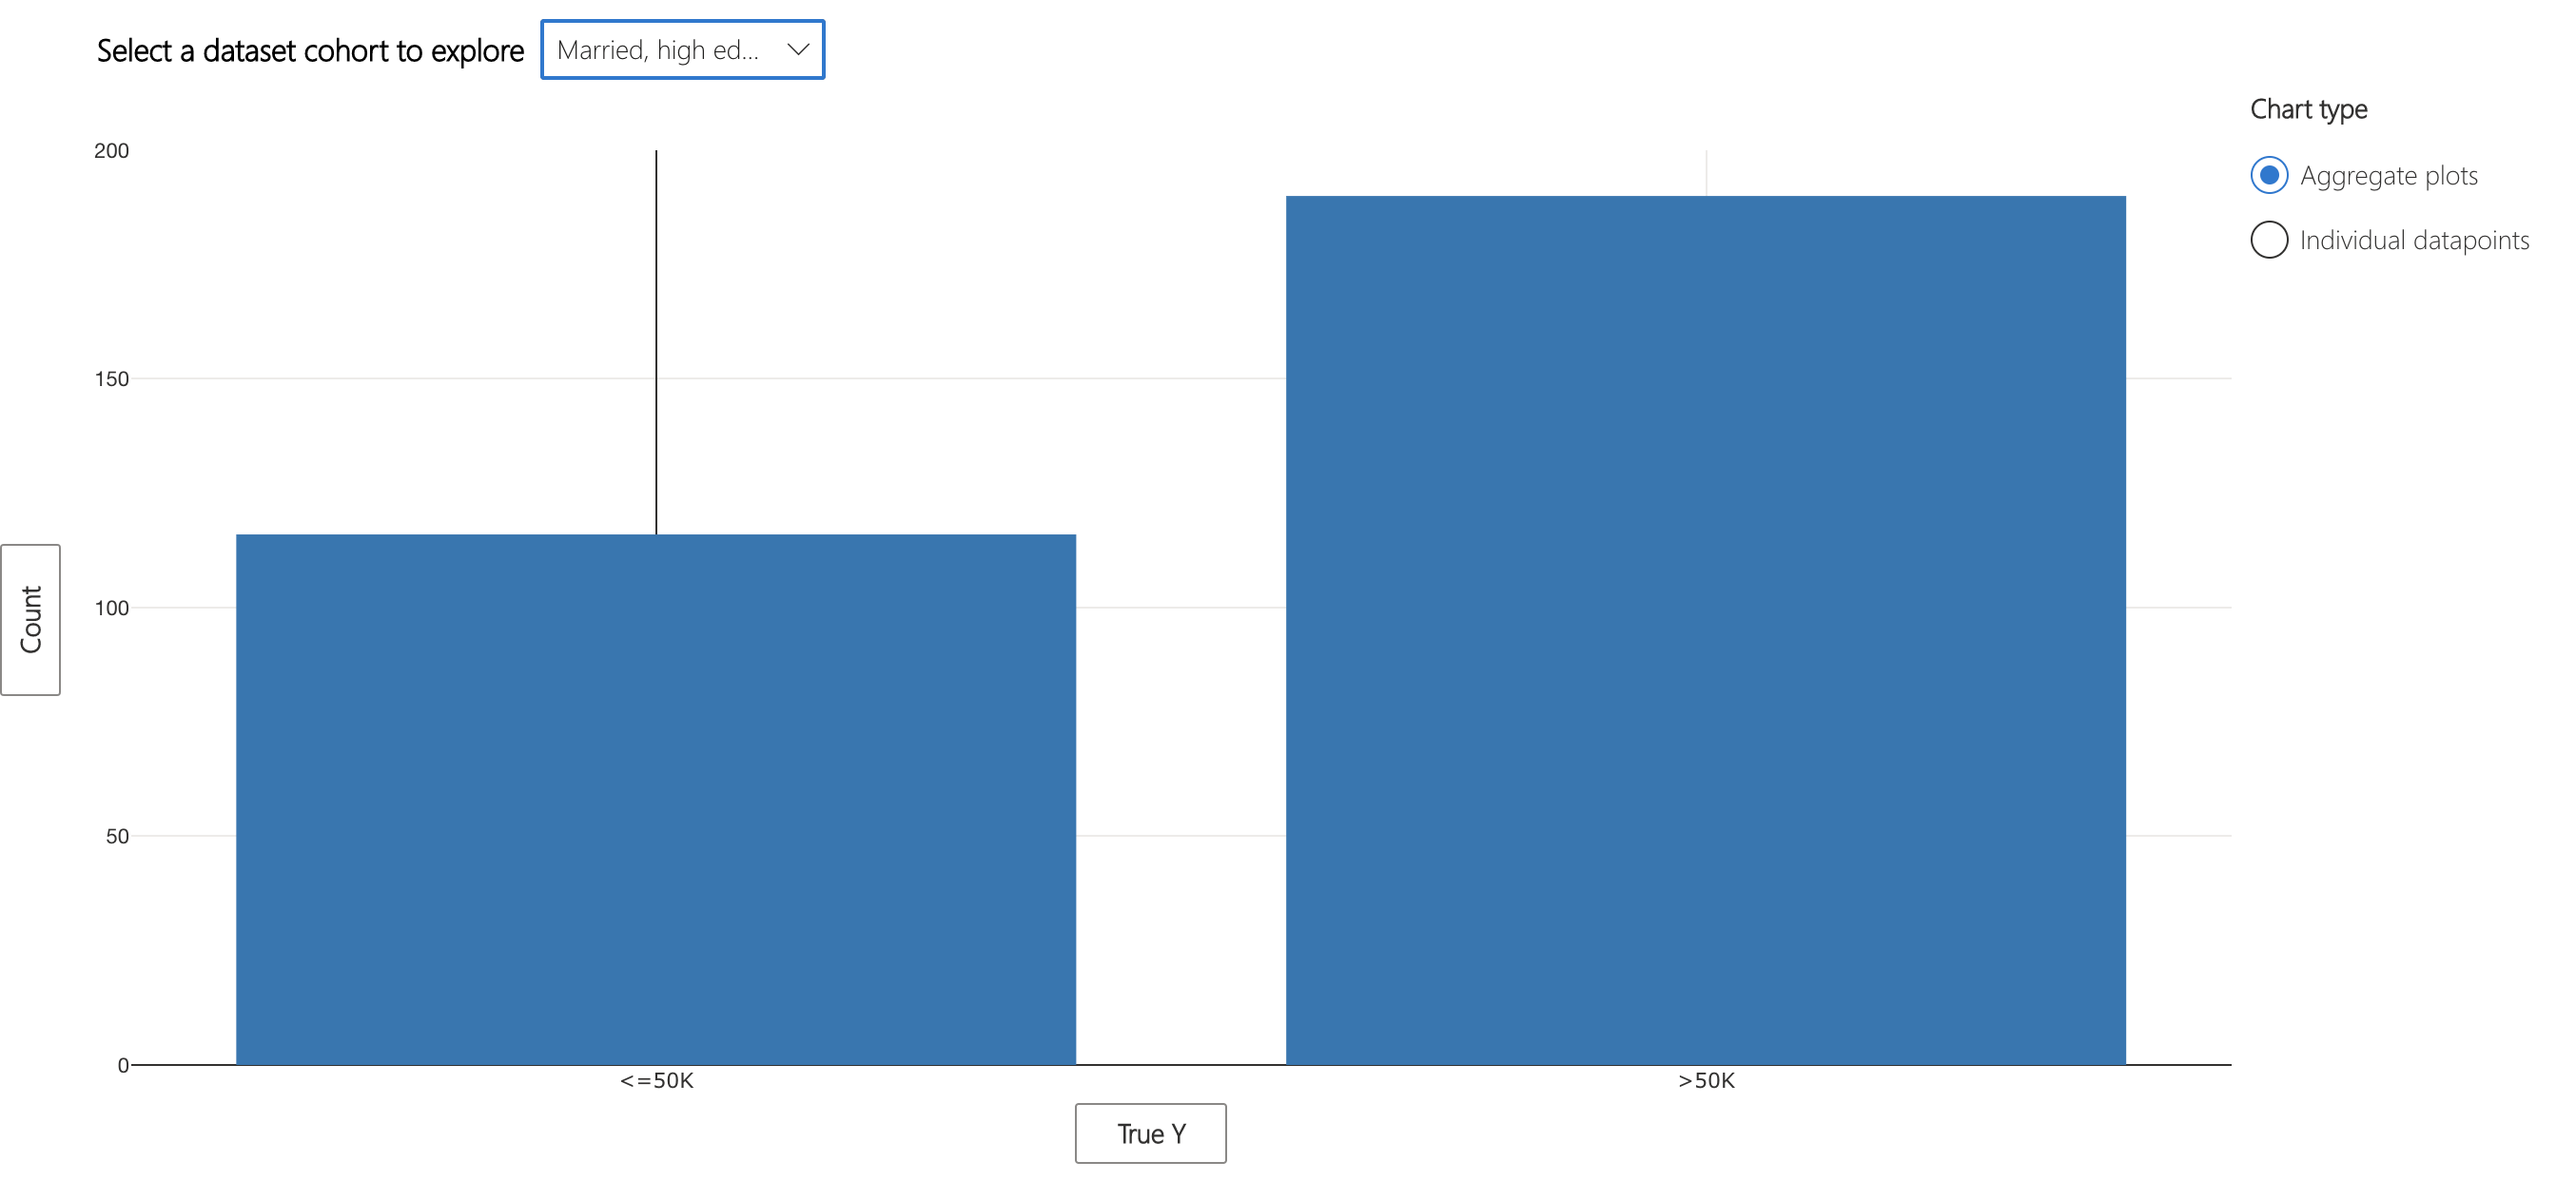
Looking at the ground truth statistics of the overall data and the erroneous cohort, we realize there are opposite patterns in terms of high income representation in ground truth. While the overall data is representing more individuals with actual income of <= 50K, the married individuals with low capital gains and high education represent more individuals with actual income of > 50K. Given the small size of the dataset and this reverse pattern, the model makes more mistakes in predicting high income individuals. One action item is to collect a lot more data in both cohorts and retrain the model.
The Interpretability component displays feature importances for model predictions at an individual and aggregate level. The plot below indicates that the marital-status attribute influence model predictions the most on average.
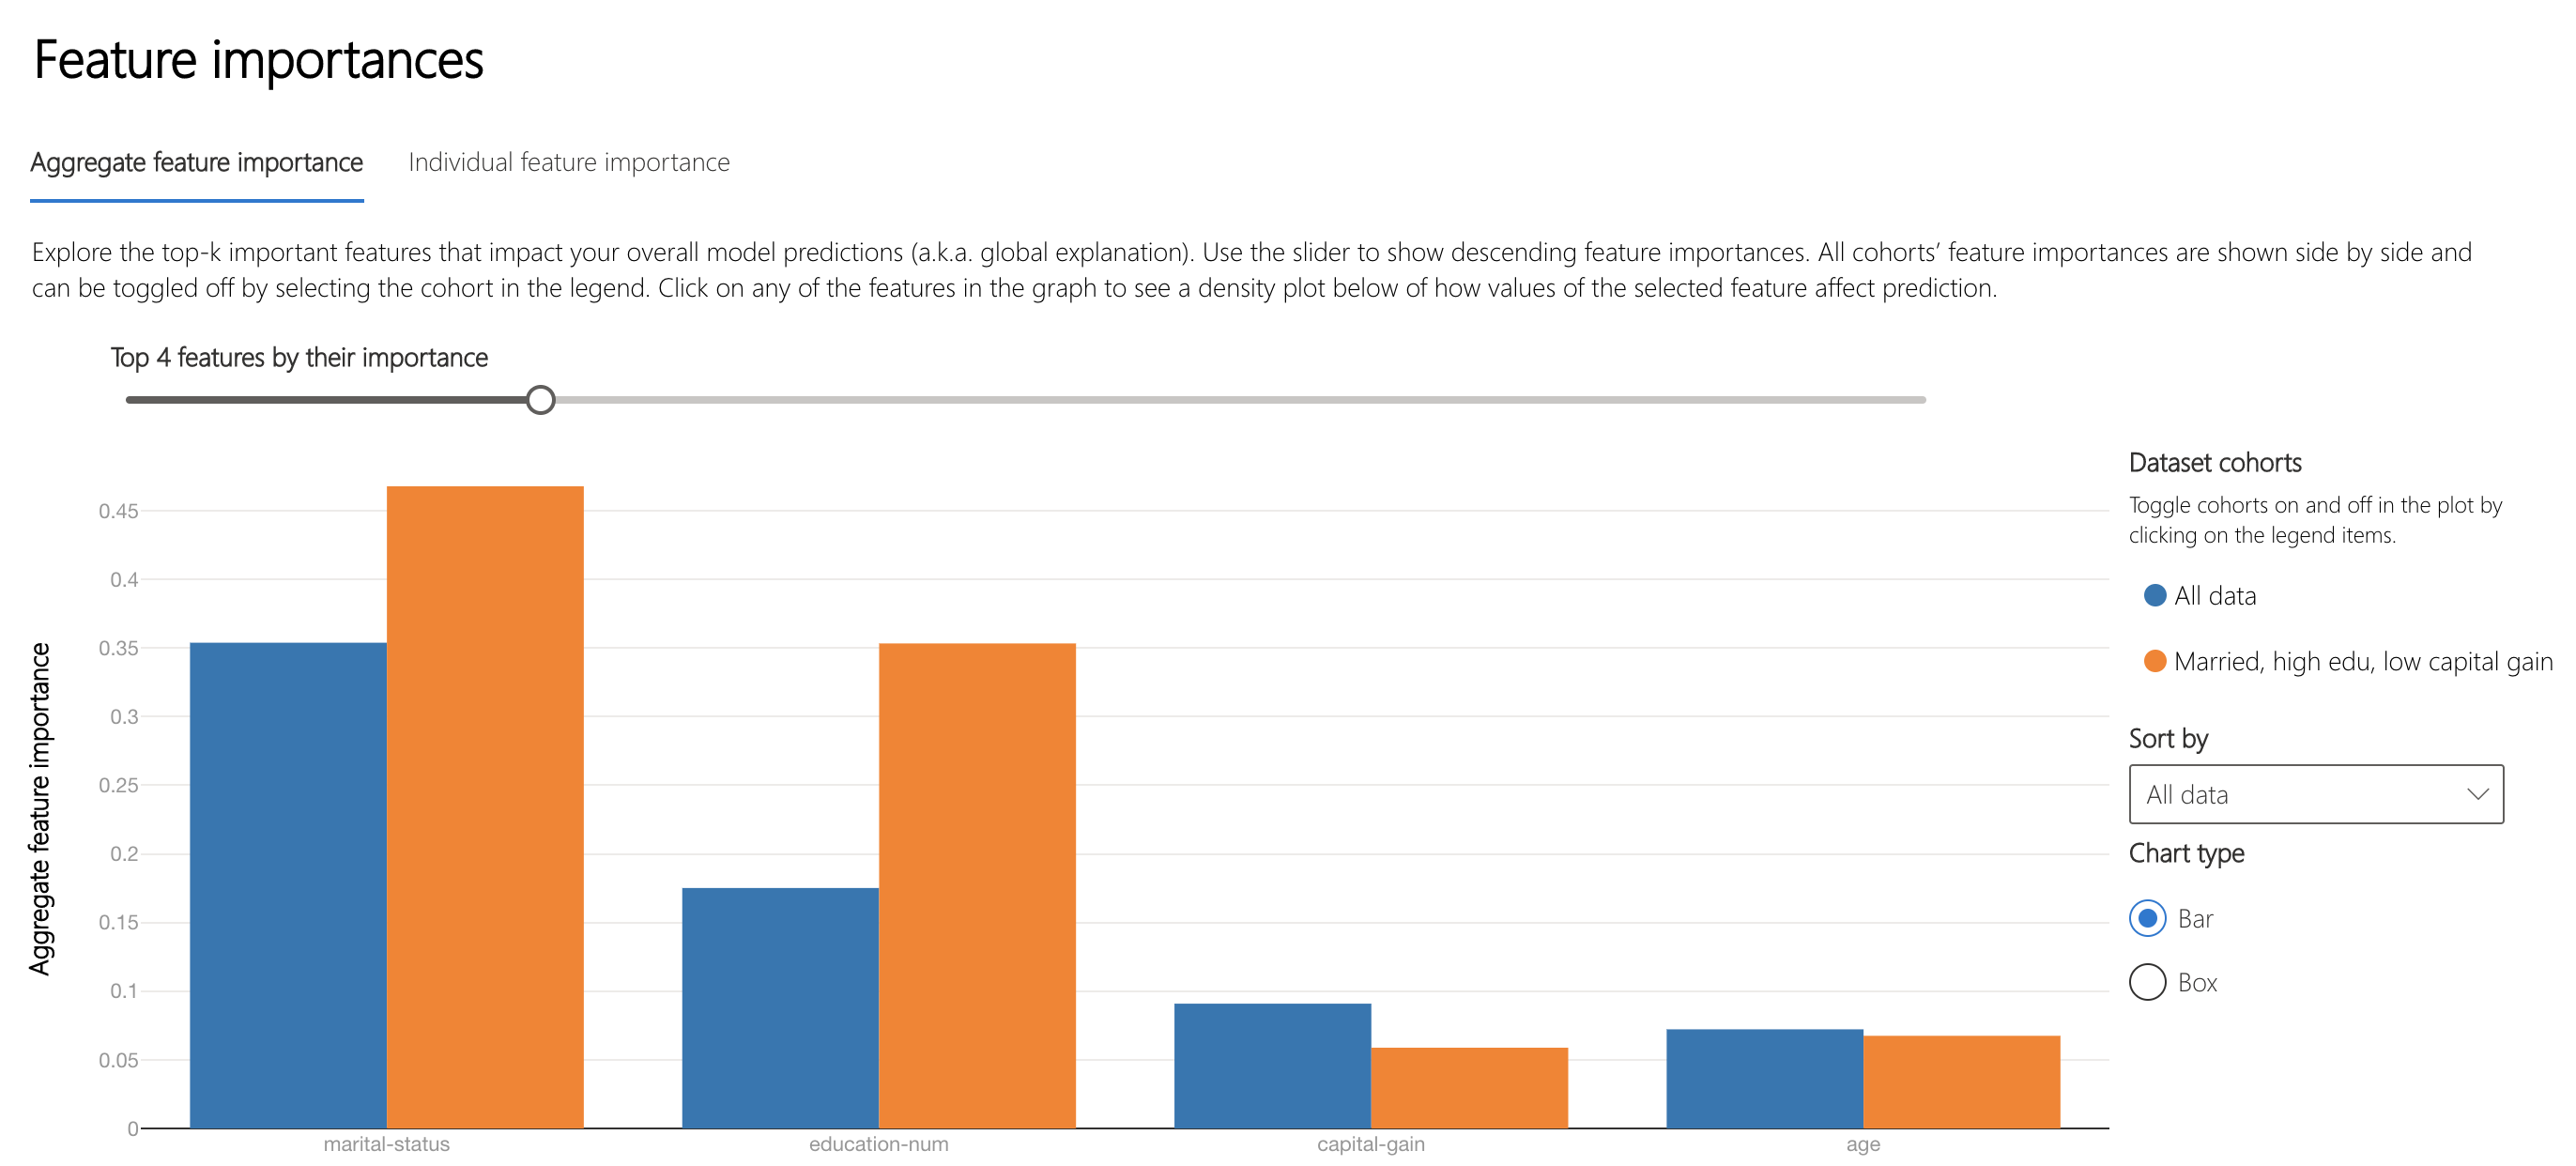
The lower half of this tab specifies how marita status affects model prediction. Being a husband or wife (married-civ-spouse) is more likely to pull the prediction away from <=50k, possibly because couples have a higher cumulative income.

Individual Analysis
Let's revisit Data Explorer. In the "Individual datapoints" view, we can see the prediction probabilities of each point. Point 510 is one that was just above the threshold to be classified as income of > 50K.
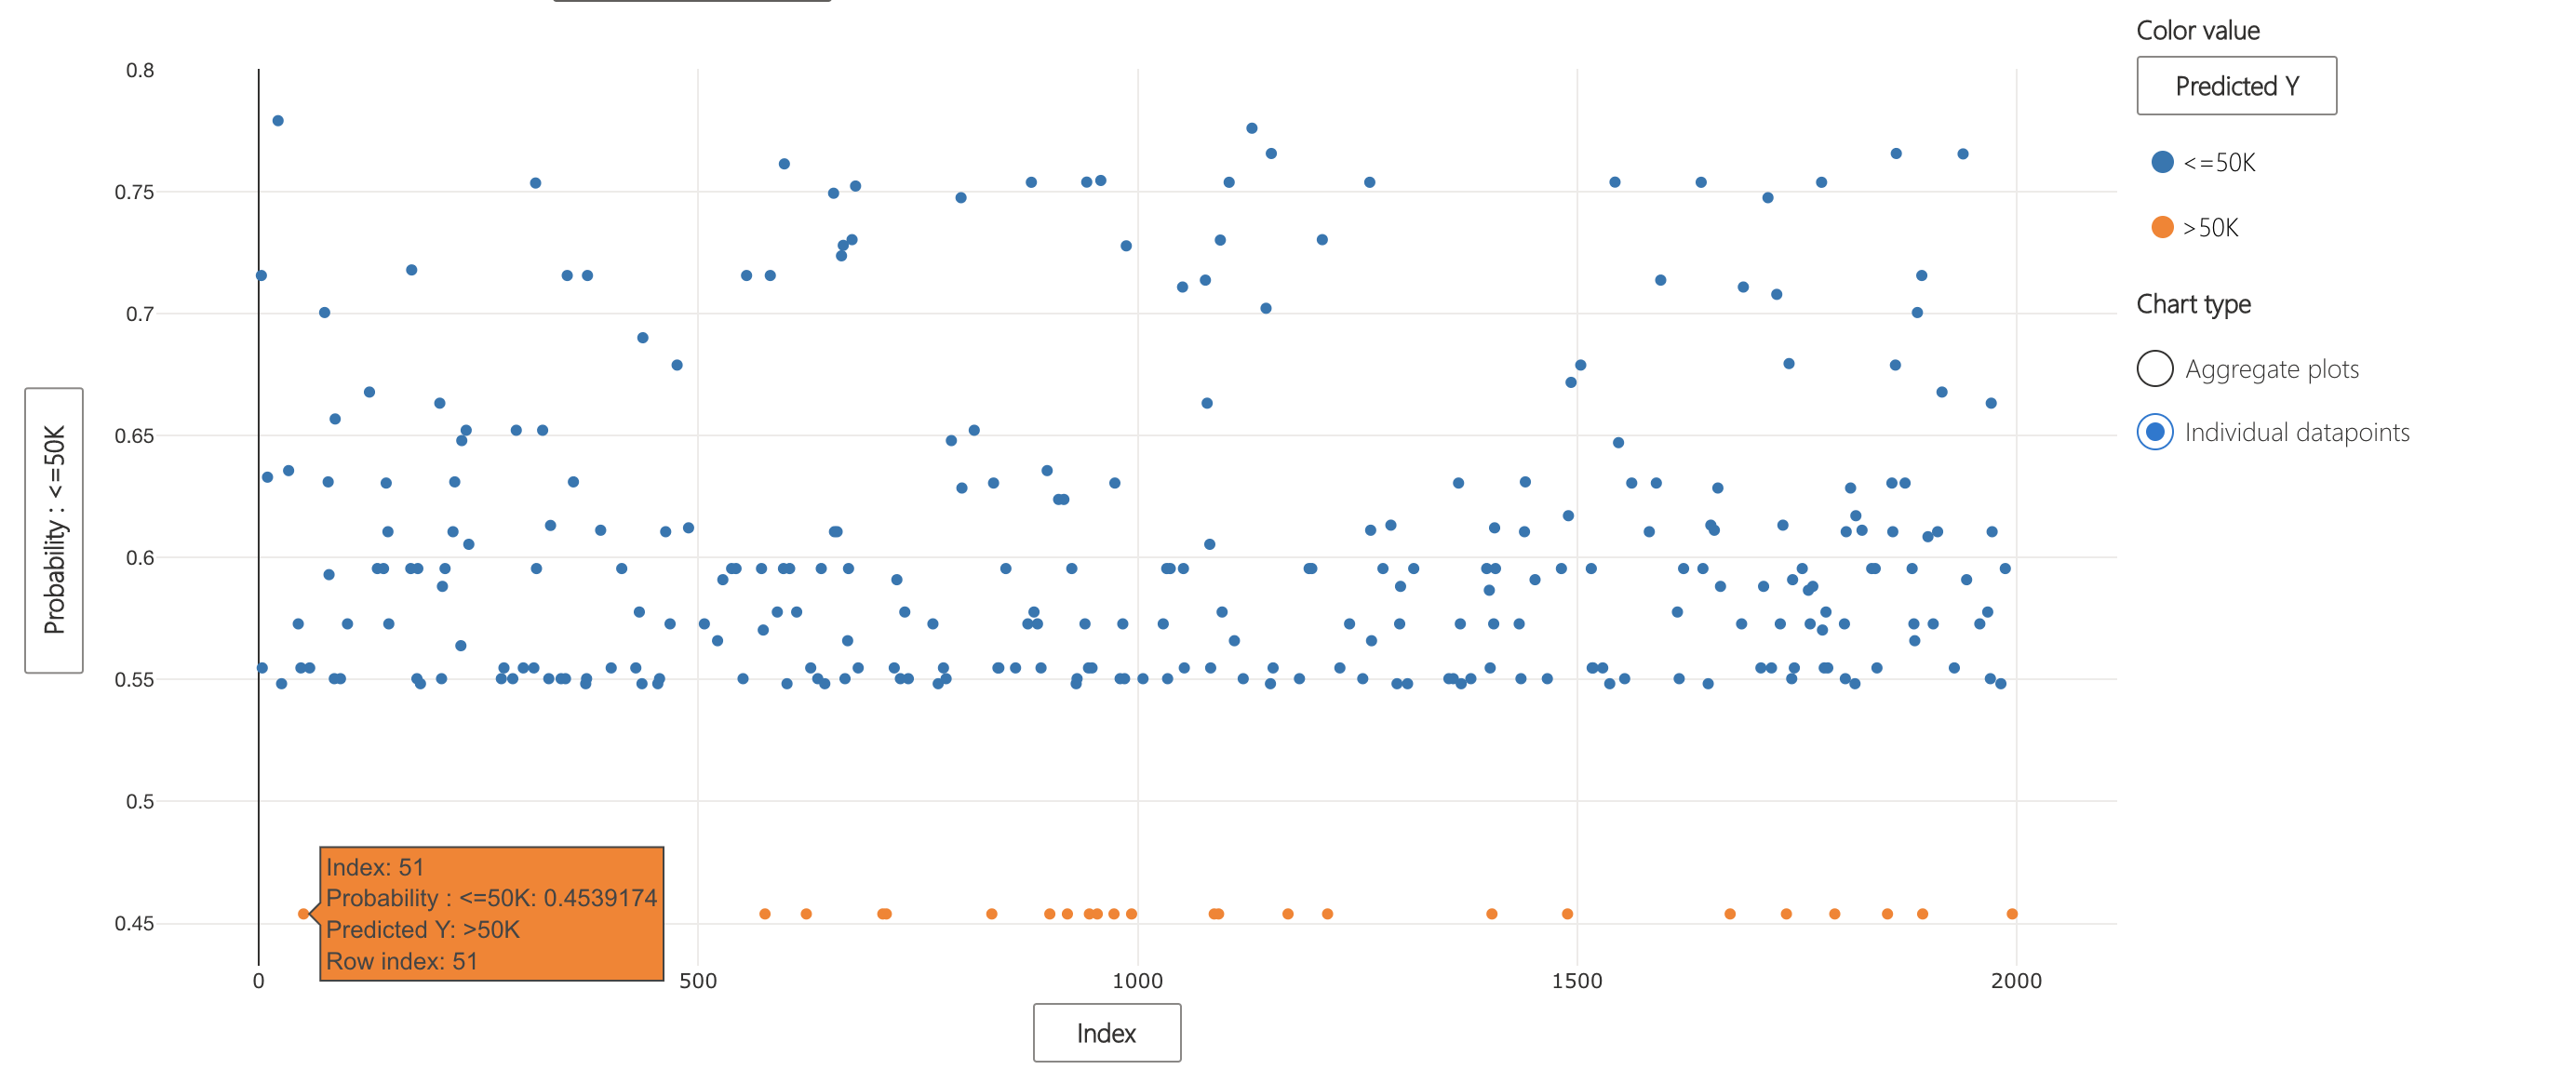
What factors led the model to make this decision?
The "Individual feature importance" tab in the Interpretability component's Feature Importances section let you select points for further analysis.
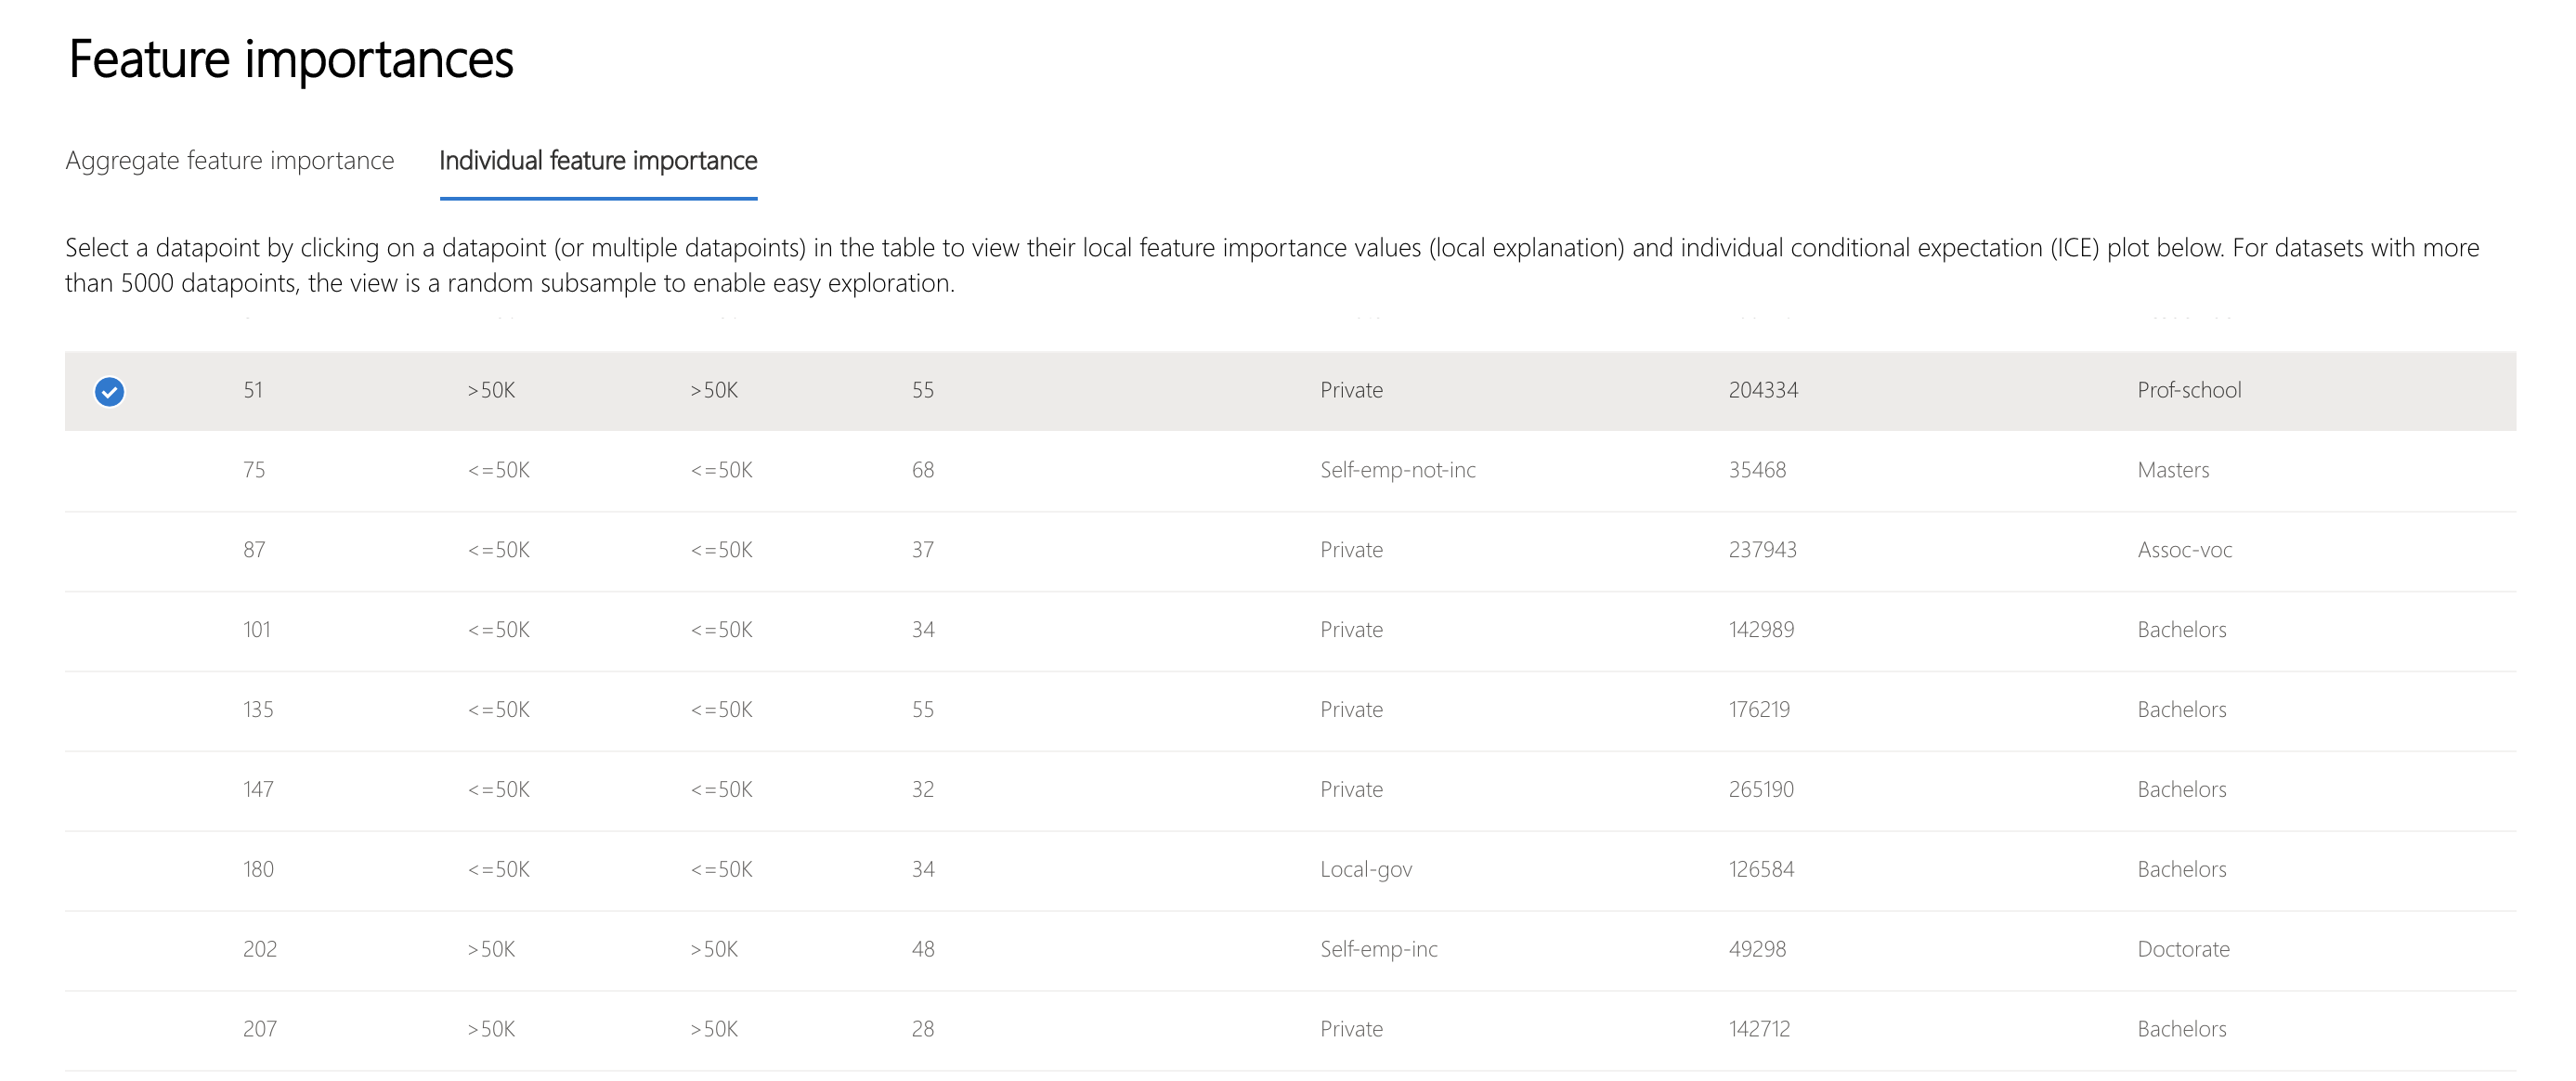
Under this, the feature importance plot shows capital-gain and native-country as the most significant factors leading to the <= 50K classification. Changing these may cause the threshold to be crossed and the model to predict the opposite class. Please note that depending on the context, the high importance of native-country might be considered as a fairness issue.

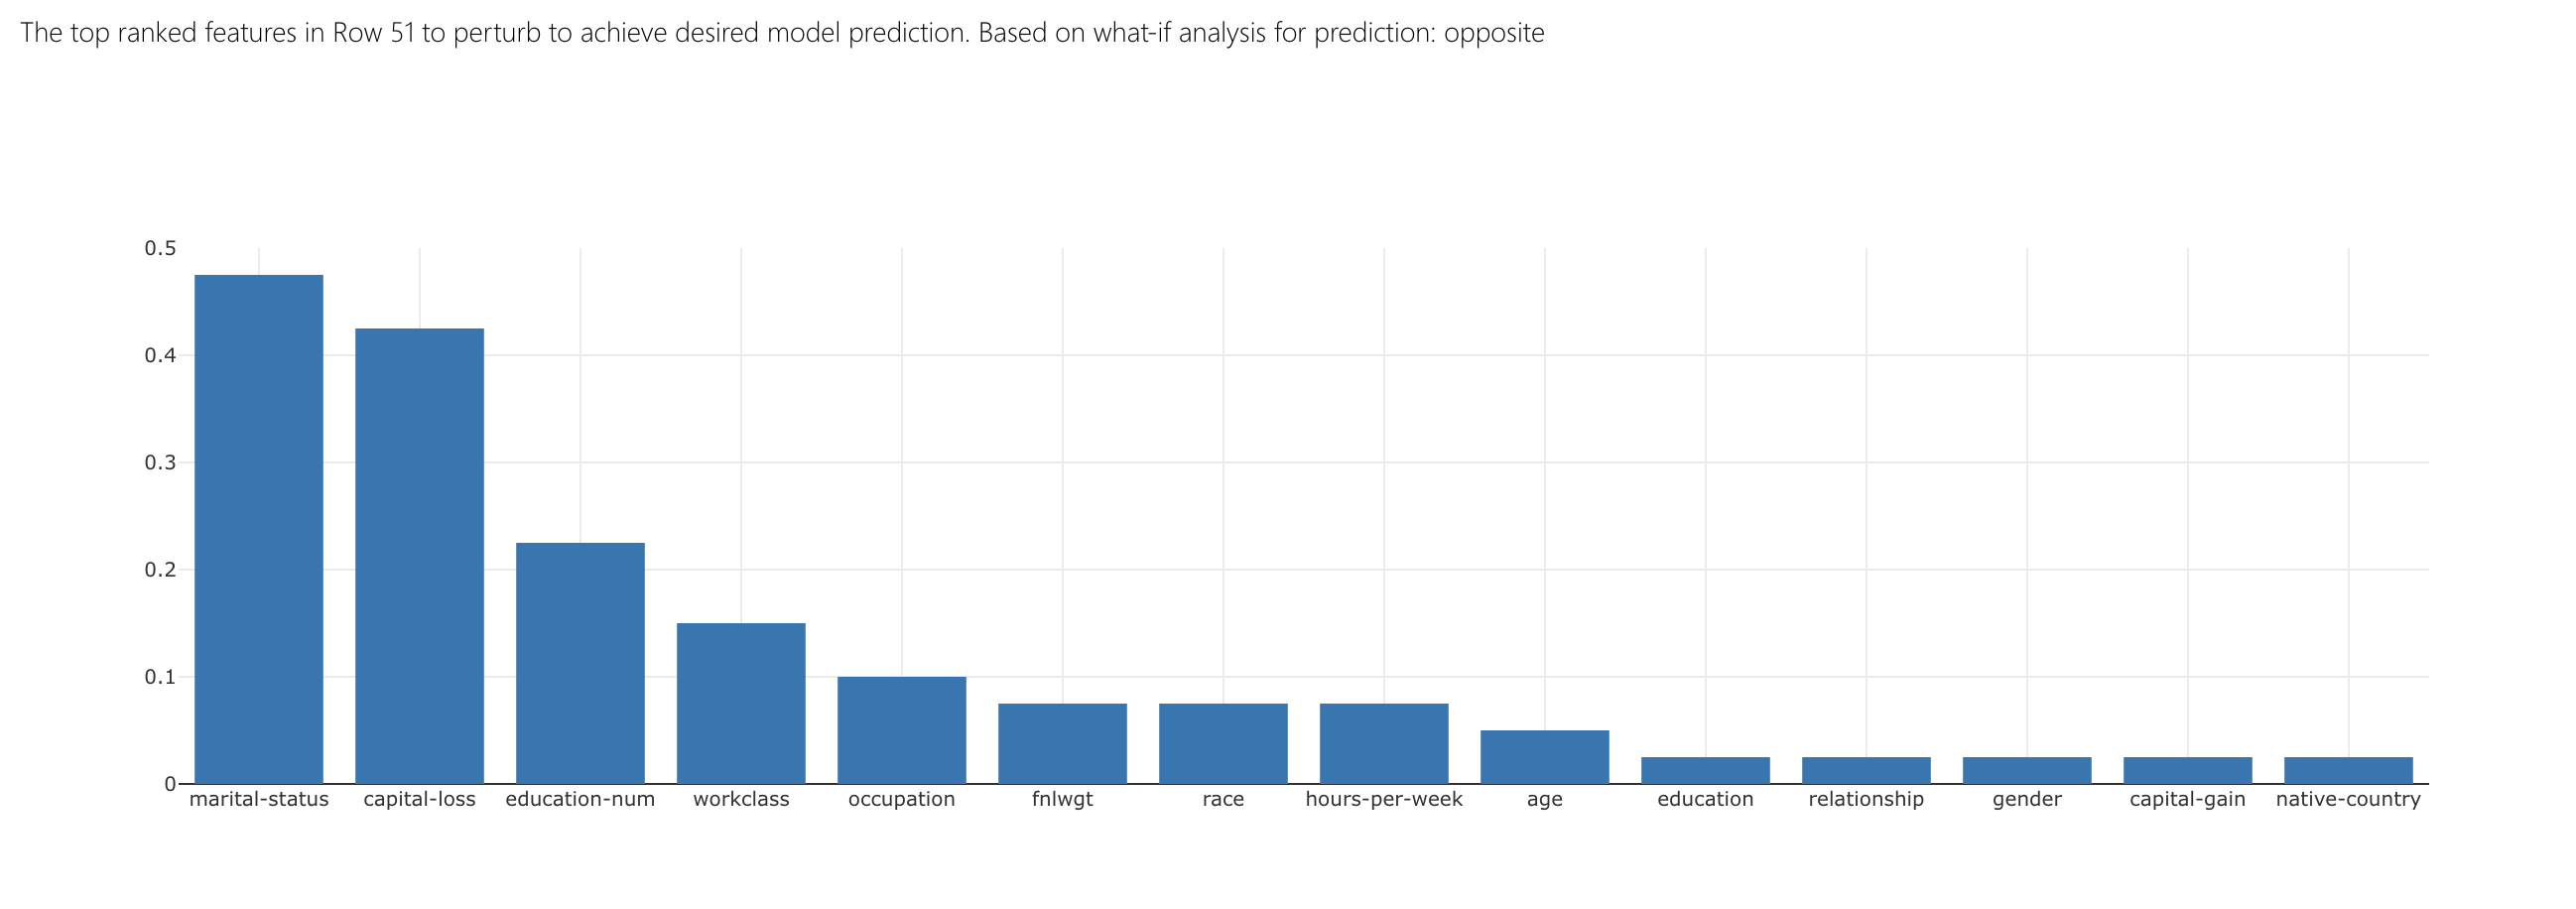
The What-If Counterfactuals component focuses on how to change features slightly in order to change model predictions. As seen in its top ranked features bar plot, changing this person's marital-status, capital-loss, and education-num have the highest impact on flipping the prediction to > 50K.
