Using PCA to visualize the MtG universe
In this notebook, we're going to scrape Magic the Gathering's Gatherer card database and then perform principal components analysis to visualize hidden relationships between cards. Our goal will be to see how much card-to-card variation can be simplified and then plotted in two-dimensions and again what those card groupings look like.

This data set is very high-dimensional -- there are over a 100 unique mechanics in the game and the game state has many different elements (hand, battlefield, mana pool, etc.). Being able to translate the 13,000 unique card texts into structured data is also a challenge NLP-related task.
Warning: This notebook is long...so, for the impatient:
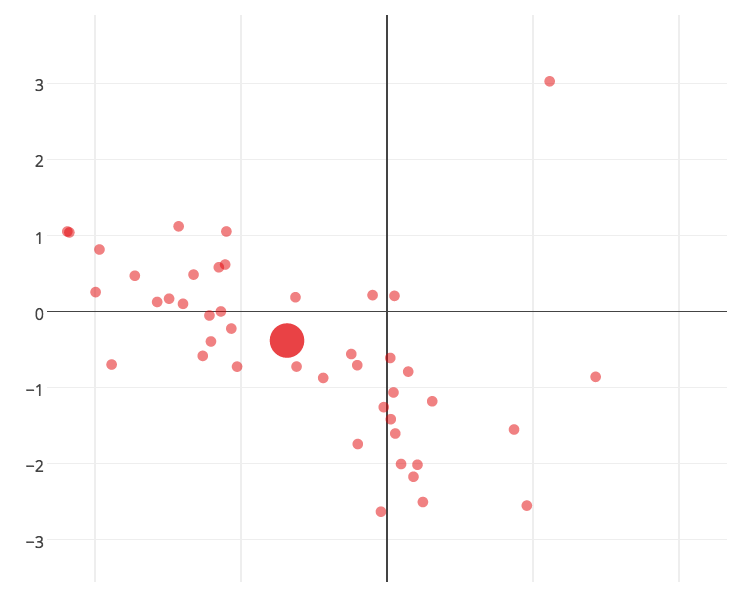
Here is what we will be working towards, a programmatic mapping of every Magic card ever made across two psuedo-axes:

We will show that while Magic cards can differ in thousands of ways, they can be roughly categorized based on two simple measures: how "creature-y" are they? and how much do they related to the board or non-board state?
Implementation details
Pretty baller, right? We will interpret and grok this graph later, but for now, let's do this...
LEERRRROOYYY JENNNKIINNNNNSSS.
Outline
Here's a breakdown of the four steps that we'll go through to accomplish this task:
- Scrape + clean the data using
requests,webfrompattern, andpandas
- Extract features from the data using
fuzzywuzzyand domain knowledge - Perform and analyze PCA using
sklearn - Visualize + interpret results using the
plotlygraphing library
First some boring imports and settings (feel free to skip over)
# boring imports

%matplotlib inline
import numpy as np
import pandas as pd
import matplotlib.pylab as plt

import requests
from pattern import web
requests.packages.urllib3.disable_warnings()

import re, string
from sets import Set
from collections import Counter
from fuzzywuzzy import fuzz

database = {}
pd.set_option('display.max_rows', 10)

# Silly helper functions

def isInt(s):
    try:
        int(s)
        return True
    except ValueError:
        return False

def anyIntOrColor(l):
    for val in l:
        if isInt(val) | (val in ['Black', 'Red', 'Green', 'Blue', 'White']) : return True
    return False
(1) -- Scrape baby, scrape
Our first order of business is scraping the data from the Gatherer database using requests and web from pattern. In it's simplest form, every Magic card has a name, text, type, mana cost, and power/toughness (if it's a creature). An example is Hypnotic Specter, a powerful creature in the early days of Magic:

To scrape the relevant card features, we will construct card URLs using the card's multiverse_id and on the page we load will look for unique HTML elements that correspond to each of the features we will to obtain.
# grabCard scrapes:

# name, types, text (lowered, alphanumeritized), mana cost,
# cmc, power and toughness, and rarity.

# and adds it to the global card database

def grabCard(multiverse_id):
    xml = "http://gatherer.wizards.com/Pages/Card/Details.aspx?multiverseid=" + str(multiverse_id)
    dom = web.Element(requests.get(xml).text)

    # card name, card type
    cardName = dom('div.cardImage img')[0].attributes['alt'] if dom('div .cardImage img') else ''
    cardType = [element.strip() for element in \
                dom('div#ctl00_ctl00_ctl00_MainContent_SubContent_SubContent_typeRow div.value')[0].content.split(u'\u2014')]

    # extract, parse, clean text into a list
    cardText = []
    pattern = re.compile('[\W_]+')
    for line in dom('div.cardtextbox'):
        for element in line:
            cardText.append(element)

    for i in xrange(len(cardText)):
        if cardText[i].type == 'element' and cardText[i].tag == 'img':
            cardText[i] = cardText[i].attributes['alt']
        else:
            cardText[i] = str(cardText[i]).strip().lower()
        pattern.sub('', cardText[i])

    # mana symbols
    manaCost = [element.attributes['alt'] for element in dom('div#ctl00_ctl00_ctl00_MainContent_SubContent_SubContent_manaRow div.value img')]
    cmc = int(dom('div#ctl00_ctl00_ctl00_MainContent_SubContent_SubContent_cmcRow div.value')[0].content.strip()) \
            if dom('div#ctl00_ctl00_ctl00_MainContent_SubContent_SubContent_cmcRow div.value') else np.nan

    # rarity
    rarity = dom('div #ctl00_ctl00_ctl00_MainContent_SubContent_SubContent_rarityRow div.value span')[0].content.lower()

    # p/t
    power = np.nan
    power = [_.strip() for _ in dom('div#ctl00_ctl00_ctl00_MainContent_SubContent_SubContent_ptRow div.value')[0].content.split(' / ')][0] \
                if dom('div#ctl00_ctl00_ctl00_MainContent_SubContent_SubContent_ptRow div.value') else np.nan
    power = float(power) if power != '*' and power != np.nan else np.nan
    toughness = [_.strip() for _ in dom('div#ctl00_ctl00_ctl00_MainContent_SubContent_SubContent_ptRow div.value')[0].content.split(' / ')][1] \
                    if dom('div#ctl00_ctl00_ctl00_MainContent_SubContent_SubContent_ptRow div.value') else np.nan
    toughness = float(toughness) if (toughness != '*' and toughness != '7-*' and toughness != np.nan) else np.nan

    # add data
    database[cardName] = {
                            'cardType' : cardType,
                            'cardText' : cardText,
                            'manaCost' : manaCost,
                            'cmc' : cmc,
                            'rarity': rarity,
                            'power' : power,
                            'toughness' : toughness
                         }
Perform the scraping
We'll iterate through a range of multiverse_ids to scrape a desired amount of cards. Note that it takes around 1 minute/500 multiverse_ids. Given that there are 13k+ cards (and multiple versions of each -- see below), we'll limit our scraping to ~500 cards from the very first Magic set: Alpha.
cardsToScrape = 600

for i in xrange(1, cardsToScrape):
    if (i % 100 == 0): print "Grabbed " + str(i)
    grabCard(i)

print "Done!"
Grabbed 100
Grabbed 200
Grabbed 300
Grabbed 400
Grabbed 500
Done!
At this point, we now have roughly cardsToScrape cards and associated values in a local dict using the cardName as the key. (Note that we have less than cardsToScrape as we're iterating over multiverse_ids and some ids don't actually match to a card page.)
Note for potential future work
There are other aspects represented on the Gatherer database such as set and community ratings but we leave this to future work. Annoyingly, for cards in multiple sets, the card will have a different page (and subsequently different set of ratings) for each set; though this would require more work, it'd be super interesting if you could predict a card's community interest (# ratings) and favorability (average rating).
Making the data usable
We'll now put this into a pandas dataframe for cleaning, variable creation and initial analysis/spot checking/understanding.
data = pd.DataFrame.from_dict(database, orient='index')
data['cardName'] = data.index
data
| toughness | power | cmc | rarity | cardType | cardText | manaCost | cardName | |
|---|---|---|---|---|---|---|---|---|
| Air Elemental | 4 | 4 | 5 | uncommon | [Creature, Elemental] | [flying] | [3, Blue, Blue] | Air Elemental |
| Ancestral Recall | NaN | NaN | 1 | rare | [Instant] | [target player draws three cards.] | [Blue] | Ancestral Recall |
| Animate Artifact | NaN | NaN | 4 | uncommon | [Enchantment, Aura] | [enchant artifact, as long as enchanted artifa... | [3, Blue] | Animate Artifact |
| Animate Dead | NaN | NaN | 2 | uncommon | [Enchantment, Aura] | [enchant creature card in a graveyard, when an... | [1, Black] | Animate Dead |
| Animate Wall | NaN | NaN | 1 | rare | [Enchantment, Aura] | [enchant wall, enchanted wall can attack as th... | [White] | Animate Wall |
| ... | ... | ... | ... | ... | ... | ... | ... | ... |
| Winter Orb | NaN | NaN | 2 | rare | [Artifact] | [players can't untap more than one land during... | [2] | Winter Orb |
| Wooden Sphere | NaN | NaN | 1 | uncommon | [Artifact] | [whenever a player casts a green spell, you ma... | [1] | Wooden Sphere |
| Word of Command | NaN | NaN | 2 | rare | [Instant] | [look at target opponent's hand and choose a c... | [Black, Black] | Word of Command |
| Wrath of God | NaN | NaN | 4 | rare | [Sorcery] | [destroy all creatures. they can't be regenera... | [2, White, White] | Wrath of God |
| Zombie Master | 3 | 2 | 3 | rare | [Creature, Zombie] | [other zombie creatures have swampwalk., other... | [1, Black, Black] | Zombie Master |
296 rows × 8 columns
(2) -- Feature extraction
Based on our domain knowledge, we're going to extract four main types of features for each card:
- Mana cost and mana amounts of a card
- Categorical features -- type (i.e. Artifact, Creature, etc.) and rarity (i.e. Common, Uncommon, etc.)
- Text features based on the card's text (i.e. "When this creature enters the battlefield...")
- Functional features -- having a Tap ability, being a mana generator, etc.
# Which features do we want to use?
# All enabled by default, mana and categorical features required

textFeatures = True
functionalFeatures = True
(2.1) -- Mana features
# Create mana features

colorlessMana = []
colorless = []

for row in data['manaCost']:
    found = 0
    for val in row:
        if isInt(val):
            colorlessMana.append(float(val))
            found = 1
    if found == 0:
        colorlessMana.append(0)

data['colorlessMana'] = colorlessMana
data['Variable Colorless'] = [1 if 'Variable Colorless' in text else 0 for text in data['manaCost']]
# Count mana symbols

manaSymbols = []

manaSymbols = ['Blue', 'Black', 'Red', 'Green', 'White']
manaVars = ['mana_' + _ for _ in manaSymbols]

for i in xrange(len(manaSymbols)):
    data[manaVars[i]] = [text.count(manaSymbols[i]) for text in data['manaCost']]
    data[manaSymbols[i]] = [1 if text.count(manaSymbols[i]) > 0 else 0 for text in data['manaCost']]
# Find color (ignores multicolor)

def isColorless(l):
    for val in l:
        if val in manaSymbols: return False
    return True

data['Artifact'] = [1 if isColorless(x) else 0 for x in data['manaCost']]

def findColor(l):
    for val in l:
        if not isInt(val) and val != 'Variable Colorless': return val
    return 'Artifact'

data['color'] = [findColor(l) for l in data['manaCost']]

data.groupby(data['color']).describe().to_csv('colorSummary.csv')
data.groupby(data['color']).describe()
| Artifact | Black | Blue | Green | Red | Variable Colorless | White | cmc | colorlessMana | mana_Black | mana_Blue | mana_Green | mana_Red | mana_White | power | toughness | ||
|---|---|---|---|---|---|---|---|---|---|---|---|---|---|---|---|---|---|
| color | |||||||||||||||||
| Artifact | count | 62 | 62 | 62 | 62 | 62 | 62 | 62 | 47.000000 | 62.000000 | 62 | 62 | 62 | 62 | 62.00 | 5.000000 | 5.000000 |
| mean | 1 | 0 | 0 | 0 | 0 | 0 | 0 | 2.361702 | 1.790323 | 0 | 0 | 0 | 0 | 0.00 | 2.400000 | 5.000000 | |
| std | 0 | 0 | 0 | 0 | 0 | 0 | 0 | 1.673652 | 1.775397 | 0 | 0 | 0 | 0 | 0.00 | 2.302173 | 1.414214 | |
| min | 1 | 0 | 0 | 0 | 0 | 0 | 0 | 0.000000 | 0.000000 | 0 | 0 | 0 | 0 | 0.00 | 0.000000 | 3.000000 | |
| 25% | 1 | 0 | 0 | 0 | 0 | 0 | 0 | 1.000000 | 0.000000 | 0 | 0 | 0 | 0 | 0.00 | 0.000000 | 4.000000 | |
| ... | ... | ... | ... | ... | ... | ... | ... | ... | ... | ... | ... | ... | ... | ... | ... | ... | ... |
| White | min | 0 | 0 | 0 | 0 | 0 | 0 | 1 | 1.000000 | 0.000000 | 0 | 0 | 0 | 0 | 1.00 | 1.000000 | 1.000000 |
| 25% | 0 | 0 | 0 | 0 | 0 | 0 | 1 | 1.000000 | 0.000000 | 0 | 0 | 0 | 0 | 1.00 | 1.500000 | 1.000000 | |
| 50% | 0 | 0 | 0 | 0 | 0 | 0 | 1 | 2.000000 | 1.000000 | 0 | 0 | 0 | 0 | 1.00 | 2.000000 | 2.000000 | |
| 75% | 0 | 0 | 0 | 0 | 0 | 0 | 1 | 3.000000 | 1.000000 | 0 | 0 | 0 | 0 | 1.75 | 3.000000 | 4.500000 | |
| max | 0 | 0 | 0 | 0 | 0 | 1 | 1 | 6.000000 | 3.000000 | 0 | 0 | 0 | 0 | 3.00 | 6.000000 | 6.000000 |
48 rows × 16 columns
(2b) -- Categorical features
# Create categorical features

primaryTypes = [cardType[0] for cardType in data['cardType']]

for i in xrange(len(primaryTypes)):
    if primaryTypes[i] == u'Basic Land':
        primaryTypes[i] = u'Land'
    if primaryTypes[i] == u'Artifact Creature':
        primaryTypes[i] = u'Creature'

data['Primary Type'] = primaryTypes

data = pd.concat([data, pd.get_dummies(data['Primary Type'])], axis=1)
data = pd.concat([data, pd.get_dummies(data['rarity'])], axis=1)

data.groupby(data['rarity']).describe().to_csv('byRarity.csv')
data.groupby(data['rarity']).describe()

data.groupby(data['Primary Type']).describe().to_csv('byType.csv')
data.groupby(data['Primary Type']).describe()
| toughness | power | cmc | colorlessMana | Variable Colorless | mana_Blue | Blue | mana_Black | Black | mana_Red | ... | Artifact | Creature | Enchantment | Instant | Land | Sorcery | basic land | common | rare | uncommon | ||
|---|---|---|---|---|---|---|---|---|---|---|---|---|---|---|---|---|---|---|---|---|---|---|
| Primary Type | ||||||||||||||||||||||
| Artifact | count | 1 | 1 | 43.000000 | 43.000000 | 43 | 43 | 43 | 43.00 | 43.00 | 43 | ... | 43 | 43 | 43 | 43 | 43 | 43 | 43 | 43.00 | 43.000000 | 43.000000 |
| mean | 6 | 3 | 2.116279 | 2.116279 | 0 | 0 | 0 | 0.00 | 0.00 | 0 | ... | 1 | 0 | 0 | 0 | 0 | 0 | 0 | 0.00 | 0.604651 | 0.395349 | |
| std | NaN | NaN | 1.499354 | 1.499354 | 0 | 0 | 0 | 0.00 | 0.00 | 0 | ... | 0 | 0 | 0 | 0 | 0 | 0 | 0 | 0.00 | 0.494712 | 0.494712 | |
| min | 6 | 3 | 0.000000 | 0.000000 | 0 | 0 | 0 | 0.00 | 0.00 | 0 | ... | 1 | 0 | 0 | 0 | 0 | 0 | 0 | 0.00 | 0.000000 | 0.000000 | |
| 25% | 6 | 3 | 1.000000 | 1.000000 | 0 | 0 | 0 | 0.00 | 0.00 | 0 | ... | 1 | 0 | 0 | 0 | 0 | 0 | 0 | 0.00 | 0.000000 | 0.000000 | |
| ... | ... | ... | ... | ... | ... | ... | ... | ... | ... | ... | ... | ... | ... | ... | ... | ... | ... | ... | ... | ... | ... | ... |
| Sorcery | min | NaN | NaN | 1.000000 | 0.000000 | 0 | 0 | 0 | 0.00 | 0.00 | 0 | ... | 0 | 0 | 0 | 0 | 0 | 1 | 0 | 0.00 | 0.000000 | 0.000000 |
| 25% | NaN | NaN | 1.250000 | 0.000000 | 0 | 0 | 0 | 0.00 | 0.00 | 0 | ... | 0 | 0 | 0 | 0 | 0 | 1 | 0 | 0.00 | 0.000000 | 0.000000 | |
| 50% | NaN | NaN | 2.000000 | 1.000000 | 0 | 0 | 0 | 0.00 | 0.00 | 0 | ... | 0 | 0 | 0 | 0 | 0 | 1 | 0 | 0.00 | 0.000000 | 0.000000 | |
| 75% | NaN | NaN | 3.000000 | 2.000000 | 1 | 0 | 0 | 0.75 | 0.75 | 0 | ... | 0 | 0 | 0 | 0 | 0 | 1 | 0 | 0.75 | 1.000000 | 0.750000 | |
| max | NaN | NaN | 4.000000 | 3.000000 | 1 | 3 | 1 | 3.00 | 1.00 | 1 | ... | 0 | 0 | 0 | 0 | 0 | 1 | 0 | 1.00 | 1.000000 | 1.000000 |
48 rows × 26 columns
(2c) -- Text features
A helper function from fuzzywuzzy to find partial word matches in card text boxes:
def partialMatch(s, l, threshold=95):
    fuzzVals = [fuzz.partial_ratio(s, x) for x in l]
    if not fuzzVals: fuzzVals = [0]
    return max(fuzzVals) >= threshold
Based on domain knowledge, we'll fuzzy match if certain important words are in a card's text box that will give us a hint of what the card does.
# Create text-based features

if textFeatures:

    data['Damage'] = [1 if partialMatch('damage', l) else 0 for l in data['cardText']]
    data['Hand'] = [1 if partialMatch('hand', l) else 0 for l in data['cardText']]
    data['Draw'] = [1 if partialMatch('draw', l, 80) else 0 for l in data['cardText']]
    data['Upkeep'] = [1 if partialMatch('draw', l, 80) else 0 for l in data['cardText']]
    data['Library'] = [1 if partialMatch('library', l) else 0 for l in data['cardText']]
    data['Sacrifice'] = [1 if partialMatch('sacrifice', l) else 0 for l in data['cardText']]
    data['Destroy'] = [1 if partialMatch('destroy', l) else 0 for l in data['cardText']]
    data['Discard'] = [1 if partialMatch('discard', l) else 0 for l in data['cardText']]
    data['Prevent'] = [1 if partialMatch('prevent', l) else 0 for l in data['cardText']]
    data['Life'] = [1 if partialMatch('life', l) else 0 for l in data['cardText']]
    data['Attack'] = [1 if partialMatch('attack', l) else 0 for l in data['cardText']]
    data['Block'] = [1 if partialMatch('block', l) else 0 for l in data['cardText']]
    data['Search'] = [1 if partialMatch('search', l) else 0 for l in data['cardText']]
    data['Choose'] = [1 if partialMatch('choose', l) else 0 for l in data['cardText']]
    data['Copy'] = [1 if partialMatch('copy', l) else 0 for l in data['cardText']]
    data['Change'] = [1 if partialMatch('change', l) else 0 for l in data['cardText']]
    data['Turn'] = [1 if partialMatch('turn', l) else 0 for l in data['cardText']]
    data['End of turn'] = [1 if partialMatch('end of turn', l, 80) else 0 for l in data['cardText']]
    data['Beginning of turn'] = [1 if partialMatch('beginning of turn', l, 80) else 0 for l in data['cardText']]
    data['Spell ref'] = [1 if partialMatch('spell', l) else 0 for l in data['cardText']]
    data['Creature ref'] = [1 if partialMatch('creature', l) else 0 for l in data['cardText']]
    data['Land'] = [1 if partialMatch('land', l) else 0 for l in data['cardText']]
    data['Mana'] = [1 if partialMatch('mana', l) else 0 for l in data['cardText']]
    data['Battlefield'] = [1 if partialMatch('battlefield', l) else 0 for l in data['cardText']]
    data['Blue ref'] = [1 if partialMatch('blue', l) else 0 for l in data['cardText']]
    data['Black ref'] = [1 if partialMatch('black', l) else 0 for l in data['cardText']]
    data['Green ref'] = [1 if partialMatch('green', l) else 0 for l in data['cardText']]
    data['Red ref'] = [1 if partialMatch('red', l) else 0 for l in data['cardText']]
    data['White ref'] = [1 if partialMatch('white', l) else 0 for l in data['cardText']]
    data['Colorless ref'] = [1 if partialMatch('colorless', l) else 0 for l in data['cardText']]
(2d) -- Functional features
# 4. Special functional features

def isBuff(str, l):
    found = 0
    for val in l:
        if str in val:
            found += 1
    if found > 0: return True
    else: return False

if functionalFeatures:

    data['Untap'] = [1 if partialMatch('untap', l) else 0 for l in data['cardText']]
    data['All'] = [1 if partialMatch('all', l) | partialMatch('any', l) else 0 for l in data['cardText']]

    data['Tap ability'] = [1 if 'Tap' in x else 0 for x in data['cardText']]
    data['Mana symbol'] = [1 if anyIntOrColor(x) else 0 for x in data['cardText']]
    data['Mana related'] = [1 if partialMatch('add mana', l) | partialMatch('your mana pool', l) \
                                  else 0 for l in data['cardText']]

    data['Buff'] = [1 if isBuff('+', l) else 0 for l in data['cardText']]
    data['Debuff'] = [1 if isBuff('-', l) else 0 for l in data['cardText']]
Note
Some of this might have been able to be done automatically, especially the text features, which could have been done by finding the most common words referred to in text boxes. Again, I leave this to future work and am really curious about what the literature on automatic feature creation says about this.
(3) -- Perform PCA
Surprisingly, the PCA itself is the easiest part of this entire thing. We'll use sklearn to perform a 10-component PCA to see how much of the entire data's dimensional variation can be reduced to 10 dimensions.
from sklearn.cluster import KMeans
from sklearn.decomposition import PCA
from sklearn.preprocessing import scale
from sklearn.preprocessing import StandardScaler

numericData = data.copy()
# scale to mean 0, variance 1
numericData_std = scale(numericData.fillna(0).select_dtypes(include=['float64', 'int64']))

pca = PCA(n_components=10)
Y_pca = pca.fit_transform(numericData_std)
So, how well did we do?
Well, based on the explained variance vector below it doesn't look like we did very well. The first two principal components only combined for 14% of the total variance in the data; though, of note, is that the first 10 factors do account for 46% of the total variance. Considering we're working with 62 features though, this is pretty decent.
# Analysis of PCA effectiveness

print
print "Variance explained by each factor:"
print [round(x, 3) for x in pca.explained_variance_ratio_]
print
print "Variance explained by all 10 factors:"
print round(sum(pca.explained_variance_ratio_), 3)
print
print "Num features:"
print len(numericData_std[0])
Variance explained by each factor:
[0.08, 0.062, 0.053, 0.052, 0.042, 0.039, 0.038, 0.036, 0.033, 0.03]

Variance explained by all 10 factors:
0.464

Num features:
62
(4) -- Results
Now time to see if it was all worth it -- and apply the PCA projection onto our data set. We want to be able to make a pretty scatterplot grouping the data by different types (color, card type, rarity, etc.) so we will make a helper graphing function using the plotly library.
import plotly.plotly as py
py.sign_in('nhuber', 'bmopo8hk40')
from plotly.graph_objs import *
import plotly.tools as tls

def chooseColor(group):

    if group == u'White': return '#B2B2B2'
    if group == u'Artifact': return '#996633'
    if group == u'Red' : return '#E50000'
    if group == u'Blue': return '#0000FF'
    if group == u'Green' : return '#006400'
    if group == u'Black' : return '#000000'

    if group == 'Instant': return '#E81A8C'
    if group == 'Sorcery': return '#F2AB11'
    if group == 'Creature' : return '#102DE8'
    if group == 'Enchantment': return '#1BBF28'
    if group == 'Land' : return '#000000'
    if group == 'Artifact' : return '#82580E'

    if group == 'common' : return '#000000'
    if group == 'uncommon': return '#9a9999'
    if group == 'rare': return '#eae002'
    if group == 'basic land': return '#ba7127'
# graphs data on pca axes grouped by type thetype

def graphByType(thetype, thetitle, centers=False, fix=-1, typefilter='',
               height=625, width=725, markerfontsize=9, titlefontsize=26):

    # fix reflects data through y = 0 to be backwards
    # compatible with previous annotated visualizations

    # create graph data from pca results

    traces = []

    if not typefilter:
        typefilter = set(data[thetype])

    for group in typefilter:

        matches = []
        for i in xrange(len(data[thetype])):
            if data[thetype].irow(i) == group:
                matches.append(i)

        graphColor = chooseColor(group)

        trace = Scatter(
            x=Y_pca[matches,0],
            y=fix * Y_pca[matches,1],
            mode='text',
            name=group,
            marker=Marker(
                size=8,
                color=graphColor,
                opacity=0.5),
            text = data['cardName'].irow(matches),
            textfont = Font(
                family='Georgia',
                size=markerfontsize,
                color=graphColor
                )
            )

        traces.append(trace)

        if centers:

            traceCentroid = Scatter(
                x = np.mean(Y_pca[matches,0]),
                y = np.mean(fix * Y_pca[matches,1]),
                mode = 'marker',
                name = str(thetype) + " center",
                marker = Marker(
                    size = 26,
                    color=graphColor),
                opacity = 0.75
            )

            traces.append(traceCentroid)

    # Set up the scatter plot layout

    dataToGraph = Data(traces)

    # auto-focus on where most of the data is clustered
    xRange = max(abs(np.percentile(np.array([x[0] for x in Y_pca]), 2.5)),
                abs(np.percentile(np.array([x[0] for x in Y_pca]), 97.5)))
    yRange = max(abs(np.percentile(np.array([x[1] for x in Y_pca]), 2.5)),
                abs(np.percentile(np.array([x[1] for x in Y_pca]), 97.5)))

    layout = Layout(title=thetitle,
                titlefont=Font(family='Georgia', size=titlefontsize),
                showlegend = True,
                autosize = False,
                height = height,
                width = width,
                xaxis=XAxis(
                    range=[-xRange, +xRange],
                    title='PC1', showline=False),
                yaxis=YAxis(
                    range=[-yRange, +yRange],
                    title='PC2', showline=False))

    fig = Figure(data=dataToGraph, layout=layout)
    return fig
(4a) -- Grouping by color
We first visualize all of our cards on the two PCA axes, grouped by color.
fig = graphByType('color', "PCA on MtG by card color")
py.iplot(fig)
A few notes on this graph:
- It's interactive: you can zoom into an area on the graph by dragging to create a rectangle
- Also note that you can click the labels on the top right to turn on and off showing cards of different colors
- It will probably have more meaning if you know about Magic and what each of these cards do; so, I'll offer my analysis below but if you do play and have alternate interpretations about how these cards are grouped, please do lmk
Result 1: A tale of two psuedo-axes
The primary result of this analysis is that a magic card can be mainly broken down into two components: How much does it behave like a spell vs. a creature? and How much does it affect the board or non-board resources? Visually, we are left with two "psuedo-axes":
- On the left downward diagonal -- a creature axis which represents how "creature-y" a card is: big creatures are very creature-y, mid-sized utility creatures are somewhat creature-y, and enchantments/spells are not creature-y at all.
- On the right upward diagonal, we have the mana/hand axis -- which is a spectrum on how much a card relates primarily to the board (i.e. permanents in play) or whether it affects non-board resources such as the player's cards and mana pools.
Going through salient examples
We'll now go through the highlighted examples in the above graph, from left to right, to understand and evaluate how the model performs; my evaluation out of 5 for each card plotting is in parenthesis in the title:
Juzam Djinn and Juggernaut (5/5)


- Classic examples of "fatties," large creatures that dominate the board through sheer size
- Very creature-y and very board-related
Goblin King, Old Man of the Sea and White Knight (5/5)


- Classic examples of "utility creatures": medium size (2/2, 2/3, and 2/2 respectively) but have impact on the board through their abilities
- Mostly creature-y and very board-related
Berserk, Raise dead (5/5)


- Combat trick that offers a one-time pump for a creature in combat and enchantment that revives a creature from the graveyard
- Appropriately somewhat creature-y and very board-related
Birds of Paradise (5/5), Manabarbs (4/5)
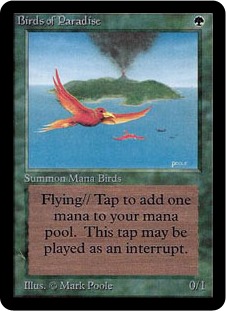

- Birds of paradise -- a tiny, one-drop creature that provides mana ramping ability: the model correctly realizes it's a utility creature (i.e. medium creature-y) and is heavily related to a non-board resource, namely: mana.
- Manabarbs is similarly a permanent, mana-based effect but it also impacts player's life totals so is appropriately in the middle of this axis
- Medium creature-y, mostly mana/hand
Balance (4/5)
 - A high-impact spell that equalizes both players creature counts, cards in hand, and lands in play.
- *Very spell-y* and related to *mostly non-board* resources (though it does equalize creatures as well)
- A high-impact spell that equalizes both players creature counts, cards in hand, and lands in play.
- *Very spell-y* and related to *mostly non-board* resources (though it does equalize creatures as well)
Red elemental blast (4/5)
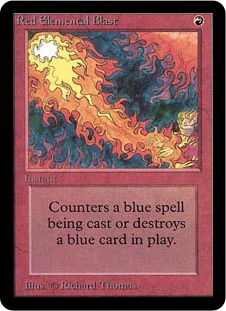 - This is a tough one for the model: this card has two modes: destroy a blue permanent or counter a blue spell. Clearly, these are very different cards. But the model correctly predicts that it's very *spell-y* and mostly *board-related*
Wheel of Fortune, Ancestral Recall (5/5)

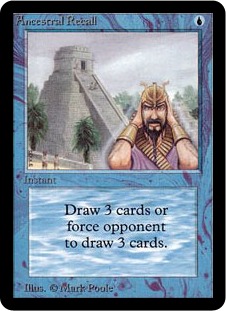
- Perfect categorization for Wheel: this is a completely unique spell in the game where each player discards their hand and draws 7 new cards. Not a creature at all, not related to the board at all; therefore, is correctly labelled spell-y and mana/hand-y
- Great categorization again for Ancestral: an instant-speed draw spell (note that it's right next to Braingeyser as well): very spell-y very mana/hand-y
Howling Mine (3/5)
 - Primarily card-related (each player draws 2 instead of 1) and a permanent effect so somewhat *creature-y*
- Strange card because it has a permanent effect on card resources which is rare (i.e. vs. draw spells, discard spells)
- Primarily card-related (each player draws 2 instead of 1) and a permanent effect so somewhat *creature-y*
- Strange card because it has a permanent effect on card resources which is rare (i.e. vs. draw spells, discard spells)
Demonic Tutor, Black Lotus (5/5)


- DT: The canonical tutor effect; very spell-y and hand-y
- Black Lotus: the canonical magic card; pure power in a one-time rush of mana (very spell-y and very mana-y)
Summary
The model does a very good job categorizing cards across these two psuedo-axes. Unsurprisingly, the hardest cards to categorize are those that cross many axes -- Balance in it's all-encompassing scope or Red Elemental Blast in its multiple modes -- or have non-traditional effects like Howling Mine being a card-drawing artifact.
Result 2: Exploring the color identities
The PCA also tells a cool story of how different the colors are defined. Here each card is a small point, with the large point representing the "average" of all of the color's cards:
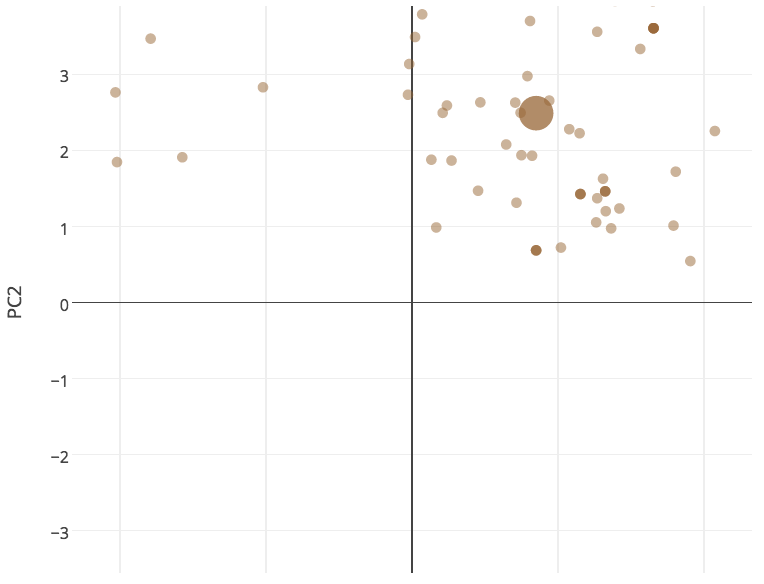


- Artifacts are somewhat creature-y, somewhat spell-y (as they can have different effects depending on the card) but generally are more related to mana/hand resources than board effects (except for the Artifact creatures like Juggernaut that are correctly by other fatties like Juzam)
- Blue and White seem to be, like all of the non-artifact colors, a mix of creatures and spells, but they skew towards the spell side; unlike Green, Red, and Black (the first two are very creature-y, the last a mix)
- This is consistent with the intuitive color identity you have when you play the game: Blue and White are tricky, controlling decks; Red and Green are fatty/monster decks and Black is somewhat in between, arguably the most flexible color in the game in terms of large creatures, mana effects and also removal
Result 3: Exploring the type identities
fig = graphByType('Primary Type', "PCA on MtG by card type")
py.iplot(fig)
The model correctly associates creatures on the creature axis, instants and sorceries on the spell axis (with ones related to mana like Dark Ritual or Contract from Below higher on the mana/hand axis), enchantments in the "spell-like" but permanent effects region and lands in the mana-related zone. Artifacts because of their unique nature are incredibly hard to categorize and honestly the model probably doesn't do a great job for most of them, and sort of arbitrarily groups them in their own group as a whole, saying they're also mostly mana/hand-y, but there's likely a lot more that could be teased out here to get the artifacts to be distributed more uniformly/appropriately across these axes.
Result 4: Exploring rarity
fig = graphByType('rarity', "PCA on MtG by card rarity")
py.iplot(fig)
Rares are allowed to have all kinds of effects (i.e. spread across both axes), uncommons as well but less so (i.e. less smattered), commons limited to medium-sized creatures and non-mana/hand-related spells. This is consistent with the game designer's views on what "feels like a common" or what power levels different types of cards are able to have.
Conclusions and future work
There's tons more work to do here that I'd love to if I have time:
- Play with what features to use (which are the most impactful -- almost certainly type and color, but what else? could we automatically create them from card text boxes without domain knowledge? of those which are the most meaningful?)
- What separates good cards from bad cards? how could we automatically detect/predict card quality?
- What determines popular/interesting cards? (note that Gatherer also has community ratings for every card ever made
- Does this analysis hold for the entire corpus of magic cards? how about for different sets? does it get better or worse over time?
Until then,
@nhuber | nicholas.e.huber@gmail.com
custom css