Unit 2.3 Extracting Information from Data, Pandas
Data connections, trends, and correlation. Pandas is introduced as it could be valuable for PBL, data validation, as well as understanding College Board Topics.
- toc: true
- image: /images/python.png
- categories: []
- type: ap
- week: 25
Files To Get
Save this file to your _notebooks folder
Save these files into a subfolder named files in your _notebooks folder
wget https://raw.githubusercontent.com/nighthawkcoders/APCSP/master/_notebooks/files/data.csv
wget https://raw.githubusercontent.com/nighthawkcoders/APCSP/master/_notebooks/files/grade.json
Save this image into a subfolder named images in your _notebooks folder
wget https://raw.githubusercontent.com/nighthawkcoders/APCSP/master/_notebooks/images/table_dataframe.png
Pandas and DataFrames
In this lesson we will be exploring data analysis using Pandas.
College Board talks about ideas like
- Tools. "the ability to process data depends on users capabilities and their tools"
- Combining Data. "combine county data sets"
- Status on Data"determining the artist with the greatest attendance during a particular month"
- Data poses challenge. "the need to clean data", "incomplete data"
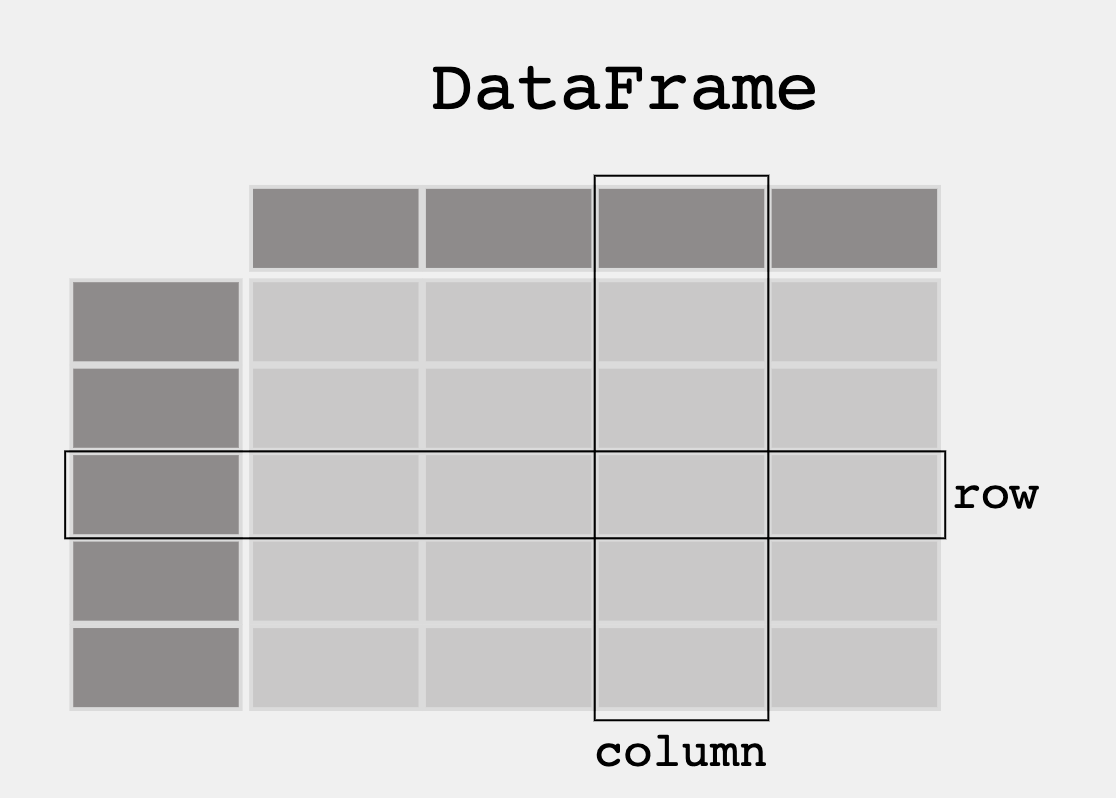
From Pandas Overview -- When working with tabular data, such as data stored in spreadsheets or databases, pandas is the right tool for you. pandas will help you to explore, clean, and process your data. In pandas, a data table is called a DataFrame.

'''Pandas is used to gather data sets through its DataFrames implementation'''
import pandas as pd
Cleaning Data
When looking at a data set, check to see what data needs to be cleaned. Examples include:
- Missing Data Points
- Invalid Data
- Inaccurate Data
Run the following code to see what needs to be cleaned
# reads the JSON file and converts it to a Pandas DataFrame
df = pd.read_json('files/grade.json')

print(df)
# What part of the data set needs to be cleaned?
# From PBL learning, what is a good time to clean data?  Hint, remember Garbage in, Garbage out?
   Student ID Year in School   GPA
0         123             12  3.57
1         246             10  4.00
2         578             12  2.78
3         469             11  3.45
4         324         Junior  4.75
5         313             20  3.33
6         145             12  2.95
7         167             10  3.90
8         235      9th Grade  3.15
9         nil              9  2.80
10        469             11  3.45
11        456             10  2.75
Extracting Info
Take a look at some features that the Pandas library has that extracts info from the dataset
DataFrame Extract Column
#print the values in the points column with column header
print(df[['GPA']])

print()

#try two columns and remove the index from print statement
print(df[['Student ID','GPA']].to_string(index=False))
     GPA
0   3.57
1   4.00
2   2.78
3   3.45
4   4.75
5   3.33
6   2.95
7   3.90
8   3.15
9   2.80
10  3.45
11  2.75

Student ID  GPA
       123 3.57
       246 4.00
       578 2.78
       469 3.45
       324 4.75
       313 3.33
       145 2.95
       167 3.90
       235 3.15
       nil 2.80
       469 3.45
       456 2.75
DataFrame Sort
#sort values
print(df.sort_values(by=['GPA']))

print()

#sort the values in reverse order
print(df.sort_values(by=['GPA'], ascending=False))
   Student ID Year in School   GPA
11        456             10  2.75
2         578             12  2.78
9         nil              9  2.80
6         145             12  2.95
8         235      9th Grade  3.15
5         313             20  3.33
3         469             11  3.45
10        469             11  3.45
0         123             12  3.57
7         167             10  3.90
1         246             10  4.00
4         324         Junior  4.75

   Student ID Year in School   GPA
4         324         Junior  4.75
1         246             10  4.00
7         167             10  3.90
0         123             12  3.57
3         469             11  3.45
10        469             11  3.45
5         313             20  3.33
8         235      9th Grade  3.15
6         145             12  2.95
9         nil              9  2.80
2         578             12  2.78
11        456             10  2.75
DataFrame Selection or Filter
#print only values with a specific criteria
print(df[df.GPA > 3.00])
   Student ID Year in School   GPA
0         123             12  3.57
1         246             10  4.00
3         469             11  3.45
4         324         Junior  4.75
5         313             20  3.33
7         167             10  3.90
8         235      9th Grade  3.15
10        469             11  3.45
DataFrame Selection Max and Min
print(df[df.GPA == df.GPA.max()])
print()
print(df[df.GPA == df.GPA.min()])
  Student ID Year in School   GPA
4        324         Junior  4.75

   Student ID Year in School   GPA
11        456             10  2.75
Create your own DataFrame
Using Pandas allows you to create your own DataFrame in Python.
Python Dictionary to Pandas DataFrame
import pandas as pd

#the data can be stored as a python dictionary
dict = {
  "calories": [420, 380, 390],
  "duration": [50, 40, 45]
}
#stores the data in a data frame
print("-------------Dict_to_DF------------------")
df = pd.DataFrame(dict)
print(df)

print("----------Dict_to_DF_labels--------------")

#or with the index argument, you can label rows.
df = pd.DataFrame(dict, index = ["day1", "day2", "day3"])
print(df)
-------------Dict_to_DF------------------
   calories  duration
0       420        50
1       380        40
2       390        45
----------Dict_to_DF_labels--------------
      calories  duration
day1       420        50
day2       380        40
day3       390        45
Examine DataFrame Rows
print("-------Examine Selected Rows---------")
#use a list for multiple labels:
print(df.loc[["day1", "day3"]])

#refer to the row index:
print("--------Examine Single Row-----------")
print(df.loc["day1"])
-------Examine Selected Rows---------
      calories  duration
day1       420        50
day3       390        45
--------Examine Single Row-----------
calories    420
duration     50
Name: day1, dtype: int64
Pandas DataFrame Information
#print info about the data set
print(df.info())
<class 'pandas.core.frame.DataFrame'>
Index: 3 entries, day1 to day3
Data columns (total 2 columns):
 #   Column    Non-Null Count  Dtype
---  ------    --------------  -----
 0   calories  3 non-null      int64
 1   duration  3 non-null      int64
dtypes: int64(2)
memory usage: 180.0+ bytes
None
Example of larger data set
Pandas can read CSV and many other types of files, run the following code to see more features with a larger data set
import pandas as pd

#read csv and sort 'Duration' largest to smallest
df = pd.read_csv('files/data.csv').sort_values(by=['Duration'], ascending=False)

print("--Duration Top 10---------")
print(df.head(10))

print("--Duration Bottom 10------")
print(df.tail(10))
--Duration Top 10---------
     Duration  Pulse  Maxpulse  Calories
69        300    108       143    1500.2
79        270    100       131    1729.0
109       210    137       184    1860.4
60        210    108       160    1376.0
106       180     90       120     800.3
90        180    101       127     600.1
65        180     90       130     800.4
61        160    110       137    1034.4
62        160    109       135     853.0
67        150    107       130     816.0
--Duration Bottom 10------
     Duration  Pulse  Maxpulse  Calories
68         20    106       136     110.4
100        20     95       112      77.7
89         20     83       107      50.3
135        20    136       156     189.0
94         20    150       171     127.4
95         20    151       168     229.4
139        20    141       162     222.4
64         20    110       130     131.4
112        15    124       139     124.2
93         15     80       100      50.5
APIs are a Source for Writing Programs with Data
3rd Party APIs are a great source for creating Pandas Data Frames.
- Data can be fetched and resulting json can be placed into a Data Frame
- Observe output, this looks very similar to a Database
'''Pandas can be used to analyze data'''
import pandas as pd
import requests

def fetch():
    '''Obtain data from an endpoint'''
    url = "https://flask.nighthawkcodingsociety.com/api/covid/"
    fetch = requests.get(url)
    json = fetch.json()

    # filter data for requirement
    df = pd.DataFrame(json['countries_stat'])  # filter endpoint for country stats
    print(df.loc[0:5, 'country_name':'deaths']) # show row 0 through 5 and columns country_name through deaths

fetch()
  country_name       cases     deaths
0          USA  82,649,779  1,018,316
1        India  43,057,545    522,193
2       Brazil  30,345,654    662,663
3       France  28,244,977    145,020
4      Germany  24,109,433    134,624
5           UK  21,933,206    173,352
Hacks
Early Seed award
- Add this Blog to you own Blogging site.
- Have all lecture files saved to your files directory before Tech Talk starts. Have data.csv open in vscode. Don't tell anyone. Show to Teacher.
AP Prep
- Add this Blog to you own Blogging site. In the Blog add notes and observations on each code cell.
- In blog add College Board practice problems for 2.3.
The next 4 weeks, Teachers want you to improve your understanding of data. Look at the blog and others on Unit 2. Your intention is to find some things to differentiate your individual College Board project.
Create or Find your own dataset. The suggestion is to use a JSON file, integrating with your PBL project would be *Amazing*.
When choosing a data set, think about the following...
- Does it have a good sample size?
- Is there bias in the data?
- Does the data set need to be cleaned?
- What is the purpose of the data set?
- ...
Continue this Blog using Pandas extract info from that dataset (ex. max, min, mean, median, mode, etc.)
Hack Helpers
Here is how Mort started on this assignment by asking ChatGPT ... Regarding Python Pandas, what are some data sets that would be good for learning Pandas?
There are many data sets that are suitable for learning pandas, depending on your interests and the skills you want to develop.
Here are some suggestions...
Titanic Dataset: This is a classic dataset for data analysis and machine learning, and is often used as an introduction to pandas. The dataset contains information about passengers on the Titanic, including their demographics, ticket class, and survival status.
Iris Dataset: This is another classic dataset that is often used in machine learning and data analysis courses. The dataset contains information about iris flowers, including their sepal length, sepal width, petal length, and petal width.
NBA Player Stats: This dataset contains information about NBA players, including their stats for various games, their positions, and their salaries. It is a great dataset for learning how to clean and manipulate data using pandas.
Housing Prices Dataset: This dataset contains information about housing prices in a particular city or region, including variables such as the number of bedrooms, square footage, and price. It is a great dataset for learning how to manipulate and analyze numerical data using pandas.
COVID-19 Dataset: This dataset contains information about the COVID-19 pandemic, including the number of cases, deaths, and recoveries in various countries and regions. It is a great dataset for learning how to manipulate and analyze time-series data using pandas.
World Bank Dataset: This dataset contains information about economic indicators from various countries, such as GDP, population, and poverty rates. It is a great dataset for learning how to manipulate and analyze large datasets using pandas.
These are just a few examples of the many datasets that are suitable for learning pandas. The best dataset for you will depend on your interests and the specific skills you want to develop.
Follow up question, "where can I find Titanic data set?"
The Titanic dataset is a popular dataset for data analysis and machine learning, and it can be found on various websites and data repositories. Here are a few places where you can find the Titanic dataset...
Kaggle: The Titanic dataset is available on Kaggle, which is a popular platform for data scientists and machine learning enthusiasts. You can download the dataset from the Kaggle website after creating an account.
UCI Machine Learning Repository: The Titanic dataset is also available on the UCI Machine Learning Repository, which is a collection of datasets that are commonly used for machine learning research. You can download the dataset from the UCI Machine Learning Repository website.
Seaborn library: If you have the Seaborn library installed in your Python environment, you can load the Titanic dataset directly from the library using the following code:
import seaborn as sns
titanic_data = sns.load_dataset('titanic')
Titanic Data
Look at a sample of data.
import seaborn as sns

# Load the titanic dataset
titanic_data = sns.load_dataset('titanic')

print("Titanic Data")


print(titanic_data.columns) # titanic data set

print(titanic_data[['survived','pclass', 'sex', 'age', 'sibsp', 'parch', 'class', 'fare', 'embark_town']]) # look at selected columns
Titanic Data
Index(['survived', 'pclass', 'sex', 'age', 'sibsp', 'parch', 'fare',
       'embarked', 'class', 'who', 'adult_male', 'deck', 'embark_town',
       'alive', 'alone'],
      dtype='object')
     survived  pclass     sex   age  sibsp  parch   class     fare  \
0           0       3    male  22.0      1      0   Third   7.2500
1           1       1  female  38.0      1      0   First  71.2833
2           1       3  female  26.0      0      0   Third   7.9250
3           1       1  female  35.0      1      0   First  53.1000
4           0       3    male  35.0      0      0   Third   8.0500
..        ...     ...     ...   ...    ...    ...     ...      ...
886         0       2    male  27.0      0      0  Second  13.0000
887         1       1  female  19.0      0      0   First  30.0000
888         0       3  female   NaN      1      2   Third  23.4500
889         1       1    male  26.0      0      0   First  30.0000
890         0       3    male  32.0      0      0   Third   7.7500

     embark_town
0    Southampton
1      Cherbourg
2    Southampton
3    Southampton
4    Southampton
..           ...
886  Southampton
887  Southampton
888  Southampton
889    Cherbourg
890   Queenstown

[891 rows x 9 columns]
Use Pandas to clean the data. Most analysis, like Machine Learning or even Pandas in general like data to be in standardized format. This is called 'Training' or 'Cleaning' data.
# Preprocess the data
from sklearn.preprocessing import OneHotEncoder


td = titanic_data
td.drop(['alive', 'who', 'adult_male', 'class', 'embark_town', 'deck'], axis=1, inplace=True)
td.dropna(inplace=True)
td['sex'] = td['sex'].apply(lambda x: 1 if x == 'male' else 0)
td['alone'] = td['alone'].apply(lambda x: 1 if x == True else 0)

# Encode categorical variables
enc = OneHotEncoder(handle_unknown='ignore')
enc.fit(td[['embarked']])
onehot = enc.transform(td[['embarked']]).toarray()
cols = ['embarked_' + val for val in enc.categories_[0]]
td[cols] = pd.DataFrame(onehot)
td.drop(['embarked'], axis=1, inplace=True)
td.dropna(inplace=True)

print(td)
     survived  pclass  sex   age  sibsp  parch      fare  alone  embarked_C  \
0           0       3    1  22.0      1      0    7.2500      0         0.0
1           1       1    0  38.0      1      0   71.2833      0         1.0
2           1       3    0  26.0      0      0    7.9250      1         0.0
3           1       1    0  35.0      1      0   53.1000      0         0.0
4           0       3    1  35.0      0      0    8.0500      1         0.0
..        ...     ...  ...   ...    ...    ...       ...    ...         ...
705         0       2    1  39.0      0      0   26.0000      1         0.0
706         1       2    0  45.0      0      0   13.5000      1         0.0
707         1       1    1  42.0      0      0   26.2875      1         0.0
708         1       1    0  22.0      0      0  151.5500      1         0.0
710         1       1    0  24.0      0      0   49.5042      1         1.0

     embarked_Q  embarked_S
0           0.0         1.0
1           0.0         0.0
2           0.0         1.0
3           0.0         1.0
4           0.0         1.0
..          ...         ...
705         0.0         1.0
706         0.0         1.0
707         1.0         0.0
708         0.0         1.0
710         0.0         0.0

[564 rows x 11 columns]
The result of 'Training' data is making it easier to analyze or make conclusions. In looking at the Titanic, as you clean you would probably want to make assumptions on likely chance of survival.
This would involve analyzing various factors (such as age, gender, class, etc.) that may have affected a person's chances of survival, and using that information to make predictions about whether an individual would have survived or not.
Data description:
- Survival - Survival (0 = No; 1 = Yes). Not included in test.csv file.
- Pclass - Passenger Class (1 = 1st; 2 = 2nd; 3 = 3rd)
- Name - Name
- Sex - Sex
- Age - Age
- Sibsp - Number of Siblings/Spouses Aboard
- Parch - Number of Parents/Children Aboard
- Ticket - Ticket Number
- Fare - Passenger Fare
- Cabin - Cabin
- Embarked - Port of Embarkation (C = Cherbourg; Q = Queenstown; S = Southampton)
Perished Mean/Average
print(titanic_data.query("survived == 0").mean())
survived       0.000000
pclass         2.464072
sex            0.844311
age           31.073353
sibsp          0.562874
parch          0.398204
fare          24.835902
alone          0.616766
embarked_C     0.185629
embarked_Q     0.038922
embarked_S     0.775449
dtype: float64
- Survived Mean/Average
print(td.query("survived == 1").mean())
survived       1.000000
pclass         1.878261
sex            0.326087
age           28.481522
sibsp          0.504348
parch          0.508696
fare          50.188806
alone          0.456522
embarked_C     0.152174
embarked_Q     0.034783
embarked_S     0.813043
dtype: float64
Survived Max and Min Stats
print(td.query("survived == 1").max())
print(td.query("survived == 1").min())
survived        1.0000
pclass          3.0000
sex             1.0000
age            80.0000
sibsp           4.0000
parch           5.0000
fare          512.3292
alone           1.0000
embarked_C      1.0000
embarked_Q      1.0000
embarked_S      1.0000
dtype: float64
survived      1.00
pclass        1.00
sex           0.00
age           0.75
sibsp         0.00
parch         0.00
fare          0.00
alone         0.00
embarked_C    0.00
embarked_Q    0.00
embarked_S    0.00
dtype: float64
Machine Learning Visit Tutorials Point
Scikit-learn (Sklearn) is the most useful and robust library for machine learning in Python. It provides a selection of efficient tools for machine learning and statistical modeling including classification, regression, clustering and dimensionality reduction via a consistence interface in Python.
Description from ChatGPT. The Titanic dataset is a popular dataset for data analysis and machine learning. In the context of machine learning, accuracy refers to the percentage of correctly classified instances in a set of predictions. In this case, the testing data is a subset of the original Titanic dataset that the decision tree model has not seen during training......After training the decision tree model on the training data, we can evaluate its performance on the testing data by making predictions on the testing data and comparing them to the actual outcomes. The accuracy of the decision tree classifier on the testing data tells us how well the model generalizes to new data that it hasn't seen before......For example, if the accuracy of the decision tree classifier on the testing data is 0.8 (or 80%), this means that 80% of the predictions made by the model on the testing data were correct....Chance of survival could be done using various machine learning techniques, including decision trees, logistic regression, or support vector machines, among others.
Code Below prepares data for further analysis and provides an Accuracy. IMO, you would insert a new passenger and predict survival. Datasets could be used on various factors like prediction if a player will hit a Home Run, or a Stock will go up or down.
Decision Trees, prediction by a piecewise constant approximation.
Logistic Regression, the probabilities describing the possible outcomes.
from sklearn.model_selection import train_test_split
from sklearn.tree import DecisionTreeClassifier
from sklearn.linear_model import LogisticRegression
from sklearn.metrics import accuracy_score

# Split arrays or matrices into random train and test subsets.
X = td.drop('survived', axis=1)
y = td['survived']
X_train, X_test, y_train, y_test = train_test_split(X, y, test_size=0.3, random_state=42)

# Train a decision tree classifier
dt = DecisionTreeClassifier()
dt.fit(X_train, y_train)

# Test the model
y_pred = dt.predict(X_test)
accuracy = accuracy_score(y_test, y_pred)
print('DecisionTreeClassifier Accuracy:', accuracy)

# Train a logistic regression model
logreg = LogisticRegression()
logreg.fit(X_train, y_train)

# Test the model
y_pred = logreg.predict(X_test)
accuracy = accuracy_score(y_test, y_pred)
print('LogisticRegression Accuracy:', accuracy)
DecisionTreeClassifier Accuracy: 0.7705882352941177
LogisticRegression Accuracy: 0.788235294117647
/Users/johnmortensen/opt/anaconda3/lib/python3.9/site-packages/sklearn/linear_model/_logistic.py:814: ConvergenceWarning: lbfgs failed to converge (status=1):
STOP: TOTAL NO. of ITERATIONS REACHED LIMIT.

Increase the number of iterations (max_iter) or scale the data as shown in:
    https://scikit-learn.org/stable/modules/preprocessing.html
Please also refer to the documentation for alternative solver options:
    https://scikit-learn.org/stable/modules/linear_model.html#logistic-regression
  n_iter_i = _check_optimize_result(