Since Plotly graphs can be embedded in HTML or exported as a static image, you can embed Plotly graphs in reports suited for print and for the web. This notebook is a primer on creating PDF reports with Python from HTML with Plotly graphs. This notebook uses:
- Plotly for interactive, web native graphs
- IPython Notebook to create this notebook, combining text, HTML, and Python code
- xhtml2pdf to convert HTML to PDF in Python
Run ! pip install xhtml2pdf in the Terminal to install the xhtml2pdf package.
Create the HTML Template
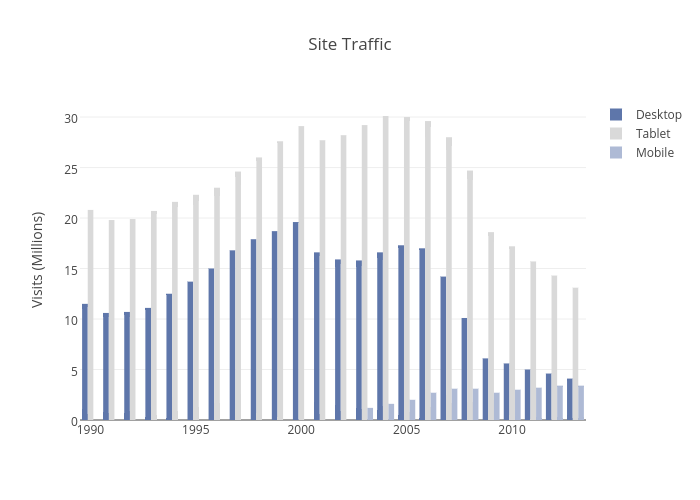
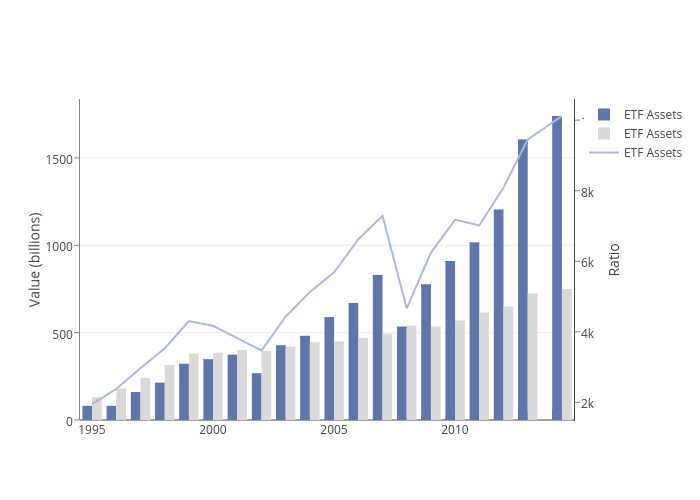
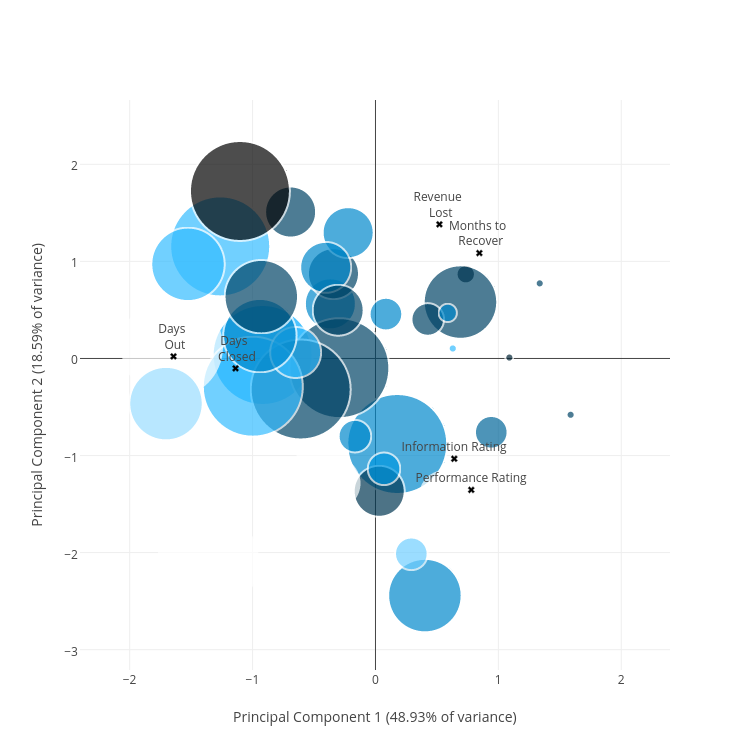
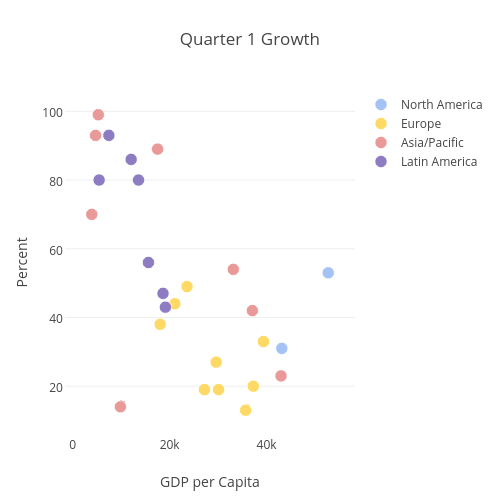
First choose the plots that you'd like to add to the report.
graphs = ['https://plotly.com/~christopherp/308',
          'https://plotly.com/~christopherp/306',
          'https://plotly.com/~christopherp/300',
          'https://plotly.com/~christopherp/296']
from IPython.display import display, HTML

def report_block_template(report_type, graph_url, caption=''):
    if report_type == 'interactive':
        graph_block = '<iframe style="border: none;" src="{graph_url}.embed" width="100%" height="600px"></iframe>'
    elif report_type == 'static':
        graph_block = (''
            '<a href="{graph_url}" target="_blank">' # Open the interactive graph when you click on the image
                '<img style="height: 400px;" src="{graph_url}.png">'
            '</a>')

    report_block = ('' +
        graph_block +
        '{caption}' + # Optional caption to include below the graph
        '<br>'      + # Line break
        '<a href="{graph_url}" style="color: rgb(190,190,190); text-decoration: none; font-weight: 200;" target="_blank">'+
            'Click to comment and see the interactive graph' + # Direct readers to Plotly for commenting, interactive graph
        '</a>' +
        '<br>' +
        '<hr>') # horizontal line

    return report_block.format(graph_url=graph_url, caption=caption)


interactive_report = ''
static_report = ''

for graph_url in graphs:
    _static_block = report_block_template('static', graph_url, caption='')
    _interactive_block = report_block_template('interactive', graph_url, caption='')

    static_report += _static_block
    interactive_report += _interactive_block
Display the Interactive Report
This version, suited for the web, contains the interactive version of the Plotly graphs, served from Plotly's server.
display(HTML(interactive_report))
Display the Static Report
This version is easy to convert to PDF. It contains the static version of the Plotly graphs, also served from Plotly's server.
display(HTML(static_report))
import xhtml2pdf
from xhtml2pdf import pisa
---------------------------------------------------------------------------
ImportError                               Traceback (most recent call last)
<ipython-input-17-498cdf4ac6ef> in <module>()
      1 import xhtml2pdf
----> 2 from xhtml2pdf import pisa

/Users/chelsea/venv/venv2.7/lib/python2.7/site-packages/xhtml2pdf/pisa.py in <module>()
      1 # -*- coding: utf-8 -*-
      2 from xhtml2pdf.default import DEFAULT_CSS
----> 3 from xhtml2pdf.document import pisaDocument
      4 from xhtml2pdf.util import getFile
      5 from xhtml2pdf.version import VERSION, VERSION_STR

/Users/chelsea/venv/venv2.7/lib/python2.7/site-packages/xhtml2pdf/document.py in <module>()
      1 # -*- coding: utf-8 -*-
----> 2 from xhtml2pdf.context import pisaContext
      3 from xhtml2pdf.default import DEFAULT_CSS
      4 from xhtml2pdf.parser import pisaParser
      5 from reportlab.platypus.flowables import Spacer

/Users/chelsea/venv/venv2.7/lib/python2.7/site-packages/xhtml2pdf/context.py in <module>()
     21 import urlparse
     22 import xhtml2pdf.default
---> 23 import xhtml2pdf.parser
     24
     25 # Copyright 2010 Dirk Holtwick, holtwick.it

/Users/chelsea/venv/venv2.7/lib/python2.7/site-packages/xhtml2pdf/parser.py in <module>()
     15 # limitations under the License.
     16
---> 17 from html5lib import treebuilders, inputstream
     18 from xhtml2pdf.default import TAGS, STRING, INT, BOOL, SIZE, COLOR, FILE
     19 from xhtml2pdf.default import BOX, POS, MUST, FONT

ImportError: cannot import name inputstream
Part 2 - Convert the HTML to PDF with xhtml2pdf
from xhtml2pdf import pisa

# Utility function
def convert_html_to_pdf(source_html, output_filename):
    # open output file for writing (truncated binary)
    result_file = open(output_filename, "w+b")

    # convert HTML to PDF
    pisa_status = pisa.CreatePDF(
            source_html,                # the HTML to convert
            dest=result_file)           # file handle to recieve result

    # close output file
    result_file.close()                 # close output file

    # return True on success and False on errors
    return pisa_status.err

convert_html_to_pdf(static_report, 'report.pdf')

! open report.pdf
---------------------------------------------------------------------------
ImportError                               Traceback (most recent call last)
<ipython-input-6-21ee2fb369fc> in <module>()
----> 1 from xhtml2pdf import pisa             # import python module
      2
      3 # Utility function
      4 def convert_html_to_pdf(source_html, output_filename):
      5     # open output file for writing (truncated binary)

/Library/Frameworks/Python.framework/Versions/2.7/lib/python2.7/site-packages/xhtml2pdf/pisa.py in <module>()
      1 # -*- coding: utf-8 -*-
      2 from xhtml2pdf.default import DEFAULT_CSS
----> 3 from xhtml2pdf.document import pisaDocument
      4 from xhtml2pdf.util import getFile
      5 from xhtml2pdf.version import VERSION, VERSION_STR

/Library/Frameworks/Python.framework/Versions/2.7/lib/python2.7/site-packages/xhtml2pdf/document.py in <module>()
      1 # -*- coding: utf-8 -*-
----> 2 from xhtml2pdf.context import pisaContext
      3 from xhtml2pdf.default import DEFAULT_CSS
      4 from xhtml2pdf.parser import pisaParser
      5 from reportlab.platypus.flowables import Spacer

/Library/Frameworks/Python.framework/Versions/2.7/lib/python2.7/site-packages/xhtml2pdf/context.py in <module>()
     21 import urlparse
     22 import xhtml2pdf.default
---> 23 import xhtml2pdf.parser
     24
     25 # Copyright 2010 Dirk Holtwick, holtwick.it

/Library/Frameworks/Python.framework/Versions/2.7/lib/python2.7/site-packages/xhtml2pdf/parser.py in <module>()
     15 # limitations under the License.
     16
---> 17 from html5lib import treebuilders, inputstream
     18 from xhtml2pdf.default import TAGS, STRING, INT, BOOL, SIZE, COLOR, FILE
     19 from xhtml2pdf.default import BOX, POS, MUST, FONT

ImportError: cannot import name inputstream
Generating Images on the fly
The static report in the example above uses graphs that were already created in Plotly. Sometimes it's helpful to use graph images that are created on-the-fly. For example, if you're using plotly.js to create the web-reports you might not be saving the graphs to accounts on plot.ly.
To create static images of graphs on-the-fly, use the plotly.plotly.image class. This class generates images by making a request to the Plotly image server.
Here's an alternative template that uses py.image.get to generate the images and template them into an HTML and PDF report.
import plotly.plotly as py
import base64

width = 600
height = 600

template = (''
    '<img style="width: {width}; height: {height}" src="data:image/png;base64,{image}">'
    '{caption}'                              # Optional caption to include below the graph
    '<br>'
    '<hr>'
'')

# A collection of Plotly graphs
figures = [
    {'data': [{'x': [1,2,3], 'y': [3,1,6]}], 'layout': {'title': 'the first graph'}},
    {'data': [{'x': [1,2,3], 'y': [3,7,6], 'type': 'bar'}], 'layout': {'title': 'the second graph'}}
]

# Generate their images using `py.image.get`
images = [base64.b64encode(py.image.get(figure, width=width, height=height)).decode('utf-8') for figure in figures]

report_html = ''
for image in images:
    _ = template
    _ = _.format(image=image, caption='', width=width, height=height)
    report_html += _

display(HTML(report_html))
convert_html_to_pdf(report_html, 'report-2.pdf')


0
! pip install publisher --upgrade

from IPython.display import HTML, display

display(HTML('<link href="//fonts.googleapis.com/css?family=Open+Sans:600,400,300,200|Inconsolata|Ubuntu+Mono:400,700" rel="stylesheet" type="text/css" />'))
display(HTML('<link rel="stylesheet" type="text/css" href="https://help.plot.ly/documentation/all_static/css/ipython-notebook-custom.css">'))

! pip install git+https://github.com/plotly/publisher.git --upgrade
import publisher
publisher.publish('pdf-reports.ipynb', 'python/pdf-reports/', 'PDF Reports'
                  'How to make PDF reports with Python and Plotly Graphs.',
                  title = 'Python PDF Reports | plotly',
                  name = 'PDF Reports',
                  has_thumbnail='true', thumbnail='thumbnail/ipython_10_pdf_report.jpg',
                  language='python', page_type='example_index',
                  display_as='report_generation', order=1)
Requirement already up-to-date: publisher in /Library/Frameworks/Python.framework/Versions/2.7/lib/python2.7/site-packages