Basic Agent Sudy
It is recommended to have a look at the 0_basic_functionalities, 1_Observation_Agents, 2_Action_GridManipulation and 3_TrainingAnAgent notebooks before getting into this one.
Objectives
In this notebook we will expose how to study an Agent. For this notebook to be interested, we first use a dummy agent, and then we look at how to study its behaviour from the file saved.
This notebook will also show you how to use the Graphical User Interface built for analyzing grid2Op agents called "Grid2Viz".
It is more than recommended to know how to define an Agent and use a Runner before doing this tutotial!
Evaluate the performance of a simple Agent
import os
import sys
import grid2op
import copy
import numpy as np
import shutil
import plotly.graph_objects as go

from tqdm.notebook import tqdm
from grid2op.Agent import PowerLineSwitch
from grid2op.Reward import L2RPNReward
from grid2op.Runner import Runner
from grid2op.Chronics import GridStateFromFileWithForecasts, Multifolder
path_agents = "study_agent_getting_started"
max_iter = 30
In the next cell we evaluate the agent "PowerLineSwitch" and save the results of this evaluation in "study_agent_getting_started"
scoring_function = L2RPNReward
env = grid2op.make(reward_class=L2RPNReward, test=True)
# env.chronics_handler.set_max_iter(max_iter)
shutil.rmtree(os.path.abspath(path_agents), ignore_errors=True)
if not os.path.exists(path_agents):
    os.mkdir(path_agents)

# make a runner for this agent
path_agent = os.path.join(path_agents, "PowerLineSwitch")
shutil.rmtree(os.path.abspath(path_agent), ignore_errors=True)

runner = Runner(**env.get_params_for_runner(),
                agentClass=PowerLineSwitch
                )
res = runner.run(path_save=path_agent, nb_episode=2,
                max_iter=max_iter,
                pbar=tqdm)
print("The results for the evaluated agent are:")
for _, chron_id, cum_reward, nb_time_step, max_ts in res:
    msg_tmp = "\tFor chronics with id {}\n".format(chron_id)
    msg_tmp += "\t\t - cumulative reward: {:.6f}\n".format(cum_reward)
    msg_tmp += "\t\t - number of time steps completed: {:.0f} / {:.0f}".format(nb_time_step, max_ts)
    print(msg_tmp)
/home/benjamin/Documents/grid2op_dev/getting_started/grid2op/MakeEnv/Make.py:224: UserWarning:

You are using a development environment. This environment is not intended for training agents.
HBox(children=(FloatProgress(value=0.0, description='episode', max=2.0, style=ProgressStyle(description_width=…
HBox(children=(FloatProgress(value=0.0, description='episode', max=30.0, style=ProgressStyle(description_width…
HBox(children=(FloatProgress(value=0.0, description='episode', max=30.0, style=ProgressStyle(description_width…
The results for the evaluated agent are:
	For chronics with id 000
		 - cumulative reward: 496.772949
		 - number of time steps completed: 30 / 30
	For chronics with id 001
		 - cumulative reward: 515.620117
		 - number of time steps completed: 30 / 30
Looking at the results, understand the behaviour of the Agent
The content of the folder is the following:
os.listdir(path_agent)
['000',
 'dict_env_modification_space.json',
 '001',
 'dict_action_space.json',
 'dict_observation_space.json']
!ls $path_agent
000  dict_action_space.json	       dict_observation_space.json
001  dict_env_modification_space.json
Now we can load the data corresponding to episode 1 for example, we can load the actions and the observations and de-serialize them properly into proper objects. This is now automatically done with the class "EpisodeData" that can be used as follow:
from grid2op.Episode import EpisodeData
episode_studied = "001"
this_episode = EpisodeData.from_disk(path_agent, episode_studied)
Inspect the actions
And now we can start to study the given agent, for example, let's inspect its actions and wonder how many powerlines it has disconnected (for example, this is probably not the best thing to do here...)
line_disc = 0
line_reco = 0
for act in this_episode.actions:
    dict_ = act.as_dict() # representation of an action as a dictionnary, see the documentation for more information
    if "change_line_status" in dict_:
        if "set_bus_vect" in dict_:
            line_reco += 1
        else:
            line_disc += 1
line_disc
3
We can also wonder how many times this Agent acted on the powerline with id $14$, and inspect how many times it has change its status:
id_line_inspected = 13
line_disconnected = 0
for act in this_episode.actions:
    dict_ = act.effect_on(line_id=id_line_inspected) # which effect has this action action on the substation with given id
    # other objects are: load_id, gen_id, line_id or substation_id
    if dict_['change_line_status'] or dict_["set_line_status"] != 0:
        line_disconnected += 1
line_disconnected
1
Inspect the modification of the environment
For example, we might want to inspect the number of hazards and maintenance of a total scenario, to see how difficult it was.
nb_hazards = 0
nb_maintenance = 0
for act in this_episode.env_actions:
    dict_ = act.as_dict() # representation of an action as a dictionnary, see the documentation for more information
    if "nb_hazards" in dict_:
        nb_hazards += 1
    if "nb_maintenance" in dict_:
        nb_maintenance += 1
nb_maintenance
0
Inspect the observations
For example, let's look at the value consumed by load 1. For this cell to work, it requires plotly for displaying the results.
import plotly.graph_objects as go
load_id = 1
# extract the data
val_load1 = np.zeros(len(this_episode.observations))
for i, obs in enumerate(this_episode.observations):
    dict_ = obs.state_of(load_id=load_id) # which effect has this action action on the substation with id 1
    # other objects are: load_id, gen_id, line_id or substation_id
    # see the documentation for more information.
    val_load1[i] = dict_['p']

# plot it
fig = go.Figure(data=[go.Scatter(x=[i for i in range(len(val_load1))],
                                 y=val_load1)])
fig.update_layout(title="Consumption of load {}".format(load_id),
                 xaxis_title="Time step",
                 yaxis_title="Load (MW)")
fig.show()
Or the values of generator 3 (it's supposed to represent a solar energy source)
gen_id = 4
# extract the data
val_lgen3 = np.zeros(len(this_episode.observations))
for i, obs in enumerate(this_episode.observations):
    dict_ = obs.state_of(gen_id=gen_id) # which effect has this action action on the substation with id 1
    # other objects are: load_id, gen_id, line_id or substation_id
    # see the documentation for more information.
    val_lgen3[i] = dict_['p']

# plot it
fig = go.Figure(data=[go.Scatter(x=[i for i in range(len(val_lgen3))],
                                 y=val_lgen3)])
fig.update_layout(title="Production of generator {}".format(gen_id),
                 xaxis_title="Time step",
                 yaxis_title="Production (MW)")
fig.show()
In the same fashion, we might want to get the flows on powerline connecting bus 3 to bus 4 (without knowing its id by using the appropriate method of the observation_space):
from_ = 3
to_ = 4
found_ids = this_episode.observations.helper.get_lines_id(from_=from_, to_=to_)
line_id = found_ids[0]

# extract the data
val_l3_4 = np.zeros(len(this_episode.observations))
for i, obs in enumerate(this_episode.observations):
    dict_ = obs.state_of(line_id=line_id) # which effect has this action action on the substation with id 1
    # other objects are: load_id, gen_id, line_id or substation_id
    # see the documentation for more information.
    val_l3_4[i] = dict_["origin"]['a']

# plot it
fig = go.Figure(data=[go.Scatter(x=[i for i in range(len(val_l3_4))],
                                 y=val_l3_4)])
fig.update_layout(title="Flow on powerline {} (going from {} to {})".format(line_id, from_, to_),
                 xaxis_title="Time step",
                 yaxis_title="Production (MW)")
fig.show()
Quick display of a grid using an observation
Bellow you can find an example on how to plot a observation and the underlying powergrid. This is an example, the results doesn't look really great. It uses plotly and requires the layout of the grid (eg the coordinates of the substations) to be specified.
Note also that this code is not optimized at all.
from grid2op.PlotGrid import PlotPlotly
obs = copy.deepcopy(this_episode.observations[-1])
# and change the topology (just to have something to represent)
obs.topo_vect[3:9] = [2,2,1,1,2,1]

plot_helper = PlotPlotly(observation_space=this_episode.observation_space, width=900, height=600)
plot_helper._line_bus_radius = 12
fig = plot_helper.plot_obs(obs)
fig.show()
In this plot, we can see that the "action" (that is implemented here only to demonstrate the plotting utility) has the following effect.
After its application, a power plants, and powerline are connected together on bus 2. This is represented by the magenta dot. The rest of the topology is still connected to bus 1 (in red) or diconnected (in black)
Synching Observation and Action
As stated in the documentation, at row i, it's the observation at time "i" and the action at time "i". So at row i of the numpy matrices, we see what the agent saw when he took his actions. We have "an agent view".
In case we want to see the impact of an Action, it is then necessary to:
- look at action i
- look at observation i+1
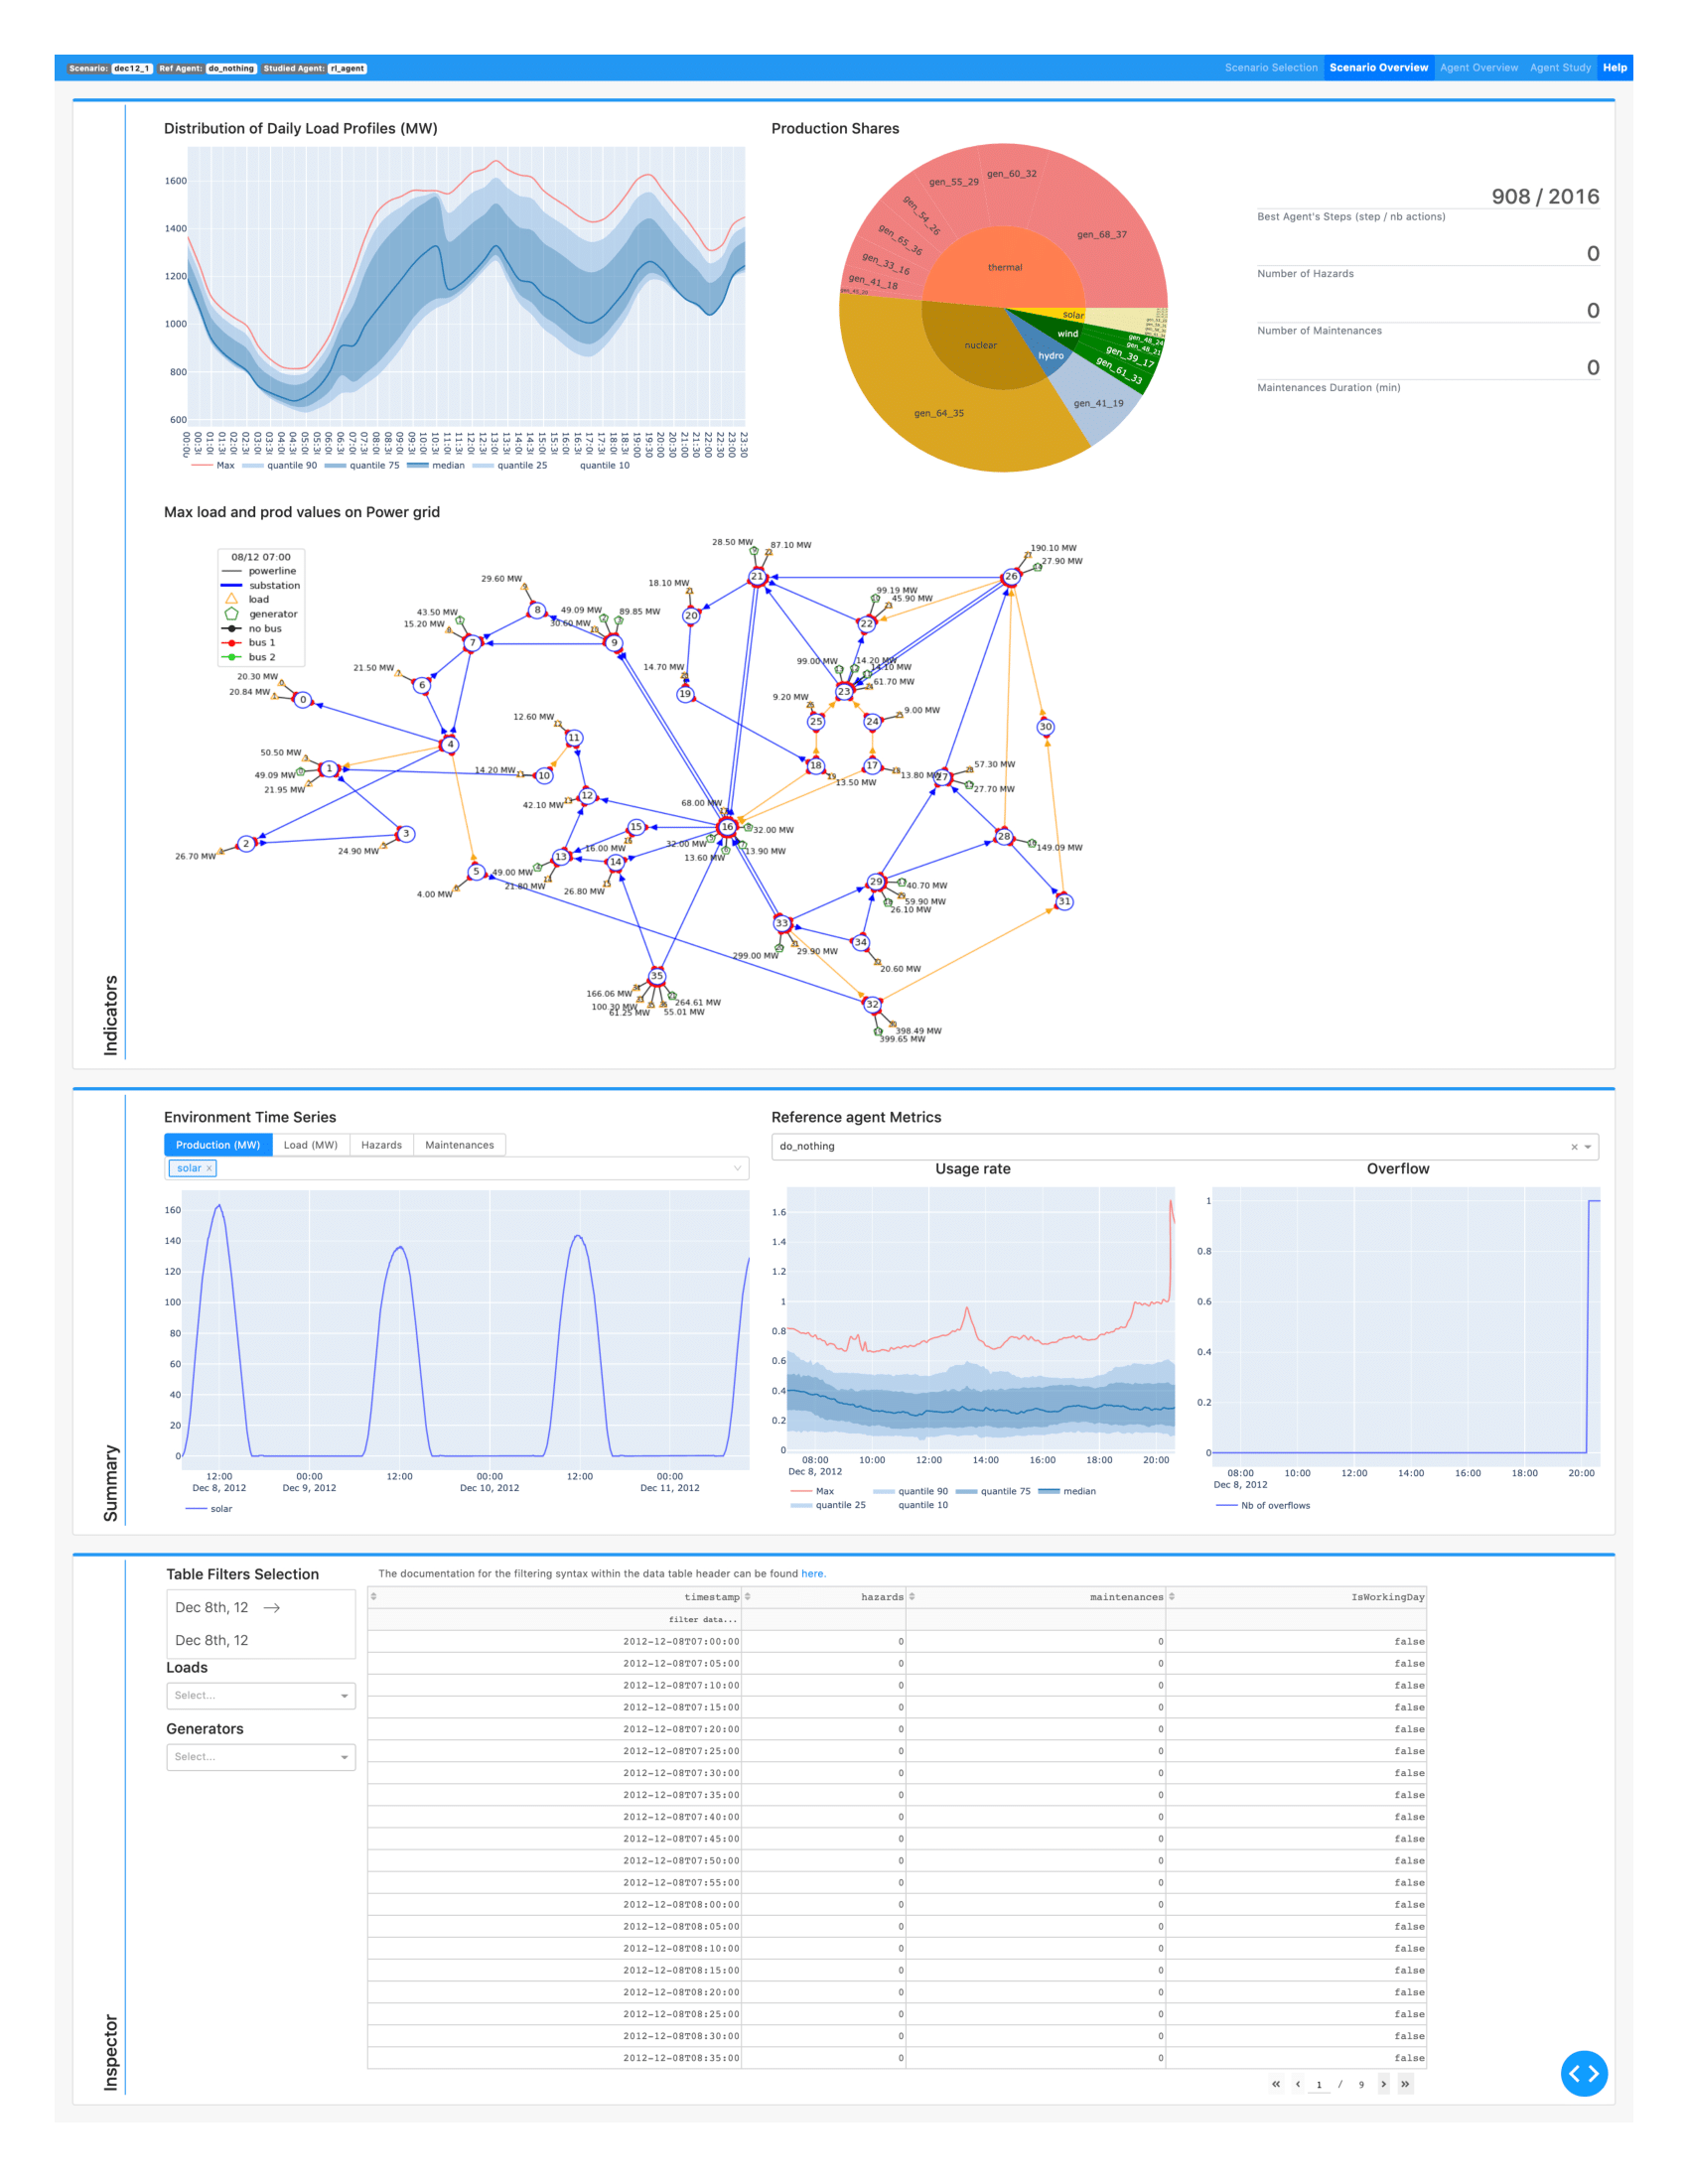
Using the dedicated grid2viz framework
Grid2viz is a package that has been developped to help you visualize the behaviour of your agent.
It is available for now in a github repository grid2viz. In the few following cells we will demonstrate how to use it to inspect in more detail the log of the agents generated by the runner (second cell of this notebook).
We will first run some other agents to show the full potential of grid2viz (optional). Then we emphasize a constraint on the use of grid2viz: the folder tree must respect a certain order. Then we show how to install it and finally how to launch it on the data generated by this notebook.
More agents to compare
This section is not mandatory, but it is better to show the full capabilities of grid2viz. We will first run 2 others agents: the do nothing agent, and the topology greedy agents.
# make a runner for this agent
from grid2op.Agent import DoNothingAgent, TopologyGreedy

for agentClass, agentName in zip([DoNothingAgent],  # , TopologyGreedy
                                 ["DoNothingAgent"]):  # , "TopologyGreedy"
    path_agent = os.path.join(path_agents, agentName)
    shutil.rmtree(os.path.abspath(path_agent), ignore_errors=True)
    runner = Runner(**env.get_params_for_runner(),
                    agentClass=agentClass
                    )
    res = runner.run(path_save=path_agent, nb_episode=2,
                    max_iter=max_iter)
    print("The results for the {} agent are:".format(agentName))
    for _, chron_id, cum_reward, nb_time_step, max_ts in res:
        msg_tmp = "\tFor chronics with id {}\n".format(chron_id)
        msg_tmp += "\t\t - cumulative reward: {:.6f}\n".format(cum_reward)
        msg_tmp += "\t\t - number of time steps completed: {:.0f} / {:.0f}".format(nb_time_step, max_ts)
        print(msg_tmp)
The results for the DoNothingAgent agent are:
	For chronics with id 000
		 - cumulative reward: 482.929718
		 - number of time steps completed: 30 / 30
	For chronics with id 001
		 - cumulative reward: 501.151642
		 - number of time steps completed: 30 / 30
Caution
Grid2Viz for now require a specific organization of the folders. You must:
- use the runner to save the results of your experiment, using the "path_save" argument
- the agent must be "alone" in this directory: you should save it to an empty directory
- the path where the agent is stored must contain only folder of agents.
These contraints give the following "architecture":
- regular directory
- runner log
- agent log 1
- scenario log 1
- scenario log 2 ...
- scenario log n
- agent log 2
- scenario log 1 ...
- scenario log p
- agent log 3
- scenario log 1 ...
- agent log 1
- other folders
- runner log
- other folders
An example is given in the "path_agents" directory used in this notebook.
!ls -R $path_agents
study_agent_getting_started:
DoNothingAgent	PowerLineSwitch

study_agent_getting_started/DoNothingAgent:
000  dict_action_space.json	       dict_observation_space.json
001  dict_env_modification_space.json

study_agent_getting_started/DoNothingAgent/000:
actions.npz			  episode_meta.json   _parameters.json
agent_exec_times.npz		  episode_times.json  rewards.npz
disc_lines_cascading_failure.npz  observations.npz
env_modifications.npz		  other_rewards.json

study_agent_getting_started/DoNothingAgent/001:
actions.npz			  episode_meta.json   _parameters.json
agent_exec_times.npz		  episode_times.json  rewards.npz
disc_lines_cascading_failure.npz  observations.npz
env_modifications.npz		  other_rewards.json

study_agent_getting_started/PowerLineSwitch:
000  dict_action_space.json	       dict_observation_space.json
001  dict_env_modification_space.json

study_agent_getting_started/PowerLineSwitch/000:
actions.npz			  episode_meta.json   _parameters.json
agent_exec_times.npz		  episode_times.json  rewards.npz
disc_lines_cascading_failure.npz  observations.npz
env_modifications.npz		  other_rewards.json

study_agent_getting_started/PowerLineSwitch/001:
actions.npz			  episode_meta.json   _parameters.json
agent_exec_times.npz		  episode_times.json  rewards.npz
disc_lines_cascading_failure.npz  observations.npz
env_modifications.npz		  other_rewards.json
If the command "tree" is installed on your machine, you can uncomment the following cell to have a better layout.
# !tree $path_agents
Installation
Grid2Viz is not yet on pypi, the python package repository. So you need a specific command to install it. It can be done super easily by running the cell bellow (more information can be found on the grid2iz github).
import sys
print("To install it, either uncomment the cell bellow, or type, in a command prompt:\n{}".format(
    ("\t{} -m pip install git+https://github.com/mjothy/grid2viz.git --user --extra-index-url https://test.pypi.org/simple/".format(sys.executable))))
To install it, either uncomment the cell bellow, or type, in a command prompt:
	/usr/bin/python3 -m pip install git+https://github.com/mjothy/grid2viz.git --user --extra-index-url https://test.pypi.org/simple/
# !$sys.executable -m pip install git+https://github.com/mjothy/grid2viz --user --extra-index-url https://test.pypi.org/simple/
Usage
Once the above package is installed, you can now start to study what your agent did (NB the agent must have been run with a runner and the "path_save" argument in order for grid2viz to work properly.
print("You can start this server either by running the next cell, or by typing in a cmd:\n"\
      "\t\t{} -m grid2viz.main --path {}".format(sys.executable, os.path.abspath(path_agents)))
You can start this server either by running the next cell, or by typing in a cmd:
		/usr/bin/python3 -m grid2viz.main --path /home/benjamin/Documents/grid2op_dev/getting_started/study_agent_getting_started
For performance optimization, grid2viz uses a cache. This notebook being an example, it is recommended to clear the cache before starting the grid2viz app. Of course, if you study different generation of your agent, it is NOT recommended to clear the cache before any study.
shutil.rmtree(os.path.join(os.path.abspath(path_agents), "_cache"), ignore_errors=True)
!$sys.executable -m grid2viz.main --path=$path_agents