Connect to a remote database, select specific data using Django queries
Executing this Notebook requires a personal STOQS server. Follow the steps to build your own development system — this will take a few hours and depends on a good connection to the Internet. Once your server is up log into it (after a cd ~/Vagrants/stoqsvm) and activate your virtual environment with the usual commands:
vagrant ssh -- -X
cd /vagrant/dev/stoqsgit
source venv-stoqs/bin/activate
Connect to your Institution's STOQS database server using read-only credentials. (Note: firewalls typically limit unprivileged access to such resources.)
cd stoqs
ln -s mbari_campaigns.py campaigns.py
export DATABASE_URL=postgis://everyone:guest@kraken.shore.mbari.org:5433/stoqs
Launch Jupyter Notebook on your system with:
cd contrib/notebooks
../../manage.py shell_plus --notebook
navigate to this file and open it. You will then be able to execute the cells and experiment with this notebook.
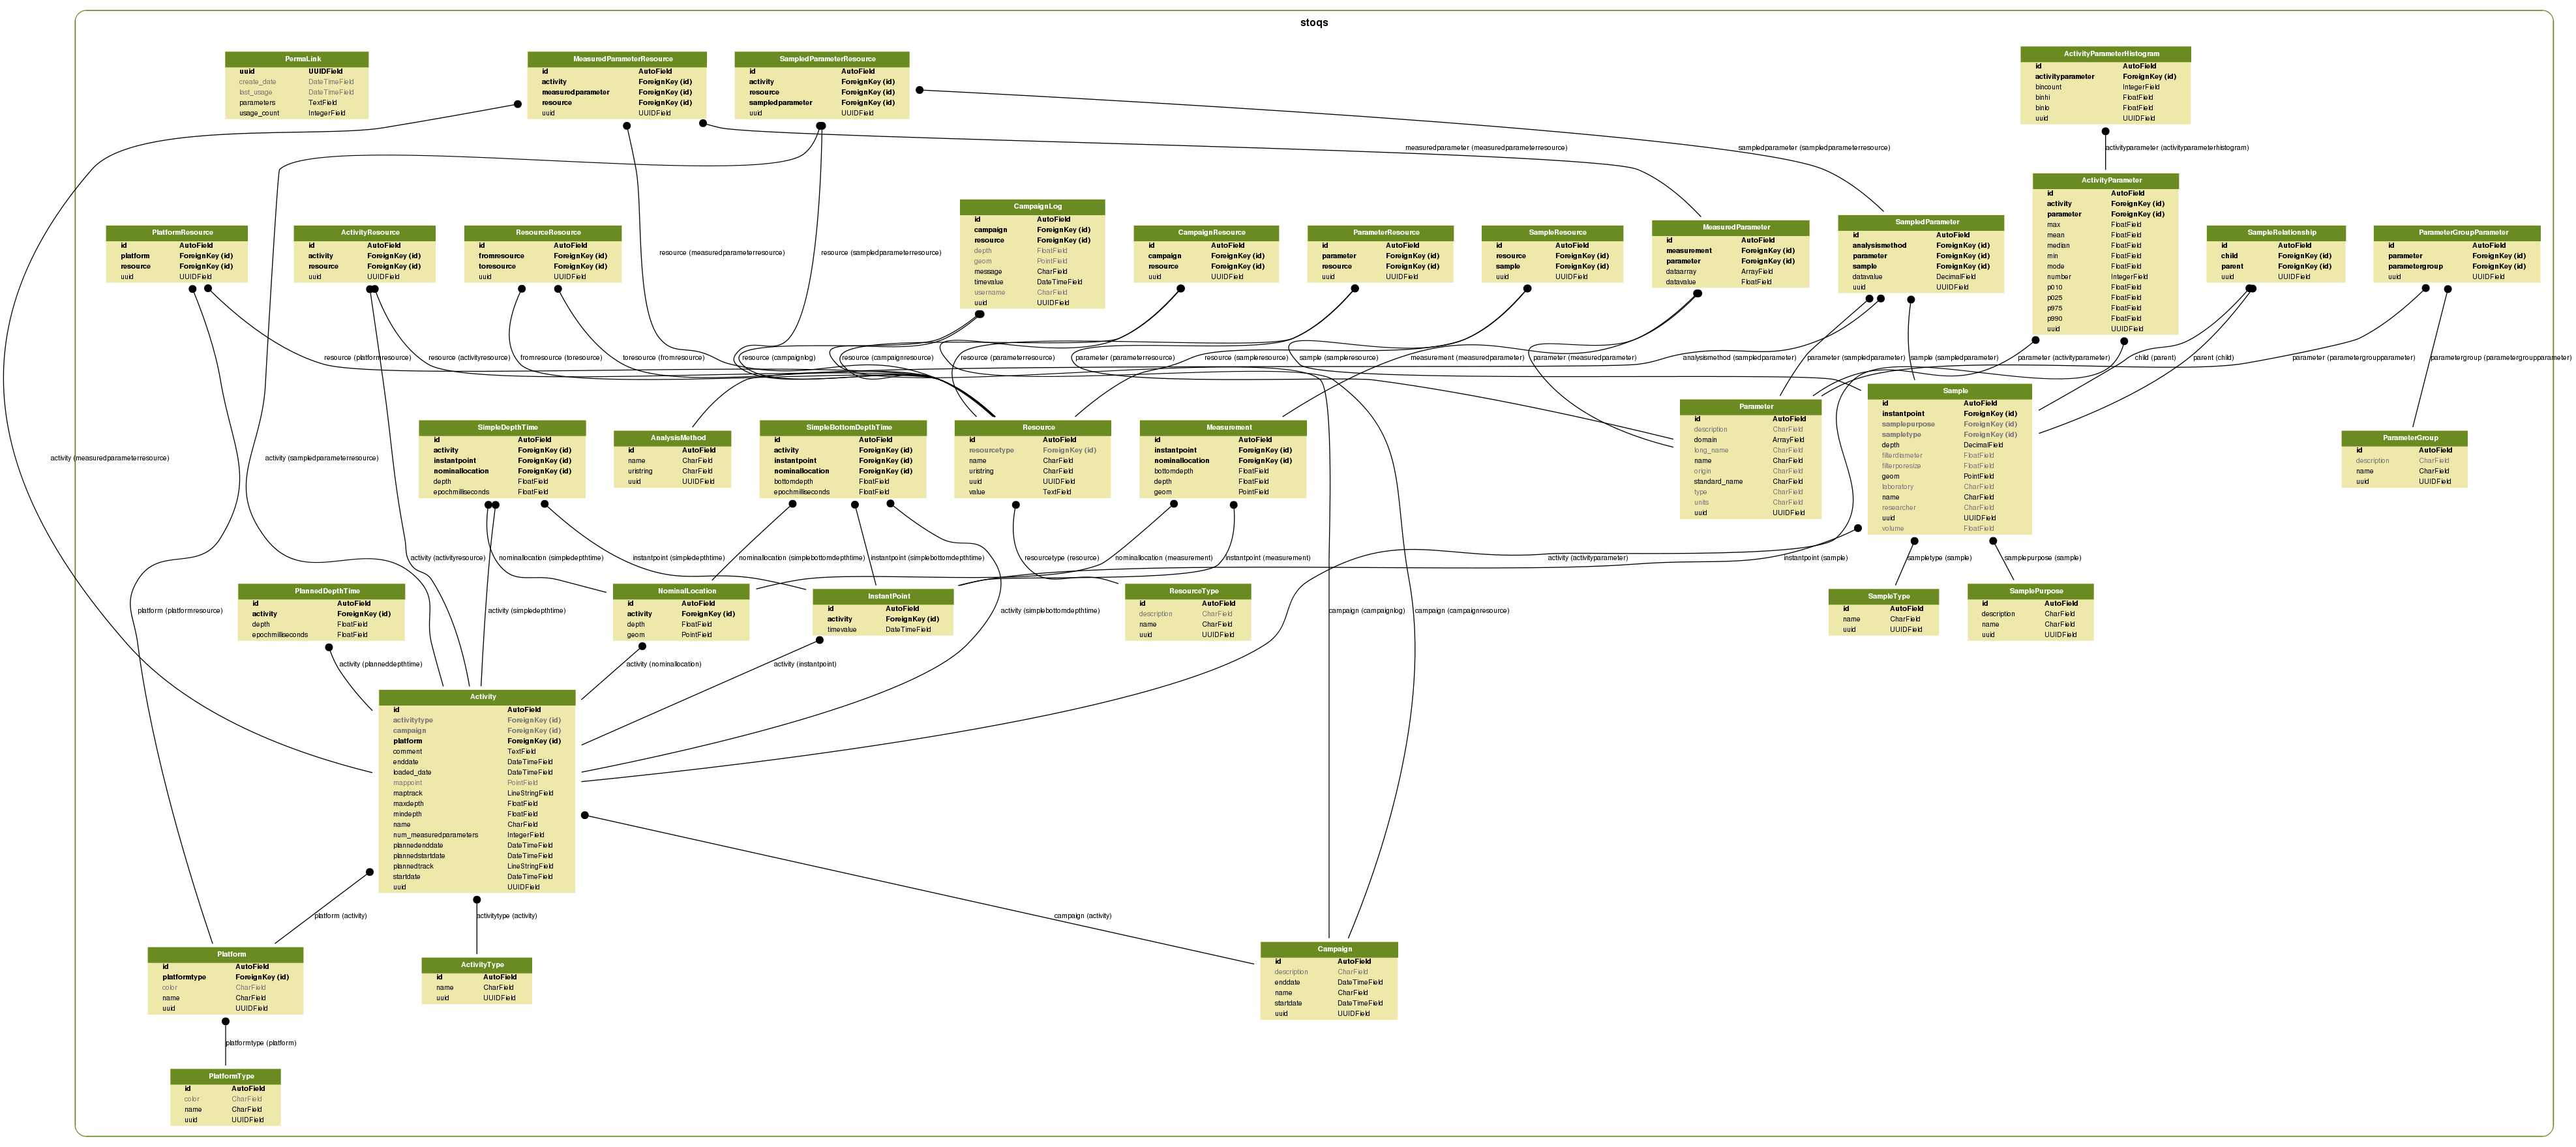
For reference please see the STOQS schema diagram.
Get list of Activities that are BED event trajectories:
acts = (Activity.objects.using('stoqs_cce2015')
        .filter(name__contains='trajectory')
        .order_by('name'))
For each BED event (activity) print start and end times and locations:
fmt = '\t{}: {}, {:.6f}, {:.6f}, {:.2f}'
for activity in acts:
    measuredparameters = (MeasuredParameter.objects.using('stoqs_cce2015')
                           .filter(measurement__instantpoint__activity=activity)
                           .order_by('measurement__instantpoint__timevalue'))
    start = measuredparameters.earliest('measurement__instantpoint__timevalue')
    end = measuredparameters.latest('measurement__instantpoint__timevalue')

    print('{}'.format(activity))
    print(fmt.format('Start',
                     start.measurement.instantpoint,
                     start.measurement.geom.x,
                     start.measurement.geom.y,
                     start.measurement.depth))
    print(fmt.format('End  ',
                     end.measurement.instantpoint,
                     end.measurement.geom.x,
                     end.measurement.geom.y,
                     end.measurement.depth))
30200078_trajectory.nc (stride=1)
	Start: 2016-01-15 21:35:52, -121.822032, 36.796560, 201.15
	End  : 2016-01-15 21:37:38.459898, -121.822032, 36.796560, 120.12
30300004_trajectory.nc (stride=1)
	Start: 2016-02-17 21:53:58, -121.848407, 36.793873, 293.60
	End  : 2016-02-17 21:56:20.400034, -121.851421, 36.795098, 303.07
30300016_trajectory.nc (stride=1)
	Start: 2016-03-06 09:23:36, -121.851242, 36.795019, 304.66
	End  : 2016-03-06 09:28:04.000064, -121.856867, 36.800122, 327.87
40100037_trajectory.nc (stride=1)
	Start: 2015-12-01 15:37:45.500000, -121.847281, 36.793254, 291.40
	End  : 2015-12-01 15:42:04.899753, -121.854368, 36.796832, 295.52
50200024_decimated_trajectory.nc (stride=1)
	Start: 2015-12-01 15:50:14, -121.870132, 36.794753, 386.79
	End  : 2015-12-01 15:55:14.000072, -121.877751, 36.792767, 404.18
50200054_trajectory.nc (stride=1)
	Start: 2016-01-15 21:53:11, -121.878356, 36.792502, 406.80
	End  : 2016-01-15 21:55:34.400034, -121.880776, 36.792806, 414.09
50200055_trajectory.nc (stride=1)
	Start: 2016-01-15 21:55:37, -121.880802, 36.792830, 414.79
	End  : 2016-01-15 21:59:53.800061, -121.883745, 36.796028, 424.66
50200056_trajectory.nc (stride=1)
	Start: 2016-01-15 22:00:00, -121.883129, 36.795570, 424.68
	End  : 2016-01-15 22:01:10.400017, -121.884910, 36.796855, 428.44
50200057_trajectory.nc (stride=1)
	Start: 2016-01-15 22:01:49, -121.885470, 36.797185, 426.72
	End  : 2016-01-15 22:02:36.000011, -121.887633, 36.797514, 429.29
60100068_trajectory.nc (stride=1)
	Start: 2016-01-15 22:06:15, -121.904350, 36.791129, 521.07
	End  : 2016-01-15 22:07:11.339946, -121.904350, 36.791129, 491.45
Validate the query by a spot check of one of the NetCDF files for the start and end data. Let's choose the penultimate one: 50200057_trajectory.nc (stride=1). The OPeNDAP URL for the NetCDF file is http://elvis64.shore.mbari.org/opendap/data/CCE_Processed/BEDs/BED05/MBCCE_BED05_20151027_Event20160115/netcdf/50200057_trajectory.nc.html. From this form we can select the coordinate variables and choose the first and last indices to construct .ascii requests:
First:
http://elvis64.shore.mbari.org:8080/opendap/data/CCE_Processed/BEDs/BED05/MBCCE_BED05_20151027_Event20160115/netcdf/50200057_trajectory.nc.ascii?time[0:1:0],latitude[0:1:0],longitude[0:1:0],depth[0:1:0]

Dataset: 50200057_trajectory.nc
time, 95896909
latitude.time, 95896909
latitude.latitude, 36.797185
longitude.time, 95896909
longitude.longitude, -121.88547
depth.time, 95896909
depth.depth, 426.721524445596
Last:
http://elvis64.shore.mbari.org:8080/opendap/data/CCE_Processed/BEDs/BED05/MBCCE_BED05_20151027_Event20160115/netcdf/50200057_trajectory.nc.ascii?time[235:1:235],latitude[235:1:235],longitude[235:1:235],depth[235:1:235]

Dataset: 50200057_trajectory.nc
time, 95896956.0000112
latitude.time, 95896956.0000112
latitude.latitude, 36.797514
longitude.time, 95896956.0000112
longitude.longitude, -121.887633
depth.time, 95896956.0000112
depth.depth, 429.287069222699
The time values can be converted from 'seconds since 2013-01-01 00:00:00' to a string that we can compare to report from STOQS:
from coards import from_udunits
print(str(from_udunits(95896909, 'seconds since 2013-01-01 00:00:00')))
print(str(from_udunits(95896956.0000112, 'seconds since 2013-01-01 00:00:00')))
2016-01-15 22:01:49
2016-01-15 22:02:36.000011
Compare side-by-side (er, top-and-bottom) the data from STOQS and NetCDF:
50200057_trajectory.nc (stride=1)
    STOQS  Start: 2016-01-15 22:01:49,        -121.885470, 36.797185, 426.72
    NetCDF start: 2016-01-15 22:01:49,        -121.88547,  36.797185, 426.721524445596

    STOQS  End  : 2016-01-15 22:02:36.000011, -121.887633, 36.797514, 429.29
    NetCDF End  : 2016-01-15 22:02:36.000011, -121.887633, 36.797514, 429.287069222699
Comparison looks good!