🚩 Create a free WhyLabs account to get more value out of whylogs!
Did you know you can store, visualize, and monitor whylogs profiles with the WhyLabs Observability Platform? Sign up for a free WhyLabs account to leverage the power of whylogs and WhyLabs together!
Monitoring Regression Model Performance Metrics
![]()
In this tutorial, we'll show how you can log performance metrics of your ML Model with whylogs, and how to send it to your dashboard at Whylabs Platform. We'll follow a regression use case, where we're predicting the temperature of a given location based on metereological features.
We will:
- Download Weather Data for 7 days
- Log daily input features with whylogs
- Log daily regression performance metrics with whylogs
- Write logged profiles to WhyLabs' dashboard
- Show performance summary at WhyLabs
- Advanced: Monitor segmented performance metrics
Installing whylogs
First, let's install whylogs. Since we want to write to WhyLabs, we'll install the whylabs extra. Additionally, we'll use the datasets module, so let's install it as well:
# Note: you may need to restart the kernel to use updated packages.
%pip install 'whylogs[datasets]'
🌤️ The Data - Weather Forecast Dataset
In this example, we will use the Weather Forecast Dataset, using whylogs' Datasets module.
This dataset contains several meteorological features at a particular place (defined by latitude and longitude features) and time. The task is to predict the temperature based on the input features.
The original data is described in Shifts: A Dataset of Real Distributional Shift Across Multiple Large-Scale Tasks, by Malinin, Andrey, et al., and was further transformed to compose the current dataset. You can have more information about the resulting dataset and how to use it at https://whylogs.readthedocs.io/en/latest/datasets/weather.html.
Downloading the data into daily batches
Let's download 7 batches with 7 days worth of data, corresponding to the last 7 days. We can use directly the datasets module for that.
from whylogs.datasets import Weather
from datetime import datetime, timezone, timedelta
dataset = Weather()

start_timestamp = datetime.now(timezone.utc) - timedelta(days=6)
dataset.set_parameters(inference_start_timestamp=start_timestamp)

daily_batches = dataset.get_inference_data(number_batches=7)

#batches is an iterator, so let's get the list for this
daily_batches = list(daily_batches)
Since in this example we're mainly concerned with regression metrics, let's select a subset of the available features, for simplicity.
meta_climate, meta_latitude, meta_longitude will be our input features, while prediction_temperature is the predicted feature given by a trained ML model and the temperature feature is our target.
Let's take a look at the data for the first day:
columns = ["meta_climate","meta_latitude","meta_longitude","prediction_temperature","temperature"]
df = daily_batches[0].data[columns]

df.head()
| meta_climate | meta_latitude | meta_longitude | prediction_temperature | temperature | |
|---|---|---|---|---|---|
| date | |||||
| 2022-12-12 00:00:00+00:00 | mild temperate | 38.891300 | -6.821330 | 9.163181 | 10.0 |
| 2022-12-12 00:00:00+00:00 | tropical | 12.216667 | 109.216667 | 26.220221 | 27.0 |
| 2022-12-12 00:00:00+00:00 | dry | 37.991699 | -101.746002 | 13.178478 | 15.0 |
| 2022-12-12 00:00:00+00:00 | mild temperate | -23.333599 | -51.130100 | 23.255124 | 25.0 |
| 2022-12-12 00:00:00+00:00 | mild temperate | -23.479445 | -52.012222 | 27.851674 | 32.0 |
✔️ Setting the Environment Variables
In order to send our profile to WhyLabs, let's first set up an account. You can skip this if you already have an account and a model set up.
We will need three pieces of information:
- API token
- Organization ID
- Dataset ID (or model-id)
Go to https://whylabs.ai/free and grab a free account. You can follow along with the examples if you wish, but if you’re interested in only following this demonstration, you can go ahead and skip the quick start instructions.
After that, you’ll be prompted to create an API token. Once you create it, copy and store it locally. The second important information here is your org ID. Take note of it as well. After you get your API Token and Org ID, you can go to https://hub.whylabsapp.com/models to see your projects dashboard. You can create a new project and take note of it's ID (if it's a model project it will look like model-xxxx).
import getpass
import os

# set your org-id here - should be something like "org-xxxx"
print("Enter your WhyLabs Org ID")
os.environ["WHYLABS_DEFAULT_ORG_ID"] = input()

# set your datased_id (or model_id) here - should be something like "model-xxxx"
print("Enter your WhyLabs Dataset ID")
os.environ["WHYLABS_DEFAULT_DATASET_ID"] = input()


# set your API key here
print("Enter your WhyLabs API key")
os.environ["WHYLABS_API_KEY"] = getpass.getpass()
print("Using API Key ID: ", os.environ["WHYLABS_API_KEY"][0:10])
Enter your WhyLabs Org ID
Enter your WhyLabs Dataset ID
Enter your WhyLabs API key
Using API Key ID:  z8fYdnQwHr
📊 Profiling the Data + Sending to WhyLabs
Traditionally, data is logged by calling why.log(). In this case, we'll use why.log_regression_metrics(). By setting log_full_data to True, we will log the complete dataframe as in why.log(), but additionally it will compute regression metrics and add them to your results. If you want to log only the the target and prediction columns, without the complete data, you can simply call log_regression_metrics() without specifying log_full_data, which defaults to False.
log_regression_metrics takes the complete dataframe as input (with input/output features, as well as your prediction column and target column). We also have to define which column is our target (in this case, temperature) and which is our prediction column (prediction_temperature in this case).
Once the profile is logged, we can set it's timestamp for the proper day as given by our batch's timestamp.
Now that we have properly timestamped profiles with regression metrics, we can use the writer method to send it to WhyLabs:
Note: for whylogs versions 1.1.13 and lower, the default behavior of
log_regression_metricswas logging the complete data, in addition to target and prediction columns. If you were using it in the older versions and wish to keep that behavior when updating whylogs, setlog_full_datato True.
from whylogs.api.writer.whylabs import WhyLabsWriter
import whylogs as why

columns = ["meta_climate","meta_latitude","meta_longitude","prediction_temperature","temperature"]
for batch in daily_batches:
    dataset_timestamp = batch.timestamp

    df = batch.data[columns]
    print("logging data for date {}".format(dataset_timestamp))
    results = why.log_regression_metrics(df, target_column = "temperature", prediction_column = "prediction_temperature",log_full_data=True)

    profile = results.profile()
    profile.set_dataset_timestamp(dataset_timestamp)
    print("writing profiles to whylabs...")
    results.writer("whylabs").write()
logging data for date 2022-12-13 00:00:00+00:00
writing profiles to whylabs...
logging data for date 2022-12-14 00:00:00+00:00
writing profiles to whylabs...
logging data for date 2022-12-15 00:00:00+00:00
writing profiles to whylabs...
logging data for date 2022-12-16 00:00:00+00:00
writing profiles to whylabs...
logging data for date 2022-12-17 00:00:00+00:00
writing profiles to whylabs...
logging data for date 2022-12-18 00:00:00+00:00
writing profiles to whylabs...
logging data for date 2022-12-19 00:00:00+00:00
writing profiles to whylabs...
And that's it! You just sent your profiles to WhyLabs.
At your model's dashboard, you should see the model metrics for the last seven days. For regression, the displayed metrics are:
- Total output and input count
- Mean Squared Error
- Mean Absolute Error
- Root Mean Squared Error

Advanced Usage - Monitoring Segmented Performance Metrics
You can also log performance metrics for specific segments of your data.
For example, let's say we want to monitor the performance of our model according to climate type . We might be interested in comparing performance metrics of the complete data against a specific segment, such as measurements that were taken from stations located at Dry or Tropical regions.
To do that, it's very simple: we just need to specify the column we wish to segment on and pass that information to a Dataset Schema object, like this:
If you want to learn more about segments, please refer to this example.
from whylogs.core.segmentation_partition import segment_on_column
from whylogs.core.schema import DatasetSchema

segment_column = "meta_climate"
segmented_schema = DatasetSchema(segments=segment_on_column(segment_column))
Now, we can log the profiles as demonstraded previously, with two differences. We'll pass the schema to the log_classification_metrics method, and also set the timestamp to the complete result set:
from whylogs.api.writer.whylabs import WhyLabsWriter
import whylogs as why

columns = ["meta_climate","meta_latitude","meta_longitude","prediction_temperature","temperature"]
for batch in daily_batches:
    dataset_timestamp = batch.timestamp

    df = batch.data[columns]
    print("logging data for date {}".format(dataset_timestamp))
    results = why.log_regression_metrics(
        df,
        target_column = "temperature",
        prediction_column = "prediction_temperature",
        schema=segmented_schema,
        log_full_data=True)

    results.set_dataset_timestamp(dataset_timestamp)
    print("writing profiles to whylabs...")
    results.writer("whylabs").write()
Note that we're passing segmented_schema as the schema parameter. This will tell whylogs to log the metrics for the complete data, as well as for each segment.
You'll get a similar dashboard at the performance page at WhyLabs, but now you'll see a dropdown menu with the available segments (or complete data). You'll also be able to choose a second segment to compare against:
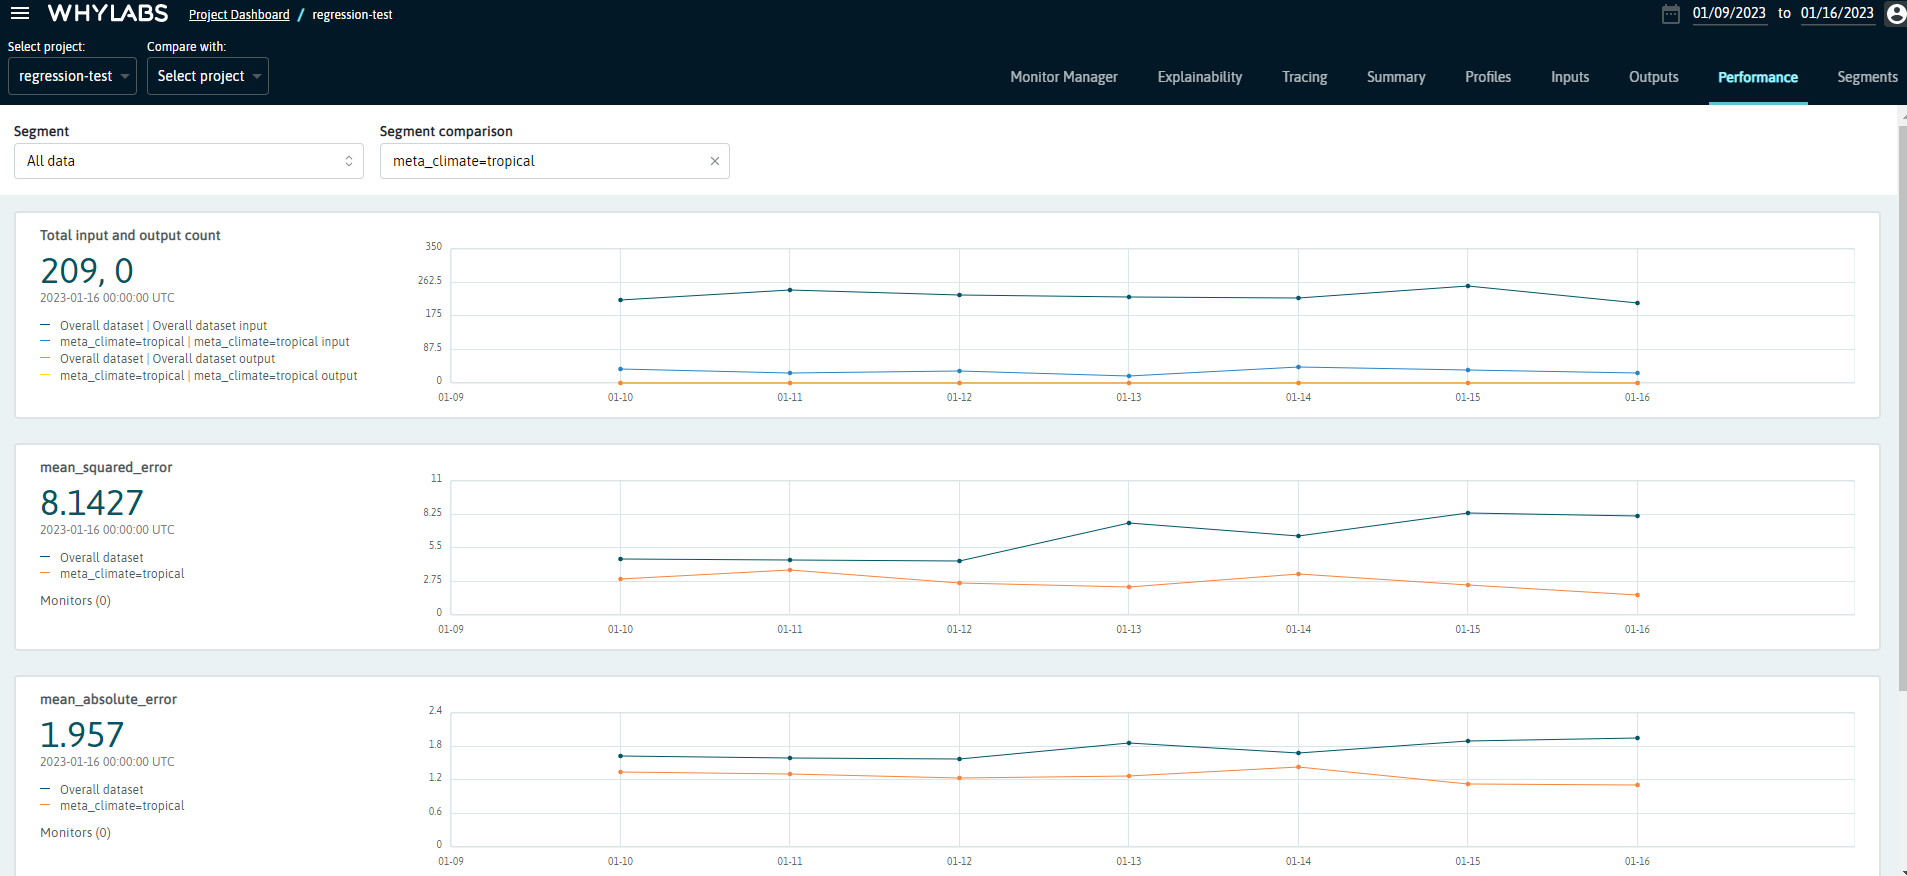
We can see that the errors seem to be similar between the tropical segment and complete data. However, the difference begins to increase with time, with the model's performance for the tropical segment being consistently lower than for the complete data. You can verify it by exploring the other metrics on this dashboard, or look for other insights by exploring the other segments!