Project - Selecting Content for Data Science Company
In this project, we will try to answer the question: "What do people want to learn in data science", and in so doing evaluate the available content for our company which deals with data science education.
Scenario
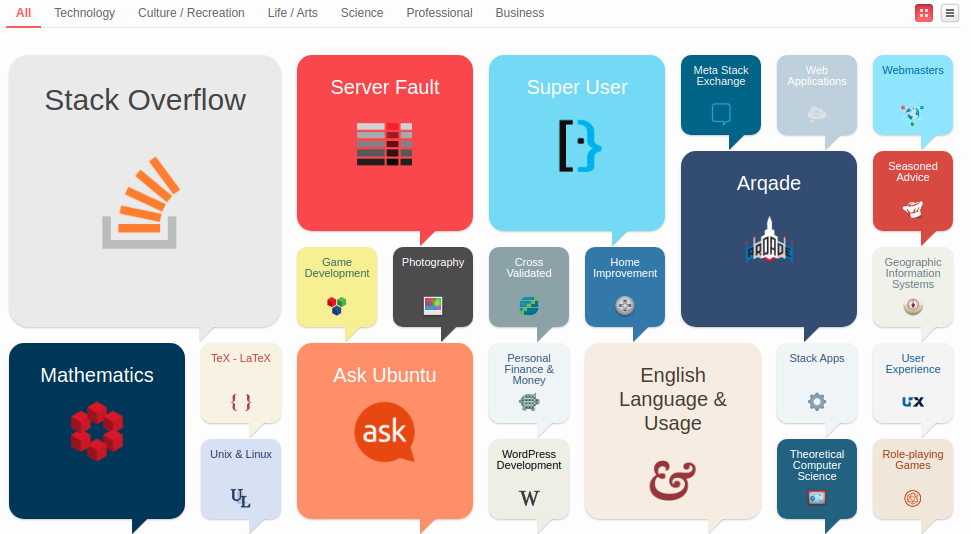
We're working for a company that creates data science content, be it books, online articles, videos or interactive text-based platforms. We're tasked with figuring out what is best content to write about. We realize that if we wanted to figure out what programming content to write, we could consult Stack Overflow (a question and answer website about programming) and see what kind of content is more popular. After investigating Stack Overflow in depth, we find out that it is part of a question and answer website network called Stack Exchange.
Stack Exchange
Stack Exchange hosts sites on a multitude of fields and subjects, including mathematics, physics, philosophy, and data science! Here's a sample of the most popular sites:
Stack Exchange employs a reputation award system for its questions and answers. Each post — each question/answer — is a post that is subject to upvotes and downvotes. This ensures that good posts are easily identifiable. More details are available on this tour
Being a multidisciplinary field, there a few Stack Exchange websites there are relevant to our goal here:
- Data Science
- Cross Validated — a statistics site
- Artificial Intelligence
- Mathematics
- Stack Overflow
And if we want to include Data Engineering, we can also consider:
At the time of writing, in terms of users Data Science Stack Exchange (DSSE) is among top 40 sites with 85K users, however, in terms of unanswered questions it is among bottom 7 with 64% unanswered questions. Further statistics are available here. This makes it quite attractive for exploring data science content.
Data Science Stack Exchange (DSSE)
The site is organized into following sections:
Home: Displays the
top questionsand contains a side bar menu with links to other sections of the site.[Questions]: Features all questions which can be filtered by
No answersandNo accepted answers. Currently, approximately 25,000 questions are featured of which over 15,000 are unanswered or with no accepted answer (63%).Tags are key words which organize questions as topics and facilitate search.
Users features the data on users. Users with highest
reputationare featured before the others. Users can be searched and filtered byuser name,reputation,New useretc.Unanswered features unanswered questions which can be filtered by votes, tags and newest.
The footer menu has links to Tour and Help sections along with links to other Stack Exchange sites and features.
Questions and Answers
Data Science Stack Exchange(DSSE) is a question and answer site for Data science professionals, Machine Learning specialists, and those interested in learning more about the field.The method of asking questions, getting answers, and getting promoted to higher levels is given here:
- The site is all about getting answers. It's not a discussion forum. There's no chit-chat.
- Good answers are voted up and rise to the top. The best answers show up first so that they are always easy to find.
- The person who asked can mark one answer as "accepted". Accepting doesn't mean it's the best answer, it just means that it worked for the person who asked.
- Focus on questions about an actual problem you have faced. Include details about what you have tried and exactly what you are trying to do.
- Avoid questions that are primarily opinion-based, or that are likely to generate discussion rather than answers. Questions that need improvement may be closed until someone fixes them.
- All questions are tagged with their subject areas. Each can have up to 5 tags. We can click any tag to see a list of questions with that tag, or go to the tag list to browse for topics 0f interest.
- User reputation score goes up when others vote up on their questions, answers and edits.
- User Privileges are granted based on reputation score.
import requests
# request data from "https://datascience.stackexchange.com/tags"
response = requests.get("https://datascience.stackexchange.com/tags")

content = response.content


from bs4 import BeautifulSoup

# Initialize the parser, and pass in the content we grabbed earlier.

parser = BeautifulSoup(content, 'html.parser')

tag = parser.select(".post-tag")

tags_scraping = []

for i in range(0,36):
    tag_text = tag[i].text
    tags_scraping.append(tag_text)
print(tags_scraping)
['machine-learning', 'python', 'neural-network', 'deep-learning', 'classification', 'keras', 'scikit-learn', 'tensorflow', 'nlp', 'r', 'time-series', 'dataset', 'regression', 'data-mining', 'clustering', 'cnn', 'predictive-modeling', 'pandas', 'lstm', 'statistics', 'feature-selection', 'data', 'random-forest', 'image-classification', 'decision-trees', 'linear-regression', 'text-mining', 'data-cleaning', 'visualization', 'reinforcement-learning', 'rnn', 'xgboost', 'logistic-regression', 'convnet', 'bigdata', 'svm']
API
Obviously, scraping is a tedious process and getting even the names of tags will involve a lot of coding.
Next, we can try the Stack Exchange API
First, we register the app for access token
- App: Py Lesson
- Get client_id = 18238
- redirect_uri =
https://stackoverflow.com/oauth/login_success
# access token requested
import requests
import requests.auth

response = requests.post("https://stackoverflow.com/oauth/dialog?client_id=18238&redirect_uri=https://stackoverflow.com/oauth/login_success")

print(response.status_code)
200
# access_token is only required for increased quota, write and access to private info
## Following access token is now expired

headers = {'access_token': '6QkGLWxpVNzS6XWzfOFXGw))', 'key': 'LCyb3nlOflFZqImiVbfZog((' }

response = requests.get("https://api.stackexchange.com/2.2/tags?page=1&pagesize=36&order=desc&sort=popular&site=datascience", headers=headers)
tags = response.json()
# Parse the json for extracting names of tags on page-1
import pandas as pd

tags_list = tags['items']

tags_df = pd.DataFrame(tags_list)

tags_api = tags_df["name"]
print(tags_api)
0           machine-learning
1                     python
2             neural-network
3              deep-learning
4             classification
5                      keras
6               scikit-learn
7                 tensorflow
8                        nlp
9                          r
10               time-series
11                   dataset
12                regression
13               data-mining
14                clustering
15                       cnn
16       predictive-modeling
17                    pandas
18                      lstm
19                statistics
20         feature-selection
21                      data
22             random-forest
23      image-classification
24            decision-trees
25         linear-regression
26               text-mining
27             data-cleaning
28             visualization
29    reinforcement-learning
30                       rnn
31                   xgboost
32       logistic-regression
33                   convnet
34                   bigdata
35                       svm
Name: name, dtype: object
# Check whether tag list obtained from scraping and from api are equal
tags_api = list(tags_df["name"])

equal = tags_api==tags_scraping
print(equal) # Are equal
True
Stack Exchange Data Explorer (SEDE)
SEDE is an open source tool for running arbitrary queries against public data from the Stack Exchange network. Features include collaborative query editing for all graduated and public beta Stack Exchange sites.
The data is updated early every Sunday morning around 3:00 UTC.
Apart from web-scraping and use of API, SEDE provides access to the database and entertains T-SQL queries.
Following query run at SEDE gives the same results as obtained from web-scraping and API.
SELECT TOP 36
            TagName, COUNT
  FROM Tags
ORDER BY COUNT DESC;
The query results can be downloaded as a csv file, and a permalink can also be created to the query (as done above). We will now compare results from the query with those of web_scraping and API.
import pandas as pd
query = pd.read_csv("top_36_tags.csv")
tags_query = query["TagName"]
tags_query = list(tags_query)
print(tags_query)
['machine-learning', 'python', 'neural-network', 'deep-learning', 'classification', 'keras', 'scikit-learn', 'tensorflow', 'nlp', 'r', 'time-series', 'dataset', 'regression', 'data-mining', 'clustering', 'cnn', 'predictive-modeling', 'pandas', 'lstm', 'statistics', 'feature-selection', 'data', 'random-forest', 'image-classification', 'decision-trees', 'linear-regression', 'text-mining', 'data-cleaning', 'visualization', 'reinforcement-learning', 'rnn', 'xgboost', 'logistic-regression', 'convnet', 'bigdata', 'svm']
# Check whether these results are same as those obtained from web-scraping and API

equal = tags_api==tags_scraping==tags_query

print(equal) # All results are equal
True
# Determine top ten popular topics from tags
top_ten = query[:10]
print(top_ten)
            TagName  COUNT
0  machine-learning   7879
1            python   4612
2    neural-network   3304
3     deep-learning   3214
4    classification   2182
5             keras   2058
6      scikit-learn   1542
7        tensorflow   1475
8               nlp   1393
9                 r   1224
Getting Posts Data from SEDE
Above, we can see that maximum questions are contained in about top 10 or so tags. Same content (top 36 tags) is displayed on the tags home page
Now we will focus on the Posts table in the database SEDE to create a database for a year (2019) and carry out a more granular analysis.
We will run a query against the SEDE DSSE database that extracts the following columns for all the questions in 2019:
Id: An identification number for the post.
PostTypeId: An identification number for the type of post.
CreationDate: The date and time of creation of the post.
Score: The post's score.
ViewCount: How many times the post was viewed.
Tags: What tags were used.
AnswerCount: How many answers the question got (only applicable to question posts).
FavoriteCount: How many times the question was favored (only applicable to question posts).
Using the API in Tandem
We will use the API in tandem with query in order to compare some of our results.
# Find total number of questions in 2019 using API

response = requests.get("https://api.stackexchange.com/2.2/questions?pagesize=100&fromdate=1546300800&todate=1577750400&order=desc&sort=creation&site=stackoverflow&filter=!5-dmZUPsa(aVhP2rEGYktwXr6kydXo7VO6LStu", headers=headers)
questions_api = response.json()


questions_list = questions_api['items']
questions_100 = pd.DataFrame(questions_list)
print(questions_100.info())
<class 'pandas.core.frame.DataFrame'>
RangeIndex: 100 entries, 0 to 99
Data columns (total 8 columns):
answer_count      100 non-null int64
creation_date     100 non-null int64
favorite_count    100 non-null int64
question_id       100 non-null int64
score             100 non-null int64
tags              100 non-null object
title             100 non-null object
view_count        100 non-null int64
dtypes: int64(6), object(2)
memory usage: 6.3+ KB
None
Find total number of questions from query
We can see from above that the api is limited to returning 100 results per page and getting all the data would need running a loop several times consuming computational resources. We will, therefore, get the complete data from the database running following query
SELECT Id, CreationDate,
       Score, ViewCount, Tags,
       AnswerCount, FavoriteCount
  FROM posts
 WHERE PostTypeId = 1 AND YEAR(CreationDate) = 2019;
Note that of the various post types Post TypeID for "questions" is 1.
We download the results as 2019_questions.csv from SEDE.
# Convert the results into dataframe

questions = pd.read_csv("2019_questions.csv", parse_dates=["CreationDate"])

print(questions.info())
<class 'pandas.core.frame.DataFrame'>
RangeIndex: 7948 entries, 0 to 7947
Data columns (total 7 columns):
Id               7948 non-null int64
CreationDate     7948 non-null datetime64[ns]
Score            7948 non-null int64
ViewCount        7948 non-null int64
Tags             7948 non-null object
AnswerCount      7948 non-null int64
FavoriteCount    1517 non-null float64
dtypes: datetime64[ns](1), float64(1), int64(4), object(1)
memory usage: 434.7+ KB
None
Data Cleaning
We want to eventually focus on the tags column as well as other popularity, so we will carry out following data-cleaning steps:
- Fill missing values in
FavoriteCountwith0as the missing values indicate that the question was not voted upon. - Convert
FavoriteCountintoint - Convert
Tagsstring into a more readable format
# Fill in missing values for the "FavoriteCount" column

questions.fillna(0, inplace=True)
questions["FavoriteCount"] = questions["FavoriteCount"].astype(int)

print(questions.info())
<class 'pandas.core.frame.DataFrame'>
RangeIndex: 7948 entries, 0 to 7947
Data columns (total 7 columns):
Id               7948 non-null int64
CreationDate     7948 non-null datetime64[ns]
Score            7948 non-null int64
ViewCount        7948 non-null int64
Tags             7948 non-null object
AnswerCount      7948 non-null int64
FavoriteCount    7948 non-null int64
dtypes: datetime64[ns](1), int64(5), object(1)
memory usage: 434.7+ KB
None
# Convert format of tags string

print(questions["Tags"].sample(5))
508     <deep-learning><numpy><plotting><matplotlib><i...
6198    <machine-learning><data-mining><data><algorith...
5562                                               <tsne>
2681                                         <statistics>
1936    <neural-network><deep-learning><lstm><reinforc...
Name: Tags, dtype: object
questions["Tags"] = questions["Tags"].str.replace('^<|>$','').str.split('><')
print(questions["Tags"].sample(5))
5582                  [python, statistics, data, ipython]
5807                    [named-entity-recognition, tfidf]
2536    [machine-learning, neural-network, lstm, recur...
6921    [deep-learning, tensorflow, pytorch, transform...
3453    [python, image-classification, computer-vision...
Name: Tags, dtype: object
Most Used and Most Viewed Tags
We will focus on Tags to determine:
- Count how many times each tag was used.
- Count how many times each tag was viewed.
- Create visualizations for the top tags of each of the above results.
print(questions.sample(5))
         Id        CreationDate  Score  ViewCount  \
1225  56141 2019-07-22 09:26:29      0         24
5557  63108 2019-11-13 18:27:55      1         39
762   45343 2019-02-10 17:13:39      1        596
4707  53839 2019-06-15 08:05:34      6        723
2635  61749 2019-10-15 08:21:38      0         21

                                                   Tags  AnswerCount  \
1225  [machine-learning, neural-network, deep-learni...            0
5557  [machine-learning, python, keras, image-prepro...            2
762   [machine-learning, neural-network, deep-learni...            0
4707                           [bigdata, data, xgboost]            3
2635                                      [time-series]            1

      FavoriteCount
1225              0
5557              0
762               0
4707              3
2635              0
tag_no = {}
for tags in questions["Tags"]:
    for tag in tags:
        if tag not in tag_no:
            tag_no[tag] = 1
        else:
            tag_no[tag] += 1
tag_no = pd.DataFrame.from_dict(data=tag_no, orient="index")
tag_no.rename(columns={0: "No"}, inplace=True)
most_used=tag_no.sort_values(by='No', ascending=False, axis=0)

most_used.head(20)
| No | |
|---|---|
| machine-learning | 2443 |
| python | 1652 |
| deep-learning | 1082 |
| neural-network | 960 |
| keras | 841 |
| classification | 629 |
| tensorflow | 515 |
| scikit-learn | 491 |
| nlp | 450 |
| cnn | 439 |
| time-series | 405 |
| lstm | 341 |
| pandas | 340 |
| regression | 316 |
| dataset | 301 |
| clustering | 249 |
| r | 243 |
| predictive-modeling | 242 |
| statistics | 211 |
| machine-learning-model | 206 |
Using SEDE Query
We can use the SEDE Query to obtain the same results as above.
SELECT TagName, COUNT(TagName)
  FROM Posts AS p
                INNER JOIN PostTags AS pt ON pt.PostId=p.id
                INNER JOIN Tags AS t ON t.id=pt.TagId
 WHERE PostTypeId = 1 AND YEAR(CreationDate) = 2019
 GROUP BY TagName
 ORDER BY COUNT(TagName) DESC;
tags_2019 = pd.read_csv("tags_2019.csv")
tags_2019.rename(columns={"Unnamed: 1": "No"}, inplace=True)
print(tags_2019.head(20))
                   TagName    No
0         machine-learning  2443
1                   python  1652
2            deep-learning  1082
3           neural-network   960
4                    keras   841
5           classification   629
6               tensorflow   515
7             scikit-learn   491
8                      nlp   450
9                      cnn   439
10             time-series   405
11                    lstm   341
12                  pandas   340
13              regression   316
14                 dataset   301
15              clustering   249
16                       r   243
17     predictive-modeling   242
18              statistics   211
19  machine-learning-model   206
# Results obtained from query and dataset are equal
equal = list(most_used["No"]) == list(tags_2019["No"])
print(equal)
True
# Determining Viewcounts for Tags in 2019

view_no = {}
for index, row in questions.iterrows():
    for tag in row['Tags']:
        if tag not in view_no:
            view_no[tag] = row['ViewCount']
        else:
            view_no[tag] += row['ViewCount']
view_no = pd.DataFrame.from_dict(data=view_no, orient="index")
view_no.rename(columns={0: "No"}, inplace=True)
most_viewed=view_no.sort_values(by='No', ascending=False, axis=0).head(20)

most_viewed
| No | |
|---|---|
| python | 1196833 |
| machine-learning | 773935 |
| keras | 544628 |
| pandas | 527831 |
| deep-learning | 453475 |
| neural-network | 380012 |
| scikit-learn | 280534 |
| tensorflow | 257580 |
| classification | 209486 |
| dataframe | 203979 |
| nlp | 152420 |
| cnn | 151930 |
| lstm | 143433 |
| time-series | 130870 |
| numpy | 116095 |
| regression | 94623 |
| csv | 88767 |
| pytorch | 88365 |
| dataset | 83026 |
| seaborn | 74060 |
Using SEDE Query
We can use the SEDE Query to obtain the same results as above.
SELECT TagName, SUM(ViewCount)
  FROM Posts AS p
                INNER JOIN PostTags AS pt ON pt.PostId=p.id
                INNER JOIN Tags AS t ON t.id=pt.TagId
                WHERE (PostTypeId = 1 AND YEAR(CreationDate) = 2019)
 GROUP BY TagName
 ORDER BY 2 DESC;
views_2019 = pd.read_csv("views_2019.csv")
views_2019.rename(columns={"Unnamed: 1": "No"}, inplace=True)
print(views_2019.head(20))
             TagName       No
0             python  1196833
1   machine-learning   773935
2              keras   544628
3             pandas   527831
4      deep-learning   453475
5     neural-network   380012
6       scikit-learn   280534
7         tensorflow   257580
8     classification   209486
9          dataframe   203979
10               nlp   152420
11               cnn   151930
12              lstm   143433
13       time-series   130870
14             numpy   116095
15        regression    94623
16               csv    88767
17           pytorch    88365
18           dataset    83026
19           seaborn    74060
# Results obtained from query and dataset are equal
equal = list(most_viewed["No"]) == list(views_2019["No"].head(20))
print(equal)
True
import matplotlib.pyplot as plt
%matplotlib inline
most_used.plot(kind="barh", figsize=(16,8),logx=True) #log scaling on x axis due to very large numbers
<matplotlib.axes._subplots.AxesSubplot at 0x7f17fc305860>

most_viewed.plot(kind="barh", figsize=(16,8),logx=True)#log scaling on x axis due to very large numbers
<matplotlib.axes._subplots.AxesSubplot at 0x7f17f9bdd160>

fig, axes = plt.subplots(1, 2)
fig.set_size_inches((28, 12))
#log scaling on x axis due to very large numbers
most_used.plot(kind="barh", ax=axes[0], subplots=True, logx=True)
most_viewed.plot(kind="barh", ax=axes[1], subplots=True, logx=True)
array([<matplotlib.axes._subplots.AxesSubplot object at 0x7f17f856f5f8>],
      dtype=object)

Relations Between Tags
If we want to see what tags are in most_used, but not in most_viewed, We can identify them by the missing values in ViewCount.
Similarly if we want to know which tags are in the latter, but not the former we can use a similar approach.
in_used = pd.merge(most_used, most_viewed, how="left", left_index=True, right_index=True)
print(in_used)
                           No_x       No_y
machine-learning           2443   773935.0
python                     1652  1196833.0
deep-learning              1082   453475.0
neural-network              960   380012.0
keras                       841   544628.0
classification              629   209486.0
tensorflow                  515   257580.0
scikit-learn                491   280534.0
nlp                         450   152420.0
cnn                         439   151930.0
time-series                 405   130870.0
lstm                        341   143433.0
pandas                      340   527831.0
regression                  316    94623.0
dataset                     301    83026.0
clustering                  249        NaN
r                           243        NaN
predictive-modeling         242        NaN
statistics                  211        NaN
machine-learning-model      206        NaN
data-mining                 196        NaN
data                        192        NaN
feature-selection           191        NaN
image-classification        189        NaN
reinforcement-learning      180        NaN
data-science-model          169        NaN
linear-regression           163        NaN
xgboost                     158        NaN
pytorch                     155    88365.0
loss-function               152        NaN
...                         ...        ...
mongodb                       1        NaN
google-cloud                  1        NaN
functional-api                1        NaN
kendalls-tau-coefficient      1        NaN
stata                         1        NaN
bayes-error                   1        NaN
corpus                        1        NaN
spyder                        1        NaN
consumerweb                   1        NaN
lime                          1        NaN
open-source                   1        NaN
3d-object-detection           1        NaN
gru                           1        NaN
usecase                       1        NaN
version-control               1        NaN
manifold                      1        NaN
multivariate-distribution     1        NaN
statsmodels                   1        NaN
community                     1        NaN
adaboost                      1        NaN
.net                          1        NaN
redshift                      1        NaN
least-squares-svm             1        NaN
hashingvectorizer             1        NaN
wikipedia                     1        NaN
hog                           1        NaN
nl2sql                        1        NaN
isolation-forest              1        NaN
lda-classifier                1        NaN
state-of-the-art              1        NaN

[503 rows x 2 columns]
pd.merge(most_used, most_viewed, how="right", left_index=True, right_index=True)
| No_x | No_y | |
|---|---|---|
| python | 1652 | 1196833 |
| machine-learning | 2443 | 773935 |
| keras | 841 | 544628 |
| pandas | 340 | 527831 |
| deep-learning | 1082 | 453475 |
| neural-network | 960 | 380012 |
| scikit-learn | 491 | 280534 |
| tensorflow | 515 | 257580 |
| classification | 629 | 209486 |
| dataframe | 76 | 203979 |
| nlp | 450 | 152420 |
| cnn | 439 | 151930 |
| lstm | 341 | 143433 |
| time-series | 405 | 130870 |
| numpy | 110 | 116095 |
| regression | 316 | 94623 |
| csv | 24 | 88767 |
| pytorch | 155 | 88365 |
| dataset | 301 | 83026 |
| seaborn | 35 | 74060 |
clustering,r,predictive-modeling,statisticsandmachine-learning-modelare inmost_usedbut not inmost_viewed.dataframe,numpy,csv,pytorchandseabornare inmost_viewedbut not inmost-used.
** Simpler Approach using Sets**
A far simpler appraoch is to use set methods intersection and difference
- As is obvious below, it gives the same results as above.
set(most_used.index).intersection(set(most_viewed.index))
{'classification',
 'cnn',
 'csv',
 'dataframe',
 'dataset',
 'deep-learning',
 'keras',
 'lstm',
 'machine-learning',
 'neural-network',
 'nlp',
 'numpy',
 'pandas',
 'python',
 'pytorch',
 'regression',
 'scikit-learn',
 'seaborn',
 'tensorflow',
 'time-series'}
set(most_used.index).difference(set(most_viewed.index))
{'.net',
 '3d-object-detection',
 '3d-reconstruction',
 'ab-test',
 'accuracy',
 'activation-function',
 'active-learning',
 'activity-recognition',
 'actor-critic',
 'adaboost',
 'aggregation',
 'ai',
 'alex-net',
 'algorithms',
 'allennlp',
 'anaconda',
 'ann',
 'annotation',
 'anomaly',
 'anomaly-detection',
 'anonymization',
 'anova',
 'apache-hadoop',
 'apache-spark',
 'arima',
 'association-rules',
 'attention-mechanism',
 'auc',
 'audio-recognition',
 'autoencoder',
 'automatic-summarization',
 'automation',
 'automl',
 'aws',
 'aws-lambda',
 'azure-ml',
 'backpropagation',
 'batch-normalization',
 'bayes-error',
 'bayesian',
 'bayesian-networks',
 'bayesian-nonparametric',
 'beginner',
 'bert',
 'bias',
 'bigdata',
 'binary',
 'bioinformatics',
 'books',
 'boosting',
 'c',
 'c++',
 'caffe',
 'career',
 'categorical-data',
 'categorical-encoding',
 'categories',
 'causalimpact',
 'chatbot',
 'churn',
 'class-imbalance',
 'classifier',
 'cloud',
 'cloud-computing',
 'clustering',
 'clusters',
 'code',
 'colab',
 'collinearity',
 'community',
 'competitions',
 'computer-vision',
 'confusion-matrix',
 'consumerweb',
 'convergence',
 'convnet',
 'convolution',
 'corpus',
 'correlation',
 'cosine-distance',
 'cost-function',
 'counts',
 'coursera',
 'crawling',
 'cross-validation',
 'data',
 'data-analysis',
 'data-augmentation',
 'data-cleaning',
 'data-formats',
 'data-imputation',
 'data-indexing-techniques',
 'data-leakage',
 'data-mining',
 'data-product',
 'data-science-model',
 'data-stream-mining',
 'data-wrangling',
 'data.table',
 'databases',
 'dbscan',
 'decision-trees',
 'deep-network',
 'deepmind',
 'definitions',
 'density-estimation',
 'derivation',
 'descriptive-statistics',
 'difference',
 'dimensionality-reduction',
 'dirichlet',
 'discounted-reward',
 'discriminant-analysis',
 'distance',
 'distributed',
 'distribution',
 'doc2vec',
 'domain-adaptation',
 'dplyr',
 'dqn',
 'dropout',
 'dummy-variables',
 'dynamic-programming',
 'education',
 'efficiency',
 'embeddings',
 'encoder',
 'encoding',
 'ensemble',
 'ensemble-learning',
 'ensemble-modeling',
 'epochs',
 'error-handling',
 'esl',
 'estimators',
 'etl',
 'evaluation',
 'evolutionary-algorithms',
 'excel',
 'expectation-maximization',
 'experiments',
 'explainable-ai',
 'fastai',
 'faster-rcnn',
 'feature-construction',
 'feature-engineering',
 'feature-extraction',
 'feature-map',
 'feature-reduction',
 'feature-scaling',
 'feature-selection',
 'features',
 'finance',
 'finetuning',
 'finite-precision',
 'forecast',
 'forecasting',
 'frequentist',
 'functional-api',
 'fuzzy-classification',
 'fuzzy-logic',
 'galago',
 'game',
 'gan',
 'gaussian',
 'gaussian-process',
 'gbm',
 'generalization',
 'generative-models',
 'genetic-algorithms',
 'genetic-programming',
 'gensim',
 'geospatial',
 'ggplot2',
 'glm',
 'gmm',
 'google',
 'google-cloud',
 'google-prediction-api',
 'gpu',
 'gradient-descent',
 'graphical-model',
 'graphs',
 'grid-search',
 'gridsearchcv',
 'groupby',
 'gru',
 'h2o',
 'hardware',
 'hashingvectorizer',
 'heatmap',
 'hierarchical-data-format',
 'hinge-loss',
 'historgram',
 'history',
 'hive',
 'hog',
 'homework',
 'huggingface',
 'hyperparameter',
 'hyperparameter-tuning',
 'image',
 'image-classification',
 'image-preprocessing',
 'image-recognition',
 'image-segmentation',
 'image-size',
 'imbalanced-learn',
 'implementation',
 'inception',
 'inceptionresnetv2',
 'indexing',
 'infographics',
 'information-retrieval',
 'information-theory',
 'interpolation',
 'interpretation',
 'ipython',
 'isolation-forest',
 'jaccard-coefficient',
 'java',
 'javascript',
 'json',
 'julia',
 'jupyter',
 'k-means',
 'k-nn',
 'kaggle',
 'kendalls-tau-coefficient',
 'keras-rl',
 'kernel',
 'kitti-dataset',
 'knime',
 'labels',
 'language-model',
 'lasso',
 'lda',
 'lda-classifier',
 'learning',
 'learning-rate',
 'learning-to-rank',
 'least-squares-svm',
 'lightgbm',
 'lime',
 'linear-algebra',
 'linear-regression',
 'linux',
 'logistic-regression',
 'loss-function',
 'machine-learning-model',
 'machine-translation',
 'management',
 'manhattan',
 'manifold',
 'map-reduce',
 'market-basket-analysis',
 'marketing',
 'markov',
 'markov-hidden-model',
 'markov-process',
 'math',
 'mathematics',
 'matlab',
 'matplotlib',
 'matrix',
 'matrix-factorisation',
 'mcmc',
 'mean-shift',
 'meta-learning',
 'metadata',
 'methodology',
 'methods',
 'metric',
 'mini-batch-gradient-descent',
 'missing-data',
 'ml',
 'mlp',
 'mnist',
 'model-selection',
 'momentum',
 'mongodb',
 'monte-carlo',
 'movielens',
 'mse',
 'multi-instance-learning',
 'multi-output',
 'multiclass-classification',
 'multilabel-classification',
 'multitask-learning',
 'multivariate-distribution',
 'mutual-information',
 'naive-bayes-algorithim',
 'naive-bayes-classifier',
 'named-entity-recognition',
 'natural-language-process',
 'ndcg',
 'networkx',
 'neural',
 'neural-style-transfer',
 'ngrams',
 'nl2sql',
 'nlg',
 'nltk',
 'noise',
 'noisification',
 'non-parametric',
 'normal-equation',
 'normalization',
 'nosql',
 'notation',
 'numerical',
 'nvidia',
 'object-detection',
 'object-recognition',
 'objective-function',
 'ocr',
 'octave',
 'one-hot-encoding',
 'one-shot-learning',
 'online-learning',
 'open-source',
 'openai-gpt',
 'openai-gym',
 'opencv',
 'optimization',
 'orange',
 'orange3',
 'outlier',
 'overfitting',
 'pac-learning',
 'parallel',
 'parameter',
 'parameter-estimation',
 'parsing',
 'pattern-recognition',
 'pca',
 'pearsons-correlation-coefficient',
 'perceptron',
 'performance',
 'pickle',
 'pip',
 'pipelines',
 'plotting',
 'policy-gradients',
 'pooling',
 'powerbi',
 'predict',
 'prediction',
 'predictive-modeling',
 'predictor-importance',
 'preprocessing',
 'privacy',
 'probabilistic-programming',
 'probability',
 'probability-calibration',
 'processing',
 'programming',
 'project-planning',
 'pruning',
 'pyspark',
 'python-3.x',
 'pytorch-geometric',
 'q-learning',
 'question-answering',
 'r',
 'random-forest',
 'randomized-algorithms',
 'ranking',
 'rbf',
 'rbm',
 'rdkit',
 'recommender-system',
 'recurrent-neural-net',
 'redshift',
 'reference-request',
 'regex',
 'regularization',
 'reinforcement-learning',
 'relational-dbms',
 'representation',
 'research',
 'reshape',
 'ridge-regression',
 'rmse',
 'rnn',
 'rstudio',
 'sagemaker',
 'sampling',
 'sap',
 'sas',
 'scala',
 'scalability',
 'scipy',
 'score',
 'scoring',
 'scraping',
 'search',
 'search-engine',
 'self-driving',
 'self-study',
 'semantic-similarity',
 'semi-supervised-learning',
 'sensors',
 'sentiment-analysis',
 'sequence',
 'sequence-to-sequence',
 'sequential-pattern-mining',
 'serialisation',
 'shap',
 'siamese-networks',
 'similar-documents',
 'similarity',
 'simulation',
 'smote',
 'smotenc',
 'social-network-analysis',
 'softmax',
 'software-development',
 'software-recommendation',
 'spacy',
 'sparsity',
 'spearmans-rank-correlation',
 'speech-to-text',
 'sports',
 'spss',
 'spyder',
 'sql',
 'stacked-lstm',
 'stanford-nlp',
 'stata',
 'state-of-the-art',
 'statistics',
 'statsmodels',
 'stemming',
 'structured-data',
 'supervised-learning',
 'survival-analysis',
 'svm',
 'svr',
 'tableau',
 'terminology',
 'tesseract',
 'text',
 'text-classification',
 'text-filter',
 'text-generation',
 'text-mining',
 'tfidf',
 'theano',
 'theory',
 'time',
 'tokenization',
 'tools',
 'topic-model',
 'torch',
 'training',
 'transfer-learning',
 'transformer',
 'tsne',
 'twitter',
 'unbalanced-classes',
 'unseen-data',
 'unsupervised-learning',
 'usecase',
 'vae',
 'variance',
 'vc-theory',
 'vector-space-models',
 'version-control',
 'vgg16',
 'visualization',
 'web-scraping',
 'weight-initialization',
 'weighted-data',
 'weka',
 'wikipedia',
 'windows',
 'wolfram-language',
 'word',
 'word-embeddings',
 'word2vec',
 'xgboost',
 'yolo'}
set(most_viewed.index).difference(set(most_used.index))
set()
Identifying Potential Data Science Content using Domain Knowledge
As practitioners, we are aware that data science is a multi-disciplinary field with broad interlinked disciplines as under:
- Computer programming
- Data management
- Calculus, Maths and Algebra
- Statistics and Probability
- Artificial Intelligence
Our strategy will be:
- Identify most popular (most_used) tags associated with each dsicipline using domain knowledge.
- Run queries in the DSDE database to get other tags most frequently used with most popular tags.
- Create a superset of tags for each domain (discipline) and make them unique through set operations
- classify
tagscolumn inall_questionsdataframe against each superset for classification as a subset.
Since general coding questions are dealt with at stack overflow, we will leave this part out.
- From Data management, we will focus on the tag
datasetand create supersetss_data - From the mathematical domains, we will focus on the tag
statisticsand create supersetss_stat - From AI domains, we will focus on tags
machine-learninganddeep-learningand create supersetss_ai
Superset Data
Run following query at SEDE
SELECT Tags, TagName
  FROM Posts AS p
                INNER JOIN PostTags AS pt ON pt.PostId=p.id
                INNER JOIN Tags AS t ON t.id=pt.TagId
 WHERE TagName = 'dataset';
# Create a set 'ss_data'
ss_data_df = pd.read_csv("ss_data.csv")

ss_data_df["Tags"] = ss_data_df["Tags"].str.replace('^<|>$','').str.split('><') # clean dataframe

print(ss_data_df.head(5),'\n')


ss_data_list = []
for index, row in ss_data_df.iterrows():
    for tag in row['Tags']:
        ss_data_list.append(tag)
print(ss_data_list[:10], '\n')

print(len(ss_data_list),'\n')

ss_data = set(ss_data_list)

print(len(ss_data))
                                                Tags  TagName
0                             [open-source, dataset]  dataset
1                   [open-source, dataset, crawling]  dataset
2  [machine-learning, classification, dataset, cl...  dataset
3                   [visualization, dataset, graphs]  dataset
4                          [knowledge-base, dataset]  dataset

['open-source', 'dataset', 'open-source', 'dataset', 'crawling', 'machine-learning', 'classification', 'dataset', 'clustering', 'text-mining']

3491

271
Superset Statistics
Run following query at SEDE
SELECT Tags, TagName
  FROM Posts AS p
                INNER JOIN PostTags AS pt ON pt.PostId=p.id
                INNER JOIN Tags AS t ON t.id=pt.TagId
 WHERE TagName = 'statistics';
# Create a set 'ss_stat'
ss_stat_df = pd.read_csv("ss_stats.csv")

ss_stat_df["Tags"] = ss_stat_df["Tags"].str.replace('^<|>$','').str.split('><') # clean dataframe

print(ss_stat_df.head(5),'\n')


ss_stat_list = []
for index, row in ss_stat_df.iterrows():
    for tag in row['Tags']:
        ss_stat_list.append(tag)
print(ss_stat_list[:10], '\n')

print(len(ss_stat_list),'\n')

ss_stat = set(ss_stat_list)

print(len(ss_stat))
                                                Tags     TagName
0                              [bigdata, statistics]  statistics
1                              [statistics, bigdata]  statistics
2  [bigdata, machine-learning, databases, statist...  statistics
3  [machine-learning, statistics, feature-selection]  statistics
4                    [statistics, reference-request]  statistics

['bigdata', 'statistics', 'statistics', 'bigdata', 'bigdata', 'machine-learning', 'databases', 'statistics', 'education', 'machine-learning']

2535

220
Superset machine-learning
Run following query at SEDE
SELECT Tags, TagName
  FROM Posts AS p
                INNER JOIN PostTags AS pt ON pt.PostId=p.id
                INNER JOIN Tags AS t ON t.id=pt.TagId
 WHERE TagName = 'machine-learning';
# Create a set 'ss_ml'
ss_ml_df = pd.read_csv("ss_ml.csv")

ss_ml_df["Tags"] = ss_ml_df["Tags"].str.replace('^<|>$','').str.split('><') # clean dataframe

print(ss_ml_df.head(5),'\n')


ss_ml_list = []
for index, row in ss_ml_df.iterrows():
    for tag in row['Tags']:
        ss_ml_list.append(tag)
print(ss_ml_list[:10], '\n')

print(len(ss_ml_list),'\n')

ss_ml = set(ss_ml_list)

print(len(ss_ml))
                                                Tags           TagName
0                                 [machine-learning]  machine-learning
1                [machine-learning, bigdata, libsvm]  machine-learning
2            [machine-learning, predictive-modeling]  machine-learning
3                    [data-mining, machine-learning]  machine-learning
4  [machine-learning, dimensionality-reduction, p...  machine-learning

['machine-learning', 'machine-learning', 'bigdata', 'libsvm', 'machine-learning', 'predictive-modeling', 'data-mining', 'machine-learning', 'machine-learning', 'dimensionality-reduction']

27613

476
# Create a set 'ss_dl'
ss_dl_df = pd.read_csv("ss_dl.csv")

ss_dl_df["Tags"] = ss_dl_df["Tags"].str.replace('^<|>$','').str.split('><') # clean dataframe

print(ss_dl_df.head(5),'\n')


ss_dl_list = []
for index, row in ss_dl_df.iterrows():
    for tag in row['Tags']:
        ss_dl_list.append(tag)
print(ss_dl_list[:10], '\n')

print(len(ss_dl_list),'\n')

ss_dl = set(ss_dl_list)

print(len(ss_dl))
                                                Tags        TagName
0  [machine-learning, neural-network, deep-learni...  deep-learning
1                    [neural-network, deep-learning]  deep-learning
2  [machine-learning, data-mining, neural-network...  deep-learning
3  [machine-learning, classification, deep-learning]  deep-learning
4                  [machine-learning, deep-learning]  deep-learning

['machine-learning', 'neural-network', 'deep-learning', 'optimization', 'hyperparameter', 'neural-network', 'deep-learning', 'machine-learning', 'data-mining', 'neural-network']

12249

369
# We will join ss_ml and ss_dl to create one superset ss_ai
ss_ai = ss_ml.union(ss_dl)

print(len(ss_ai))
495
Classification of Questions into Data Science Disciplines
We have now created 3 supersets i.e.
ss_data,ss_statandss_aicontaining unique values of tags related to three broad disciplines: "Data Management (dm)", "Statistics (stat)" and "Artificial Intelligence (ai)"We will now see, how many questions ever asked on SEDE (Data Science) fall under these disciplines.
Run following query at SEDE to get all_questions:
SELECT Id, CreationDate, Tags
  FROM posts
 WHERE PostTypeId = 1;
# Create dataframe aq
aq = pd.read_csv("all_questions.csv")

aq["Tags"] = aq["Tags"].str.replace('^<|>$','').str.split('><') # clean dataframe


print(aq.head(10),'\n')
      Id         CreationDate  \
0  45416  2019-02-12 00:36:29
1  45418  2019-02-12 00:50:39
2  45422  2019-02-12 04:40:51
3  45426  2019-02-12 04:51:49
4  45427  2019-02-12 05:08:24
5  45428  2019-02-12 05:43:18
6  45430  2019-02-12 06:20:30
7  45431  2019-02-12 07:26:56
8  45433  2019-02-12 08:56:23
9  45434  2019-02-12 09:09:01

                                                Tags
0      [python, keras, tensorflow, cnn, probability]
1                                   [neural-network]
2                      [python, ibm-watson, chatbot]
3                                            [keras]
4  [r, predictive-modeling, machine-learning-mode...
5                                              [cnn]
6                       [machine-learning, learning]
7                                 [machine-learning]
8                  [python, keras, tensorflow, lstm]
9           [neural-network, feature-selection, mlp]
- We will create three additional columns in the aq dataframe
dm,stat,aiand populate them with 0 - if the tags list is a subset of any of the supersets respective column will change to 1
zeros = []
for index, row in aq.iterrows():
    zeros.append(0)
aq["dm"] = zeros
aq["stat"] = zeros
aq["ai"] = zeros

print(aq.head(5),'\n')
      Id         CreationDate  \
0  45416  2019-02-12 00:36:29
1  45418  2019-02-12 00:50:39
2  45422  2019-02-12 04:40:51
3  45426  2019-02-12 04:51:49
4  45427  2019-02-12 05:08:24

                                                Tags  dm  stat  ai
0      [python, keras, tensorflow, cnn, probability]   0     0   0
1                                   [neural-network]   0     0   0
2                      [python, ibm-watson, chatbot]   0     0   0
3                                            [keras]   0     0   0
4  [r, predictive-modeling, machine-learning-mode...   0     0   0
print(ss_data)
{'visualization', 'encoding', 'normal-equation', 'random-forest', 'association-rules', 'self-driving', 'crawling', 'scipy', 'batch-normalization', 'knowledge-base', 'tesseract', 'loss-function', 'text-classification', 'labels', 'non-parametric', 'tools', 'bioinformatics', 'overfitting', 'ngboost', 'probability', 'decision-trees', 'mlp', 'categorical-data', 'image', 'word-embeddings', 'randomized-algorithms', 'perceptron', 'automatic-summarization', 'feature-extraction', 'processing', 'neural-network', 'interpolation', 'image-preprocessing', 'ai', 'unbalanced-classes', 'nlp', 'mnist', 'reshape', 'data.table', 'data-science-model', 'named-entity-recognition', 'faster-rcnn', 'multiclass-classification', 'serialisation', 'annotation', 'rnn', 'sensors', 'beginner', 'logistic-regression', 'supervised-learning', 'kaggle', 'torch', 'finance', 'bias', 'data-augmentation', 'normalization', 'powerbi', 'pca', 'json', 'version-control', 'sentiment-analysis', 'unsupervised-learning', 'metadata', 'tsne', 'orange3', 'gradient-descent', 'algorithms', 'learning', 'natural-language-process', 'numpy', 'social-network-analysis', 'epochs', 'multitask-learning', 'geospatial', 'accuracy', 'linearly-separable', 'ridge-regression', 'search', 'ab-test', 'prediction', 'model-selection', 'neural', 'data-formats', 'smote', 'outlier', 'project-planning', 'keras', 'aws', 'naive-bayes-classifier', 'svm', 'ensemble-learning', 'correlation', 'recurrent-neural-net', 'data-analysis', 'reference-request', 'text-mining', 'math', 'dbscan', 'gan', 'statistics', 'parameter', 'theory', 'heatmap', 'apache-spark', 'information-retrieval', 'cross-validation', 'data-imputation', 'dummy-variables', 'orange', 'open-source', 'preprocessing', 'multilabel-classification', 'methods', 'regression', 'separable', 'methodology', 'matrix-factorisation', 'metric', 'k-means', 'predictive-modeling', 'research', 'yolo', 'software-recommendation', 'python-3.x', 'privacy', 'computer-vision', 'weka', 'feature-selection', 'web-scraping', 'sas', 'data-stream-mining', 'speech-to-text', 'twitter', 'convolution', 'terminology', 'deep-network', 'similarity', 'python', 'activity-recognition', 'mean-shift', 'machine-learning-model', 'bigdata', 'cnn', 'convnet', 'colab', 'generalization', 'infographics', 'descriptive-statistics', 'lstm', 'excel', 'marketing', 'matplotlib', 'windows', 'generative-models', 'active-learning', 'dimensionality-reduction', 'scikit-learn', 'weighted-data', 'machine-learning', 'definitions', 'training', 'activation-function', 'genetic-algorithms', 'object-detection', 'distribution', 'tableau', 'noisification', 'clusters', 'error-handling', 'categorical-encoding', 'distance', 'one-hot-encoding', 'scraping', 'fuzzy-logic', 'binary', 'performance', 'multivariate-distribution', 'variance', 'time-series', 'boosting', 'ipython', 'plotting', 'databases', 'books', 'graphical-model', 'dataset', 'topic-model', 'noise', 'graphs', 'q-learning', 'career', 'imbalanced-learn', 'machine-translation', 'programming', 'stanford-nlp', 'matlab', 'counts', 'ngrams', 'reinforcement-learning', 'autoencoder', 'image-classification', 'anonymization', 'data-wrangling', 'experiments', 'sampling', 'csv', 'freebase', 'object-recognition', 'pytorch', 'audio-recognition', 'matrix', 'java', 'word2vec', 'simulation', 'recommender-system', 'text', 'ocr', 'labelling', 'feature-scaling', 'r', 'attention-mechanism', 'rstudio', 'missing-data', 'dplyr', 'xgboost', 'deep-learning', 'gridsearchcv', 'etl', 'evaluation', 'parsing', 'mutual-information', 'optimization', 'scoring', 'dataframe', 'k-nn', 'feature-construction', 'numerical', 'apache-hadoop', 'linear-regression', 'clustering', 'transformer', 'pandas', 'classification', 'ml', 'ranking', 'implementation', 'fastai', 'bayesian-networks', 'domain-adaptation', 'sql', 'data-cleaning', 'sequence', 'pyspark', 'language-model', 'anomaly-detection', 'forecasting', 'discriminant-analysis', 'caffe', 'data-mining', 'image-recognition', 'class-imbalance', 'aggregation', 'data', 'feature-engineering', 'tensorflow', 'ensemble-modeling', 'hyperparameter-tuning', 'bert', 'multi-instance-learning', 'google', 'features'}
# Convert "Tags" column to set using apply method
aq["Tags"] = aq["Tags"].apply(set)

print(aq.head(5),'\n')
      Id         CreationDate  \
0  45416  2019-02-12 00:36:29
1  45418  2019-02-12 00:50:39
2  45422  2019-02-12 04:40:51
3  45426  2019-02-12 04:51:49
4  45427  2019-02-12 05:08:24

                                                Tags  dm  stat  ai
0      {cnn, python, probability, tensorflow, keras}   0     0   0
1                                   {neural-network}   0     0   0
2                      {python, ibm-watson, chatbot}   0     0   0
3                                            {keras}   0     0   0
4  {simulation, predictive-modeling, r, machine-l...   0     0   0
""" Identifies whether a set is a subset of a superset"""
def inset(x, ss):
    if x.issubset(ss):
        return 1
    else:
        return 0

aq["dm"] = aq["Tags"].apply(inset, ss=ss_data)
aq["stat"] = aq["Tags"].apply(inset, ss=ss_stat)
aq["ai"] = aq["Tags"].apply(inset, ss=ss_ai)

print(aq.head(20))
       Id         CreationDate  \
0   45416  2019-02-12 00:36:29
1   45418  2019-02-12 00:50:39
2   45422  2019-02-12 04:40:51
3   45426  2019-02-12 04:51:49
4   45427  2019-02-12 05:08:24
5   45428  2019-02-12 05:43:18
6   45430  2019-02-12 06:20:30
7   45431  2019-02-12 07:26:56
8   45433  2019-02-12 08:56:23
9   45434  2019-02-12 09:09:01
10  45436  2019-02-12 09:41:33
11  45437  2019-02-12 09:47:13
12  45438  2019-02-12 09:59:33
13  45441  2019-02-12 11:35:08
14  45442  2019-02-12 11:35:56
15  45443  2019-02-12 11:36:15
16  45444  2019-02-12 12:00:15
17  45449  2019-02-12 13:55:49
18  45451  2019-02-12 14:33:37
19  45452  2019-02-12 15:09:52

                                                 Tags  dm  stat  ai
0       {cnn, python, probability, tensorflow, keras}   1     1   1
1                                    {neural-network}   1     1   1
2                       {python, ibm-watson, chatbot}   0     0   0
3                                             {keras}   1     1   1
4   {simulation, predictive-modeling, r, machine-l...   1     1   1
5                                               {cnn}   1     1   1
6                        {learning, machine-learning}   1     1   1
7                                  {machine-learning}   1     1   1
8                   {python, lstm, tensorflow, keras}   1     1   1
9            {feature-selection, neural-network, mlp}   1     0   1
10          {predictive-modeling, recommender-system}   1     1   1
11                    {python, classification, keras}   1     1   1
12                           {python, neural-network}   1     1   1
13                                 {python, anaconda}   0     0   1
14     {python, deep-learning, neural-network, keras}   1     1   1
15              {scikit-learn, python, random-forest}   1     1   1
16  {time-series, data-cleaning, lstm, rnn, data-m...   1     1   1
17                          {dataset, python, pandas}   1     1   1
18                                            {keras}   1     1   1
19       {dataset, sampling, statistics, data-mining}   1     1   1
print(aq.info())
<class 'pandas.core.frame.DataFrame'>
RangeIndex: 21576 entries, 0 to 21575
Data columns (total 6 columns):
Id              21576 non-null int64
CreationDate    21576 non-null object
Tags            21576 non-null object
dm              21576 non-null int64
stat            21576 non-null int64
ai              21576 non-null int64
dtypes: int64(4), object(2)
memory usage: 1011.5+ KB
None
Set membership
Let's recall that the supersets are collections of tags which have ever been used with a combination of marker tags machine=learning, deep-learning, statistcs and datasets of 3 main disciplines i.e. "AI", "Maths" and "Data Management" which we identified based on domain knowledge. The larger the superset the more likely it will be for any combination of tags or even a single tag to be identified as a subset of a particular superset.
As seen below, at present the membership criteria is quite lax and is solely contingent upon "size of the superset".
# Finding the size of membership
print ('ai members:', '\n', sum(aq["ai"]))

print ('dm members:', '\n', sum(aq["dm"]))

print ('stat members:', '\n', sum(aq["stat"]))
ai members:
 21234
dm members:
 17584
stat members:
 15847
Refining "Discipline" Membership Criteria
As seen above, out of approximately 22,000 questions, more than 21,000 are classified as belonging to AI disciplines such as machine-learning and deep-learning.
So, it should not be enough to be a member of a superset.
Since, the supersets control which particular combination of tags are its members, we must impose additionsl conditions for membership.
We will amend the function inset to indiscip to reflect following additional/ existing conditions:
Length of the set of tags must be at least 2, as a serious questioner homes in on topic of relevance from broad categories to specific topic or vice-versa. It is not necessary that, he will use the key tags such as
machine-learningordatasetorstatisticsas people with different knowledge and skills are likely to have different conceptions of what is a broad category.Unique Membership We cannot implemenr unique membership, as there are lot of interlinks and cross-overs. A subset can be identified as belonging to more than one discipline. This is presently
True. But we need to place some constraints on membership based on 'tags-combination'. For this, we will impose following condition throughindiscpfunction:
Out of a given combination of 'tags' for a question which is a subset of a particular superset, at least one 'tag' out of the combination, should not be a member of one of the other two other supersets.
- Size of Superset If we run following query at SEDE, we get the total number of tags used on the site.
SELECT COUNT(TagName)
  FROM Tags
596
In order to qualify as a discipline, the size of superset should be substantial enough. We fix it arbitrarily as 25% (150) of unique tag names.
"""Identifies whether a set of 'tags' is a subset of a data science discipline"""
def indiscip(x, ss1, ss2, ss3):
    if (x.issubset(ss1) and len(x) >=2 and len(ss1) > 150) and (len(x.difference(ss2))>=1 or len(x.difference(ss3))>=1):
        return 1
    else:
        return 0

aq["dm"] = aq["Tags"].apply(indiscip, ss1=ss_data, ss2=ss_stat, ss3=ss_ai)
aq["stat"] = aq["Tags"].apply(indiscip, ss1=ss_stat, ss2=ss_data, ss3=ss_ai)
aq["ai"] = aq["Tags"].apply(indiscip, ss1=ss_ai, ss2=ss_data, ss3=ss_stat)


print ('ai questions:', '\n', sum(aq["ai"]))

print ('dm questions:', '\n', sum(aq["dm"]))

print ('stat questions:', '\n', sum(aq["stat"]))
ai questions:
 6089
dm questions:
 2573
stat questions:
 1007
# Plot results for AI
import seaborn as sns
sns.set(style="darkgrid")

ax1= sns.countplot(y="ai", data=aq, facecolor=(0, 0, 0, 0),
                   linewidth=5,
                   edgecolor=sns.color_palette("dark", 3))
/dataquest/system/env/python3/lib/python3.4/site-packages/seaborn/categorical.py:1428: FutureWarning:

remove_na is deprecated and is a private function. Do not use.

# Plot results for Data Management
ax= sns.countplot(y="dm", data=aq, facecolor=(0, 0, 0, 0),
                   linewidth=5,
                   edgecolor=sns.color_palette("dark", 3))
/dataquest/system/env/python3/lib/python3.4/site-packages/seaborn/categorical.py:1428: FutureWarning:

remove_na is deprecated and is a private function. Do not use.

# Plot results from Statistics
ax=sns.countplot(y="stat", data=aq, facecolor=(0, 0, 0, 0),
                   linewidth=5,
                   edgecolor=sns.color_palette("dark", 3))
/dataquest/system/env/python3/lib/python3.4/site-packages/seaborn/categorical.py:1428: FutureWarning:

remove_na is deprecated and is a private function. Do not use.

Exploring Time-Series for all Disciplines
From above it can be seen that AI and its components machine-learning and subfield deep-learning form the major thrust of questions at SEDS. However, other disciplines are not insignificant, and We will explore them further as a time series.
- We have already classified all
aiquestions asdeep-learningquestions.
We will now use the dataframe aq to:
- Count how many questions per discipline including
deep-learningare asked per time period. - The total amount of questions per time period.
- How many
deep learningand other disciplines' questions there are relative to the total amount of questions per time period.
Analysis Strategy
- We will change
CreationDateto string inyymmformat - Define a function
get_qtrwhich uses string functions to extract quarters from string in formatyyQn, wherenis the quarter number applyfunctionget_qtrtoCreationDateand convert it toyyQnformatgroupbyyyQnand aggregate count for all disciplinesai,dmandstat- Plot results
# change "CreationDate" to string
aq_ts = aq
aq_ts["qtr"] = aq_ts["CreationDate"].astype(str).str[2:7].str.replace('-','')
aq_ts.drop(labels="CreationDate", axis=1, inplace=True)
aq_ts=aq_ts.sort_values(by='qtr', ascending=True)
print(aq_ts.head())
      Id                                               Tags  dm  stat  ai  \
496  134  {apache-hadoop, scalability, mongodb, map-reduce}   0     0   1
81    69                                       {processing}   0     0   0
80    61            {machine-learning, predictive-modeling}   0     0   0
79    59                                 {apache-hadoop, r}   0     0   0
78    52                                 {r, data-cleaning}   0     0   0

      qtr
496  1405
81   1405
80   1405
79   1405
78   1405
# Define function get_qtr
""" extracts quarters from yymm"""
def get_qtr(string):
    year = int(string[0:2])*100
    month = int(string)-year
    qtr = int(((month)-1)/3)+1
    return '{y}Q{q}'.format(y=string[0:2], q=qtr)
# apply 'get_qtr' to 'aq_ts["qtr"]'
aq_ts["qtr"] = aq_ts["qtr"].apply(get_qtr)
print(aq_ts.tail())
          Id                                               Tags  dm  stat  ai  \
21229  66591                     {optimization, neural-network}   0     0   0
21228  66590                        {visualization, r, ggplot2}   0     0   0
21227  66588                              {markov-hidden-model}   0     0   0
21240  66619  {scikit-learn, python, dataset, linear-regress...   0     0   0
21195  66530                                           {pandas}   0     0   0

        qtr
21229  20Q1
21228  20Q1
21227  20Q1
21240  20Q1
21195  20Q1
import numpy as np
aq_ts_pt = aq_ts.pivot_table(values = ["ai","dm","stat"], index = "qtr", aggfunc=(np.sum))
print(aq_ts_pt)
       ai   dm  stat
qtr
14Q2   51   11    20
14Q3   34   11     9
14Q4   28    9     6
15Q1   26   16     6
15Q2   57   24    12
15Q3   48   17    16
15Q4   73   23    13
16Q1  120   42    21
16Q2  132   47    19
16Q3  125   41    32
16Q4  124   43    33
17Q1  167   85    33
17Q2  168   63    39
17Q3  171   79    28
17Q4  235   89    42
18Q1  334  166    43
18Q2  402  178    83
18Q3  423  182    63
18Q4  368  155    62
19Q1  606  262   100
19Q2  770  329   119
19Q3  750  315   102
19Q4  722  323    88
20Q1  155   63    18
aq_ts_pt.drop(labels="20Q1", inplace=True)
# Comparative Time Series Curves for "all disciplines"

fig, axes = plt.subplots()
fig.set_size_inches((14, 6))
#log scaling on x axis due to very large numbers
aq_ts_pt["ai"].plot(kind="line", c='orange', subplots=True, label="ai", legend=True)
aq_ts_pt["dm"].plot(kind="line", c='green', subplots=True, label="dm", legend=True)
aq_ts_pt["stat"].plot(kind="line", subplots=True, label="stat", legend=True)
array([<matplotlib.axes._subplots.AxesSubplot object at 0x7f17f31edeb8>],
      dtype=object)

# Plotting Time Series: "AI Growth"

fig, axes = plt.subplots()
fig.set_size_inches((14, 6))
plt.ylim(0, 800)

aq_ts_pt["ai"].plot(kind="bar", subplots=True, label="ai", legend=True, title = "AI Growth - Time Series")
aq_ts_pt["ai"].plot(kind="line", c='orange', subplots=True, label="dm", legend=True)
array([<matplotlib.axes._subplots.AxesSubplot object at 0x7f17e6042c88>],
      dtype=object)

# Plotting Time Series: "DM Growth"

fig, axes = plt.subplots()
fig.set_size_inches((14, 6))
plt.ylim(0, 800)
aq_ts_pt["dm"].plot(kind="bar", color='orange', subplots=True, label="dm", legend=True, title = "DM Growth - Time Series")
aq_ts_pt["dm"].plot(kind="line", color='blue', subplots=True, label="dm", legend=True)
array([<matplotlib.axes._subplots.AxesSubplot object at 0x7f17e61ea780>],
      dtype=object)

# Plotting Time Series: "Stat Growth"

fig, axes = plt.subplots()
fig.set_size_inches((14, 6))
plt.ylim(0, 800)
aq_ts_pt["stat"].plot(kind="bar", color='red', subplots=True, label="dm", legend=True, title = "Stat Growth - Time Series")
aq_ts_pt["stat"].plot(kind="line", color='green', subplots=True, label="dm", legend=True)
array([<matplotlib.axes._subplots.AxesSubplot object at 0x7f17e5e78da0>],
      dtype=object)

Recommendations
It is clear from above that the AI subfields including
deep-learningand to an extentdata-managementsubfields have shown marked growth since 4th quarter of 2018. Perhaps, this is indicative of the interest in the field in general. A major AI disciplinemaths-statisticshas not registered much interset despite being a major requirement for data analysis. Perhaps, it is due to requirement of STEM education in this field.Our content, for present, should be focused on
deep-learninganddata-management.