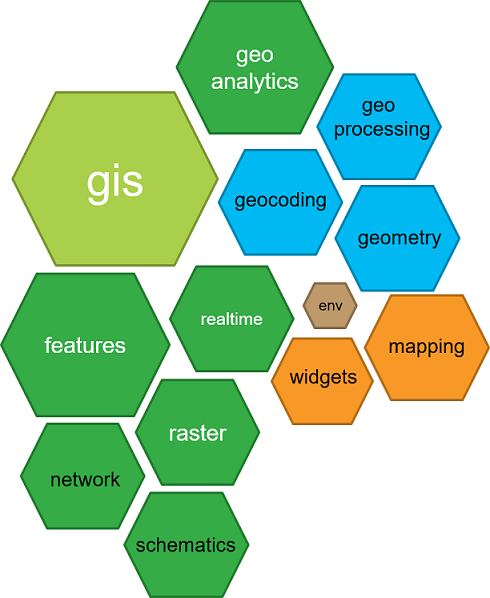
ArcGIS API for Python

ArcGIS + Jupyter = ❤

It all starts with your GIS
In [1]:
from arcgis.gis import GIS
In [2]:
gis = GIS('https://deldev.maps.arcgis.com', 'demo_deldev', 'P@ssword123')
In [3]:
enterprise = GIS('https://python.playground.esri.com/portal', 'arcgis_python', 'amazing_arcgis_123')
Search for content
In [4]:
items = gis.content.search('San Diego')
In [5]:
for item in items:
    display(item)


Visualize layers on map widget
In [7]:
sdmap = gis.map('San Diego', zoomlevel=14)
sdmap
In [8]:
sdmap.add_layer(sd_attractions)
In [9]:
sdmap.add_layer(trolley_stations)

Which attractions are near trolley stations?
In [11]:
from arcgis.features.use_proximity import create_buffers
from arcgis.features.manage_data import overlay_layers
In [12]:
places_to_see = overlay_layers(input_layer=sd_attractions,
                               overlay_layer=create_buffers(trolley_stations,
                                                        [0.5], units='Miles'))
In [13]:
my_map = gis.map('San Diego', zoomlevel=14)
display(my_map)
my_map.add_layer(places_to_see)
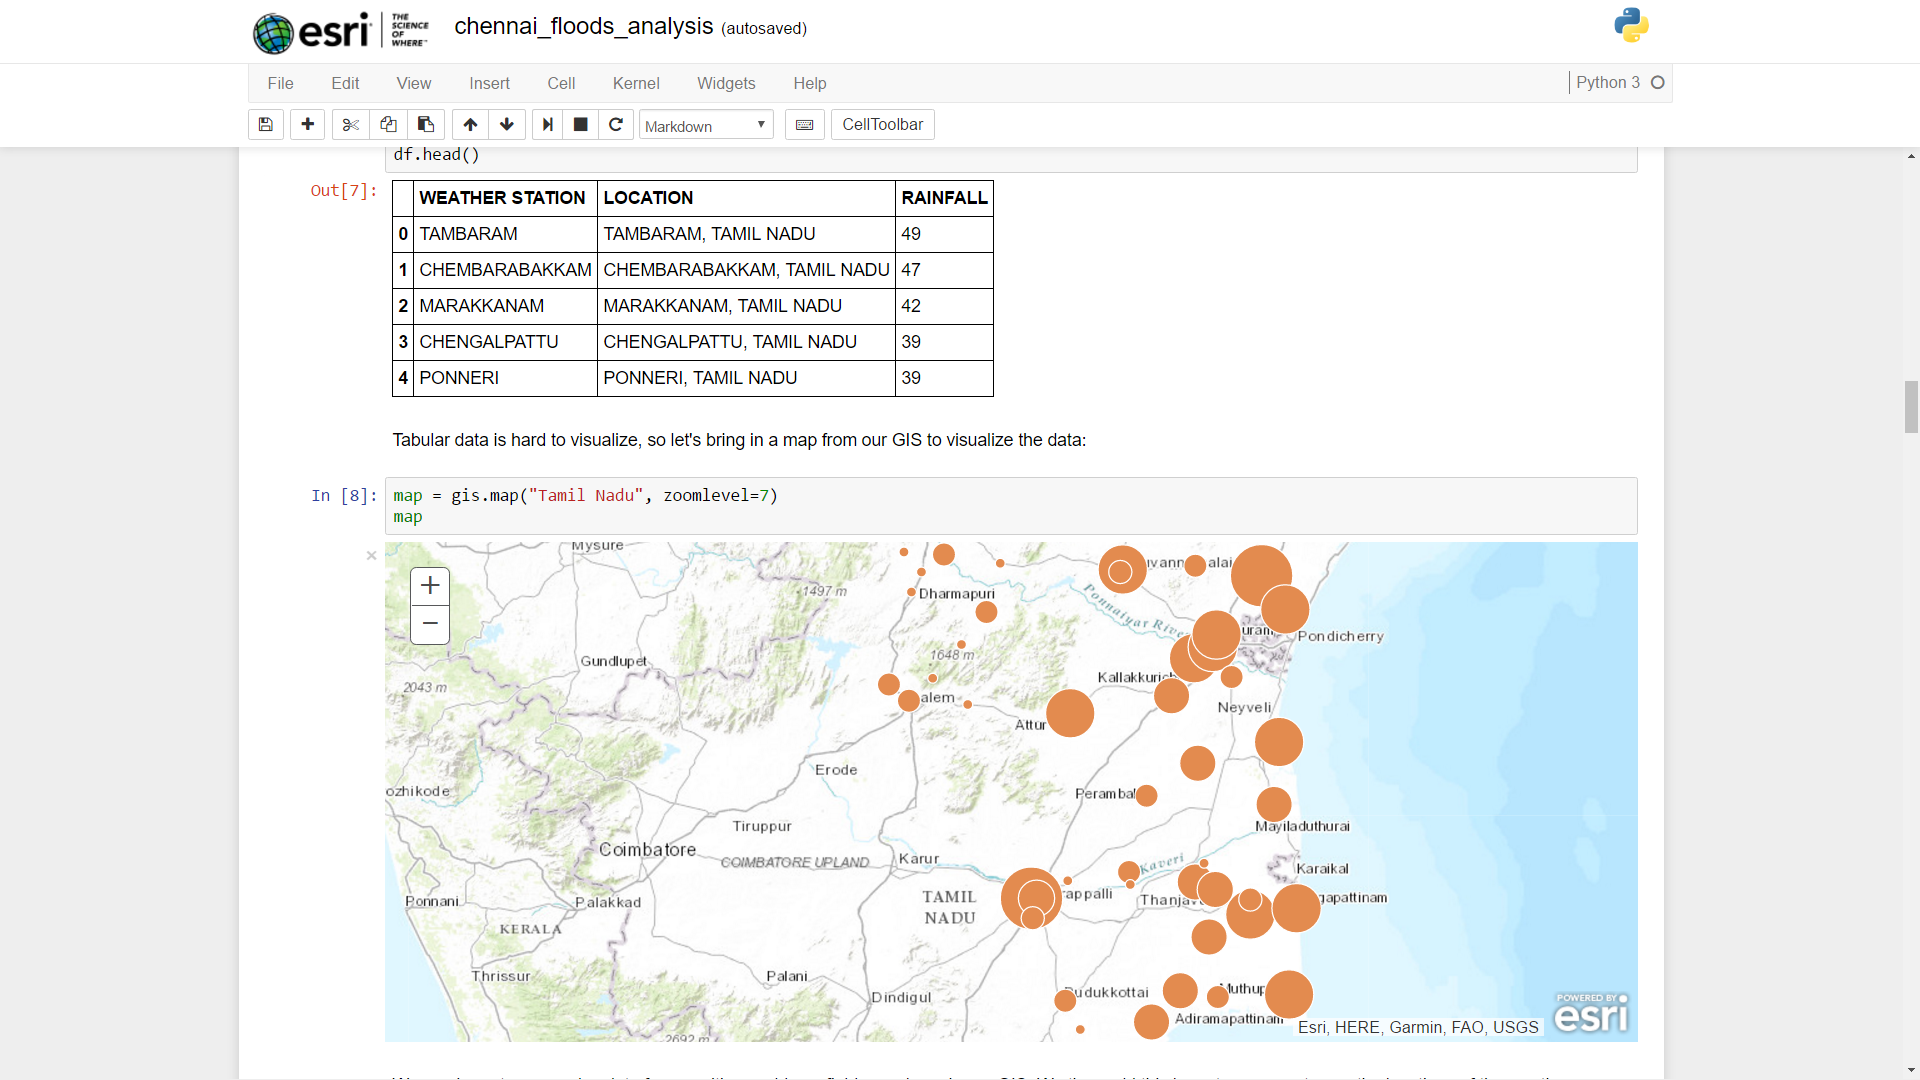
Analysis results as a table
In [14]:
df = places_to_see.query().df
df = df[['NAME', 'Title']]
df
Out[14]:
| NAME | Title | |
|---|---|---|
| 0 | Welcome to San Diego! | COUNTY CENTER/LITTLE ITALY TROLLEY STATION |
| 1 | Welcome to San Diego! | CIVIC CENTER TROLLEY STATION |
| 2 | Welcome to San Diego! | FIFTH AVENUE TROLLEY STATION |
| 3 | Welcome to San Diego! | AMERICA PLAZA TROLLEY STATION |
| 4 | Welcome to San Diego! | SANTA FE DEPOT |
| 5 | Welcome to San Diego! | SEAPORT VILLAGE TROLLEY STATION |
| 6 | Gaslamp Quarter | 12TH AND MARKET TROLLEY STATION |
| 7 | Convention Center skywalk and stairs | CONVENTION CENTER TROLLEY STATION |
| 8 | Convention Center skywalk and stairs | GASLAMP QUARTER TROLLEY STATION |
| 9 | Gaslamp Quarter | 12TH AND IMPERIAL TRANSIT CENTER |
| 10 | Gaslamp Quarter | 12TH AND IMPERIAL TRANSIT CENTER |
| 11 | Old Town San Diego State Historic Park | OLD TOWN TRANSIT CENTER |
Feature data and analysis
In [15]:
counties_item = gis.content.search('USA Counties', 'Feature Layer',
                                   outside_org=True)[5]
counties_item
Out[15]:

In [16]:
counties = counties_item.layers[0]
In [17]:
ca_counties = counties.query(where="STATE_NAME='California'")
Spatial dataframe
In [18]:
counties_df = ca_counties.df
counties_df
Out[18]:
| AGE_10_14 | AGE_15_19 | AGE_20_24 | AGE_25_34 | AGE_35_44 | AGE_45_54 | AGE_55_64 | AGE_5_9 | AGE_65_74 | AGE_75_84 | ... | POP10_SQMI | POP12_SQMI | POP2010 | POP2012 | RENTER_OCC | SQMI | STATE_NAME | VACANT | WHITE | SHAPE | |
|---|---|---|---|---|---|---|---|---|---|---|---|---|---|---|---|---|---|---|---|---|---|
| 0 | 68473 | 72493 | 65339 | 122046 | 108500 | 108479 | 77285 | 68694 | 43502 | 23473 | ... | 102.9 | 104.282870 | 839631 | 851089 | 101782 | 8161.35 | California | 29757 | 499766 | {'rings': [[[-13119789.4732166, 4272899.442060... |
| 1 | 11324 | 11356 | 13158 | 25589 | 21878 | 20282 | 12924 | 11564 | 6844 | 3809 | ... | 109.9 | 111.427421 | 152982 | 155039 | 18904 | 1391.39 | California | 2634 | 83027 | {'rings': [[[-13342775.4280577, 4356085.351079... |
| 2 | 3888 | 4190 | 3362 | 6603 | 7095 | 10255 | 10625 | 3574 | 6553 | 3502 | ... | 48.6 | 49.082334 | 64665 | 65253 | 9076 | 1329.46 | California | 8944 | 52033 | {'rings': [[[-13667224.3154792, 4696180.986610... |
| 3 | 1853 | 2107 | 2831 | 6337 | 5513 | 5447 | 4113 | 1595 | 1984 | 1041 | ... | 7.4 | 7.422856 | 34895 | 35039 | 3468 | 4720.42 | California | 2652 | 25532 | {'rings': [[[-13418482.3589672, 5039533.376017... |
| 4 | 678845 | 753630 | 752788 | 1475731 | 1430326 | 1368947 | 1013156 | 633690 | 568470 | 345603 | ... | 2402.3 | 2423.264150 | 9818605 | 9904341 | 1696455 | 4087.19 | California | 203872 | 4936599 | {'rings': [[[-13149469.25, 3995666.625], [-131... |
| 5 | 11755 | 12224 | 11032 | 20562 | 19167 | 19291 | 15833 | 11756 | 9868 | 5468 | ... | 70.1 | 71.065672 | 150865 | 153025 | 15591 | 2153.29 | California | 5823 | 94456 | {'rings': [[[-13337486.1875, 4418437.5625], [-... |
| 6 | 14241 | 12798 | 10308 | 24836 | 36478 | 42055 | 40088 | 15481 | 23211 | 12425 | ... | 480.2 | 486.100489 | 252409 | 255509 | 38573 | 525.63 | California | 8004 | 201963 | {'rings': [[[-13691681.78125, 4611910], [-1369... |
| 7 | 987 | 1026 | 827 | 1651 | 1828 | 3232 | 3283 | 821 | 2253 | 1186 | ... | 12.5 | 12.613887 | 18251 | 18455 | 2466 | 1463.07 | California | 2495 | 16103 | {'rings': [[[-13364133.625, 4464660.5], [-1336... |
| 8 | 5390 | 5613 | 4874 | 10704 | 10268 | 12476 | 14417 | 5259 | 7556 | 3983 | ... | 25.0 | 25.083070 | 87841 | 88094 | 14344 | 3512.09 | California | 5378 | 67218 | {'rings': [[[-13752510.6332503, 4689126.202854... |
| 9 | 22115 | 24451 | 20195 | 35060 | 31967 | 31007 | 22645 | 22167 | 13205 | 7717 | ... | 129.4 | 129.897434 | 255793 | 256841 | 34446 | 1977.26 | California | 8056 | 148381 | {'rings': [[[-13401606.6535612, 4527640.672262... |
| 10 | 602 | 604 | 422 | 904 | 1062 | 1444 | 1634 | 564 | 1108 | 570 | ... | 2.3 | 2.329272 | 9686 | 9791 | 1278 | 4203.46 | California | 1128 | 8084 | {'rings': [[[-13502305.9151577, 5160605.154186... |
| 11 | 770 | 820 | 1118 | 2253 | 1909 | 2342 | 1892 | 828 | 922 | 376 | ... | 4.5 | 4.604771 | 14202 | 14418 | 2540 | 3131.10 | California | 8144 | 11697 | {'rings': [[[-13305023.4194887, 4674333.605046... |
| 12 | 29037 | 32624 | 32481 | 62077 | 54820 | 53254 | 43218 | 30577 | 22921 | 14744 | ... | 125.2 | 126.859300 | 415057 | 420465 | 61869 | 3314.42 | California | 13102 | 230717 | {'rings': [[[-13520087.6809747, 4283419.790017... |
| 13 | 9040 | 9473 | 8289 | 16755 | 17851 | 19932 | 17843 | 8576 | 10522 | 6576 | ... | 173.1 | 172.308609 | 136484 | 135855 | 18279 | 788.44 | California | 5883 | 97525 | {'rings': [[[-13620149.8647747, 4698245.425388... |
| 14 | 5798 | 6091 | 4439 | 9654 | 10485 | 15826 | 17982 | 4950 | 10598 | 5817 | ... | 101.3 | 102.564339 | 98764 | 99951 | 11637 | 974.52 | California | 11063 | 90233 | {'rings': [[[-13430887.9145485, 4796964.419990... |
| 15 | 210195 | 227689 | 213601 | 413528 | 439043 | 444185 | 321854 | 198769 | 187454 | 112703 | ... | 3767.3 | 3822.423158 | 3010232 | 3054269 | 404468 | 799.04 | California | 56126 | 1830758 | {'rings': [[[-13102225.2452518, 3956360.076072... |
| 16 | 24986 | 24298 | 17936 | 39173 | 46565 | 53339 | 44118 | 23604 | 28990 | 17318 | ... | 232.0 | 237.083491 | 348432 | 356116 | 38404 | 1502.07 | California | 20021 | 290977 | {'rings': [[[-13476451.8800501, 4701753.649061... |
| 17 | 1022 | 1293 | 930 | 1698 | 1908 | 3226 | 3925 | 968 | 2534 | 1196 | ... | 7.7 | 7.653217 | 20007 | 20000 | 2742 | 2613.28 | California | 6589 | 17797 | {'rings': [[[-13508234.9379716, 4931510.762992... |
| 18 | 177644 | 187125 | 154572 | 282429 | 293305 | 292738 | 213739 | 167065 | 140598 | 85796 | ... | 299.8 | 305.044946 | 2189641 | 2227789 | 224048 | 7303.15 | California | 114447 | 1335147 | {'rings': [[[-12741132.318736, 4039524.4052527... |
| 19 | 99820 | 105680 | 101908 | 206646 | 190835 | 200536 | 155637 | 98112 | 83295 | 52193 | ... | 1427.5 | 1441.219615 | 1418788 | 1432457 | 218463 | 993.92 | California | 41987 | 815151 | {'rings': [[[-13527725.8606631, 4683984.725626... |
| 20 | 4709 | 4534 | 3507 | 6931 | 7621 | 8249 | 5940 | 4326 | 2978 | 1684 | ... | 39.7 | 40.634754 | 55269 | 56501 | 5878 | 1390.46 | California | 1065 | 35181 | {'rings': [[[-13519779.8682629, 4437538.523669... |
| 21 | 168792 | 179627 | 159908 | 282091 | 272949 | 277294 | 197043 | 157368 | 103495 | 56979 | ... | 101.2 | 102.560224 | 2035210 | 2062041 | 228045 | 20105.66 | California | 88019 | 1153161 | {'rings': [[[-12873899.6217711, 4274386.336024... |
| 22 | 198716 | 225095 | 270750 | 470922 | 420563 | 430774 | 329616 | 194029 | 180554 | 116911 | ... | 730.6 | 740.583699 | 3095313 | 3137431 | 495840 | 4236.43 | California | 77921 | 1981442 | {'rings': [[[-13049824.1875, 3866990.3125], [-... |
| 23 | 26299 | 34606 | 60618 | 168120 | 133682 | 111807 | 96596 | 28462 | 54322 | 38029 | ... | 16995.3 | 17398.353736 | 805235 | 824334 | 222165 | 47.38 | California | 31131 | 390387 | {'rings': [[[-13692698.0128538, 4536182.208346... |
| 24 | 56165 | 58382 | 48451 | 90815 | 90738 | 91839 | 68697 | 54810 | 38530 | 22709 | ... | 480.4 | 482.643869 | 685306 | 688477 | 87737 | 1426.47 | California | 18748 | 349287 | {'rings': [[[-13461587.15625, 4542560.5], [-13... |
| 25 | 14201 | 21727 | 27342 | 32108 | 29752 | 39253 | 37116 | 13773 | 21187 | 13531 | ... | 81.2 | 81.815416 | 269637 | 271619 | 41096 | 3319.90 | California | 15299 | 222756 | {'rings': [[[-13391141.9702506, 4153438.912972... |
| 26 | 42463 | 41249 | 40098 | 99334 | 108100 | 110669 | 89187 | 44729 | 49985 | 30973 | ... | 1573.2 | 1591.217045 | 718451 | 726677 | 104727 | 456.68 | California | 13194 | 383535 | {'rings': [[[-13618773.8429706, 4454508.553190... |
| 27 | 26626 | 38009 | 43026 | 57692 | 50478 | 54998 | 45015 | 26303 | 26776 | 18532 | ... | 154.1 | 154.042992 | 423895 | 423800 | 67277 | 2751.18 | California | 10730 | 295124 | {'rings': [[[-13252178.8386541, 3957202.320497... |
| 28 | 113570 | 114544 | 113117 | 269566 | 278369 | 263594 | 185546 | 121928 | 106521 | 62948 | ... | 1372.2 | 1401.071327 | 1781642 | 1819137 | 255906 | 1298.39 | California | 27716 | 836616 | {'rings': [[[-13539883.40625, 4506615.125], [-... |
| 29 | 15347 | 21834 | 24391 | 33749 | 33075 | 38777 | 35935 | 15071 | 15874 | 8668 | ... | 587.3 | 587.522944 | 262382 | 262470 | 40126 | 446.74 | California | 10121 | 190208 | {'rings': [[[-13605624.0035457, 4469113.194639... |
| 30 | 11394 | 12439 | 11003 | 19957 | 19567 | 26585 | 25506 | 10537 | 16551 | 9446 | ... | 46.1 | 46.480517 | 177223 | 178831 | 25069 | 3847.44 | California | 6967 | 153726 | {'rings': [[[-13601584.4375, 4921950.875], [-1... |
| 31 | 156 | 170 | 118 | 243 | 335 | 571 | 693 | 131 | 396 | 207 | ... | 3.4 | 3.353291 | 3240 | 3226 | 417 | 962.04 | California | 846 | 3022 | {'rings': [[[-13454256.3396814, 4832637.658362... |
| 32 | 2726 | 2757 | 2178 | 4277 | 4536 | 6910 | 7851 | 2410 | 4941 | 2689 | ... | 7.1 | 7.120891 | 44900 | 45200 | 6876 | 6347.52 | California | 4405 | 38030 | {'rings': [[[-13622860.3990647, 5162398.136903... |
| 33 | 28575 | 30484 | 28761 | 54914 | 54423 | 63950 | 51227 | 27311 | 25997 | 14838 | ... | 464.6 | 470.005058 | 413344 | 418187 | 52110 | 889.75 | California | 10940 | 210751 | {'rings': [[[-13568166.783698, 4655864.8583804... |
| 34 | 91070 | 100394 | 107049 | 228204 | 227491 | 222617 | 173502 | 94546 | 90437 | 52576 | ... | 2029.8 | 2062.402226 | 1510271 | 1534551 | 253896 | 744.06 | California | 37411 | 649122 | {'rings': [[[-13608423.59375, 4548229.5625], [... |
| 35 | 69 | 55 | 51 | 97 | 136 | 215 | 235 | 80 | 109 | 51 | ... | 1.6 | 1.543841 | 1175 | 1148 | 140 | 743.60 | California | 1263 | 881 | {'rings': [[[-13347105.1792653, 4711608.303495... |
| 36 | 29724 | 33298 | 32068 | 61297 | 60603 | 73518 | 68544 | 29263 | 35544 | 20614 | ... | 304.3 | 306.323820 | 483878 | 487061 | 73545 | 1590.02 | California | 18747 | 371412 | {'rings': [[[-13737803, 4672279], [-13737811.4... |
| 37 | 1881 | 2288 | 1648 | 3640 | 4518 | 6369 | 6796 | 1655 | 4455 | 2408 | ... | 62.9 | 63.288340 | 38091 | 38354 | 3686 | 606.02 | California | 3463 | 33149 | {'rings': [[[-13366995.6593785, 4680079.753190... |
| 38 | 41276 | 42807 | 37119 | 70194 | 66726 | 69558 | 52150 | 40013 | 29637 | 17785 | ... | 339.8 | 342.538842 | 514453 | 518549 | 65816 | 1513.84 | California | 14323 | 337342 | {'rings': [[[-13489390.53125, 4536971.875], [-... |
| 39 | 7146 | 7377 | 6286 | 12666 | 11980 | 12742 | 10105 | 7292 | 6490 | 3979 | ... | 155.7 | 157.125955 | 94737 | 95619 | 12225 | 608.55 | California | 2421 | 57749 | {'rings': [[[-13573190.9740771, 4740208.361085... |
| 40 | 12911 | 17841 | 22818 | 26681 | 23329 | 28877 | 28878 | 12439 | 17185 | 10962 | ... | 131.2 | 132.554757 | 220000 | 222350 | 36627 | 1677.42 | California | 8217 | 180096 | {'rings': [[[-13575499.4019644, 4825046.454825... |
| 41 | 2770 | 2893 | 1883 | 3608 | 4605 | 7565 | 8458 | 2239 | 5809 | 2784 | ... | 44.0 | 44.582939 | 45578 | 46212 | 4366 | 1036.54 | California | 9039 | 40522 | {'rings': [[[-13404519.90625, 4591131.28125], ... |
| 42 | 4431 | 4654 | 3656 | 7088 | 7316 | 9254 | 8258 | 4326 | 5720 | 3172 | ... | 21.4 | 21.523312 | 63463 | 63757 | 8404 | 2962.23 | California | 3220 | 51721 | {'rings': [[[-13598808.5625, 4923627.96875], [... |
| 43 | 1692 | 1773 | 1287 | 2780 | 2678 | 2767 | 2373 | 1733 | 1367 | 779 | ... | 18.5 | 18.833988 | 21419 | 21780 | 2738 | 1156.42 | California | 827 | 13854 | {'rings': [[[-13617316.5625, 4710753.59375], [... |
| 44 | 744 | 789 | 544 | 1271 | 1388 | 2326 | 2697 | 640 | 1674 | 837 | ... | 4.3 | 4.384289 | 13786 | 14063 | 1799 | 3207.59 | California | 2598 | 12033 | {'rings': [[[-13759504.3858904, 4996203.383529... |
| 45 | 38926 | 39043 | 32457 | 61859 | 54685 | 52351 | 40055 | 39950 | 22946 | 13474 | ... | 91.4 | 92.738012 | 442179 | 448724 | 53766 | 4838.62 | California | 11344 | 265618 | {'rings': [[[-13188692.1133358, 4403600.328655... |
| 46 | 74444 | 73766 | 59943 | 129643 | 148650 | 164080 | 128758 | 72285 | 70719 | 40347 | ... | 1380.9 | 1405.326067 | 1049025 | 1067570 | 123460 | 759.66 | California | 24899 | 614512 | {'rings': [[[-13573493.2050787, 4540676.361888... |
| 47 | 1718 | 1870 | 1799 | 4081 | 3832 | 4450 | 3717 | 1567 | 2153 | 1263 | ... | 28.2 | 28.298164 | 28610 | 28685 | 3793 | 1013.67 | California | 1279 | 21098 | {'rings': [[[-13813084.6919465, 5088634.913516... |
| 48 | 2920 | 3210 | 2951 | 6077 | 6018 | 8597 | 9469 | 2501 | 6187 | 3632 | ... | 24.3 | 24.304973 | 55365 | 55331 | 6685 | 2276.53 | California | 9088 | 48274 | {'rings': [[[-13428800.9375, 4559816.375], [-1... |
| 49 | 60390 | 64407 | 56183 | 105460 | 111083 | 123704 | 93476 | 56970 | 51396 | 30870 | ... | 443.4 | 444.788666 | 823318 | 825977 | 92752 | 1857.01 | California | 14775 | 565804 | {'rings': [[[-13306531.4673448, 3933240.934103... |
| 50 | 12506 | 12522 | 8958 | 17244 | 22203 | 32346 | 28116 | 11126 | 15437 | 7969 | ... | 101.4 | 102.156840 | 181058 | 182494 | 18832 | 1786.41 | California | 17936 | 156793 | {'rings': [[[-13425879.1875, 4650646.21875], [... |
| 51 | 12693 | 19318 | 27185 | 28168 | 23913 | 24830 | 20159 | 12235 | 10570 | 6227 | ... | 196.3 | 199.657989 | 200849 | 204322 | 33456 | 1023.36 | California | 4182 | 126883 | {'rings': [[[-13582749.7458224, 4711061.496504... |
| 52 | 75409 | 81306 | 75290 | 132729 | 114369 | 115052 | 88854 | 75040 | 49499 | 30304 | ... | 154.8 | 157.172588 | 930450 | 944788 | 130700 | 6011.15 | California | 26140 | 515145 | {'rings': [[[-13342158.5, 4418469.5625], [-133... |
| 53 | 2227 | 2156 | 1770 | 3510 | 3343 | 3835 | 3251 | 2115 | 2046 | 1185 | ... | 21.2 | 21.488749 | 28122 | 28516 | 3700 | 1327.02 | California | 978 | 19990 | {'rings': [[[-13575499.4019644, 4825046.454825... |
| 54 | 5547 | 5466 | 5395 | 10413 | 8875 | 9548 | 7567 | 5872 | 4181 | 2311 | ... | 112.1 | 113.153192 | 72155 | 72822 | 9839 | 643.57 | California | 3328 | 49332 | {'rings': [[[-13471845.3690452, 4805888.527145... |
| 55 | 7242 | 9531 | 11878 | 19995 | 15068 | 18749 | 19373 | 7324 | 9671 | 5489 | ... | 37.6 | 38.062105 | 134623 | 136375 | 25211 | 3582.96 | California | 5528 | 109920 | {'rings': [[[-13849505.9835925, 4929991.129878... |
| 56 | 14536 | 15047 | 13188 | 24197 | 22941 | 22497 | 16603 | 13841 | 9791 | 6356 | ... | 38.9 | 39.744560 | 174528 | 178091 | 21661 | 4480.89 | California | 6941 | 102553 | {'rings': [[[-12773677.4661567, 3953028.899364... |
| 57 | 1134 | 1087 | 865 | 2020 | 1969 | 2961 | 2920 | 985 | 1818 | 1196 | ... | 1.8 | 1.819773 | 18546 | 18611 | 2928 | 10227.10 | California | 1429 | 13741 | {'rings': [[[-13126868.6074171, 4504168.346584... |
58 rows × 52 columns
Pandorable (attribute and spatial) selections
In [19]:
sd_county = counties_df[counties_df.NAME == 'San Diego']
In [20]:
# Attribute query
sd_county.POP2012.iloc[0]
Out[20]:
3137431
In [21]:
# query the shape of San Diego county and set it's spatial reference
sd_geom = sd_county.SHAPE.iloc[0]
sd_geom.spatial_reference = counties.container.properties.spatialReference
In [22]:
m = gis.map('San Diego', zoomlevel=7)
m.draw(sd_geom)
m
Exploratory data analysis
In [23]:
%matplotlib inline
plotdf = counties_df.set_index('NAME')
plotdf.POP2012.plot(kind='bar', x='NAME', figsize=(15,5))
Out[23]:
<matplotlib.axes._subplots.AxesSubplot at 0x1a0896806a0>

Smart Mapping
In [24]:
ca_map = gis.map("California")
ca_map
In [25]:
ca_map.add_layer(counties, {
                             "definition_expression": "STATE_NAME='California'",
                             "renderer": "ClassedColorRenderer",
                             "field_name": "POP2012"
                            })
Big-data analysis (GeoAnalytics)

Analyse crimes in Houston, TX

Attach data
In [27]:
datastores = arcgis.geoanalytics.get_datastores()
datastores.add_bigdata('Houston_crime_yearly',
                       r'\\teton\atma_shared\datasets\HoustonCrime')
Big Data file share exists for Houston_crime_yearly
Out[27]:
<Datastore title:"/bigDataFileShares/Houston_crime_yearly" type:"bigDataFileShare">
In [28]:
houston_yearly = houston_gis.content.search('Houston_crime_yearly',
                                            'big data file share')[0]
houston_yearly
Out[28]:

In [30]:
houston_yearly.layers
Out[30]:
[<Layer url:"https://dev003247.esri.com/gax/rest/services/DataStoreCatalogs/bigDataFileShares_Houston_crime_yearly/BigDataCatalogServer/houstoncrime2010">,
 <Layer url:"https://dev003247.esri.com/gax/rest/services/DataStoreCatalogs/bigDataFileShares_Houston_crime_yearly/BigDataCatalogServer/houstoncrime2011">,
 <Layer url:"https://dev003247.esri.com/gax/rest/services/DataStoreCatalogs/bigDataFileShares_Houston_crime_yearly/BigDataCatalogServer/houstoncrime2012">,
 <Layer url:"https://dev003247.esri.com/gax/rest/services/DataStoreCatalogs/bigDataFileShares_Houston_crime_yearly/BigDataCatalogServer/houstoncrime2013">,
 <Layer url:"https://dev003247.esri.com/gax/rest/services/DataStoreCatalogs/bigDataFileShares_Houston_crime_yearly/BigDataCatalogServer/houstoncrime2014">,
 <Layer url:"https://dev003247.esri.com/gax/rest/services/DataStoreCatalogs/bigDataFileShares_Houston_crime_yearly/BigDataCatalogServer/houstoncrime2015">,
 <Layer url:"https://dev003247.esri.com/gax/rest/services/DataStoreCatalogs/bigDataFileShares_Houston_crime_yearly/BigDataCatalogServer/houstoncrime2016">]
Invoke batch analytics
In [ ]:
for category in df.Category.unique()[:-1]:
    lyrid = 0
    for year in range(2010, 2017):
        output_name='Houston_' + category.replace(' ', '_') + '_Hotspot_' + str(year)
        print('Generating ' + output_name)
        layer = houston_yearly.layers[lyrid]
        layer.filter = "Category='{}'".format(category)

        find_hot_spots(layer, bin_size=0.5, bin_size_unit='Miles',
                       neighborhood_distance=1, neighborhood_distance_unit='Miles',
                       output_name=output_name)

        lyrid = lyrid + 1
In [34]:
display(HBox([hotmap1, hotmap2]))
display(HBox(children=[Button(description='Burglary hot spots in 2016', layout=items_layout, button_style='danger'),
                       Button(description='Auto theft hot spots in 2016', layout=items_layout, button_style='danger')],
             layout=Layout(width='100%')))
Compare Hot Spots over time
In [36]:
for year in range(2014, 2017):
    layer = houston_gis.content.search('Houston_Auto_Theft_Hotspot_' + str(year))[0]
    hotspotmap = houston_gis.map(houston)
    hotspotmap.add_layer(layer)
    hotspotmap.layout=Layout(flex='1 1', padding='3px')
    maps.append(hotspotmap)
    hotspotmap.basemap='gray'
    labels.append(Button(description='Auto theft hot spots in ' + str(year),
                         layout=items_layout, button_style='danger'))

display(HBox([maps[0], maps[1], maps[2]], layout=layout))
display(HBox(children=labels, layout=Layout(width='100%')))
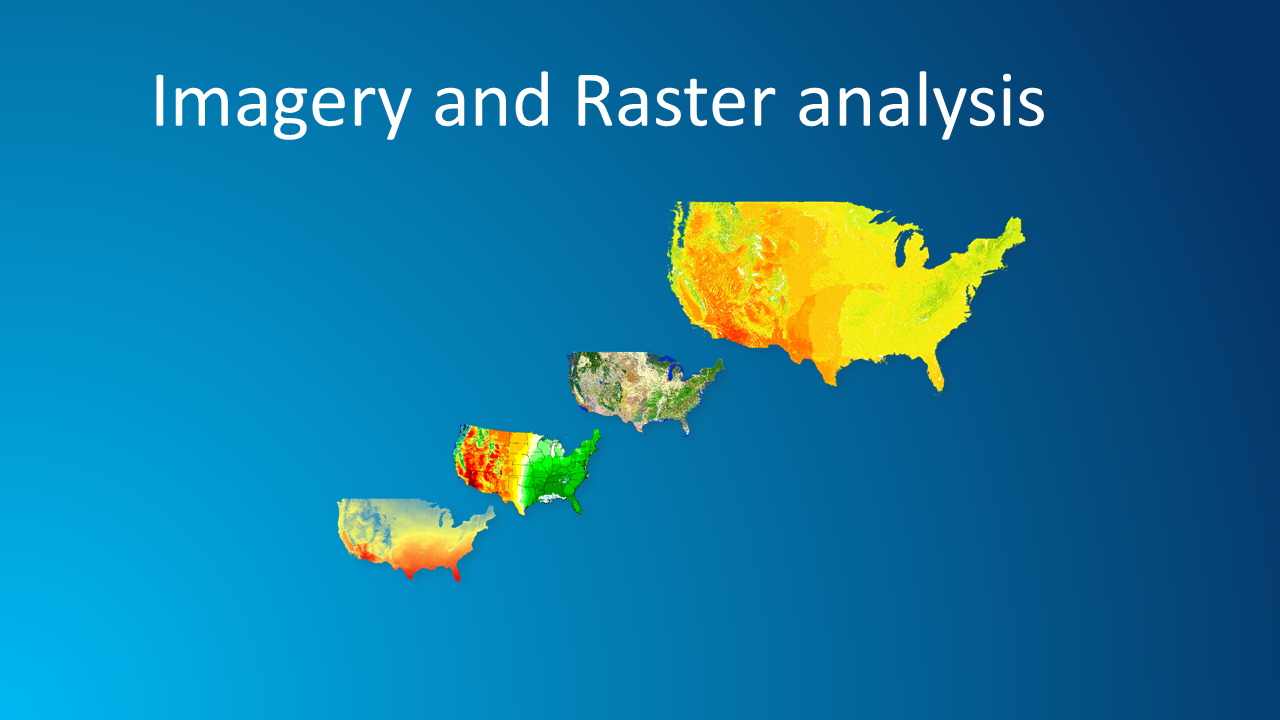
Use Landsat Imagery
In [37]:
landsat_item = gis.content.search('"Landsat Multispectral"',
                                  'Imagery Layer', outside_org=True)[0]
In [38]:
landsat_item
Out[38]:

In [39]:
landsat = landsat_item.layers[0]
Visualize imagery layers
In [40]:
imagery_map = gis.map('San Diego, CA', zoomlevel=12)
imagery_map.add_layer(landsat)
imagery_map
Code: Plot spectral profile at clicked location
In [41]:
import pandas as pd
pd.DataFrame(landsat.key_properties()['BandProperties'])
Out[41]:
| BandIndex | BandName | DatasetTag | WavelengthMax | WavelengthMin | |
|---|---|---|---|---|---|
| 0 | 0 | CoastalAerosol | MS | 450 | 430 |
| 1 | 1 | Blue | MS | 510 | 450 |
| 2 | 2 | Green | MS | 590 | 530 |
| 3 | 3 | Red | MS | 670 | 640 |
| 4 | 4 | NearInfrared | MS | 880 | 850 |
| 5 | 5 | ShortWaveInfrared_1 | MS | 1650 | 1570 |
| 6 | 6 | ShortWaveInfrared_2 | MS | 2290 | 2110 |
| 7 | 7 | Cirrus | MS | 1380 | 1360 |
In [42]:
from bokeh.models import Range1d
from bokeh.plotting import figure, show, output_notebook
from IPython.display import clear_output

output_notebook()

def handle_click(m, pt):
    m.draw(pt)

    samples = landsat.get_samples(pt, pixel_size=30)
    values = samples[0]['value']

    x = ['1','2', '3', '4', '5', '6', '7', '8']
    y = [float(int(s)/100000) for s in values.split(' ')]

    p = figure(title="Spectral Profile", x_axis_label='Spectral Bands',
               y_axis_label='Data Values', width=600, height=300)
    p.line(x, y, legend="Selected Point", line_color="red", line_width=2)
    p.circle(x, y, line_color="red", fill_color="white", size=8)
    p.set(y_range=Range1d(0, 1.0))

    clear_output()
    show(p)
In [43]:
click_map = gis.map('San Diego, CA', zoomlevel=12)
click_map.add_layer(landsat)
click_map.on_click(handle_click)
Demo: Plot spectral profile at clicked location
In [44]:
click_map
Dynamic raster processing
In [45]:
dynamic_map = gis.map('San Diego, CA', zoomlevel=12)
dynamic_map.add_layer(landsat)
dynamic_map
In [111]:
for rasterfunc in landsat.properties.rasterFunctionInfos:
    clear_output()
    print(rasterfunc.name)

    dynamic_map.add_layer(apply(landsat, rasterfunc.name))
    time.sleep(2)
None
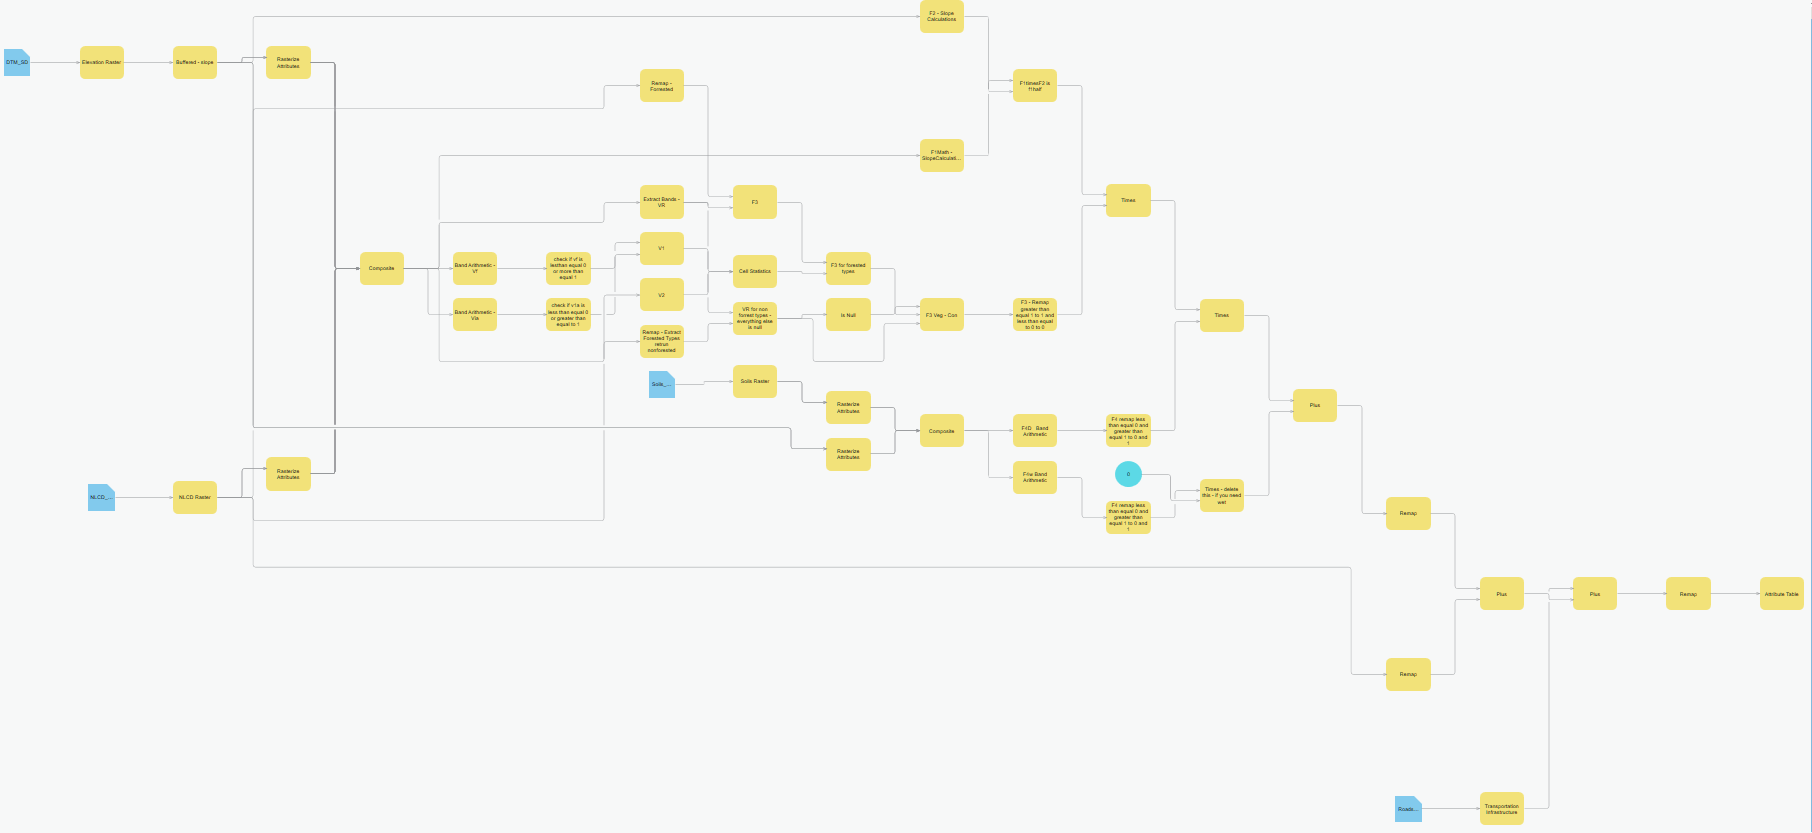
Custom raster processing using Raster Functions
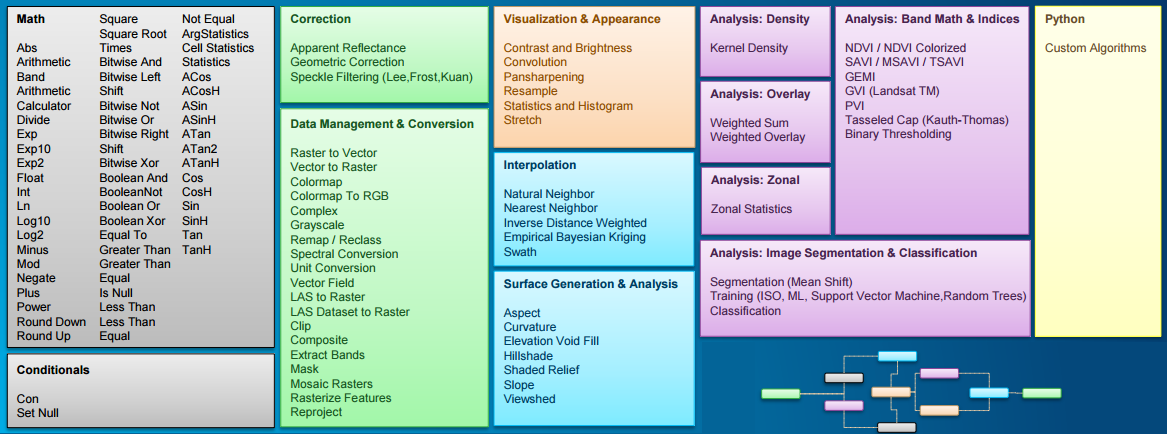
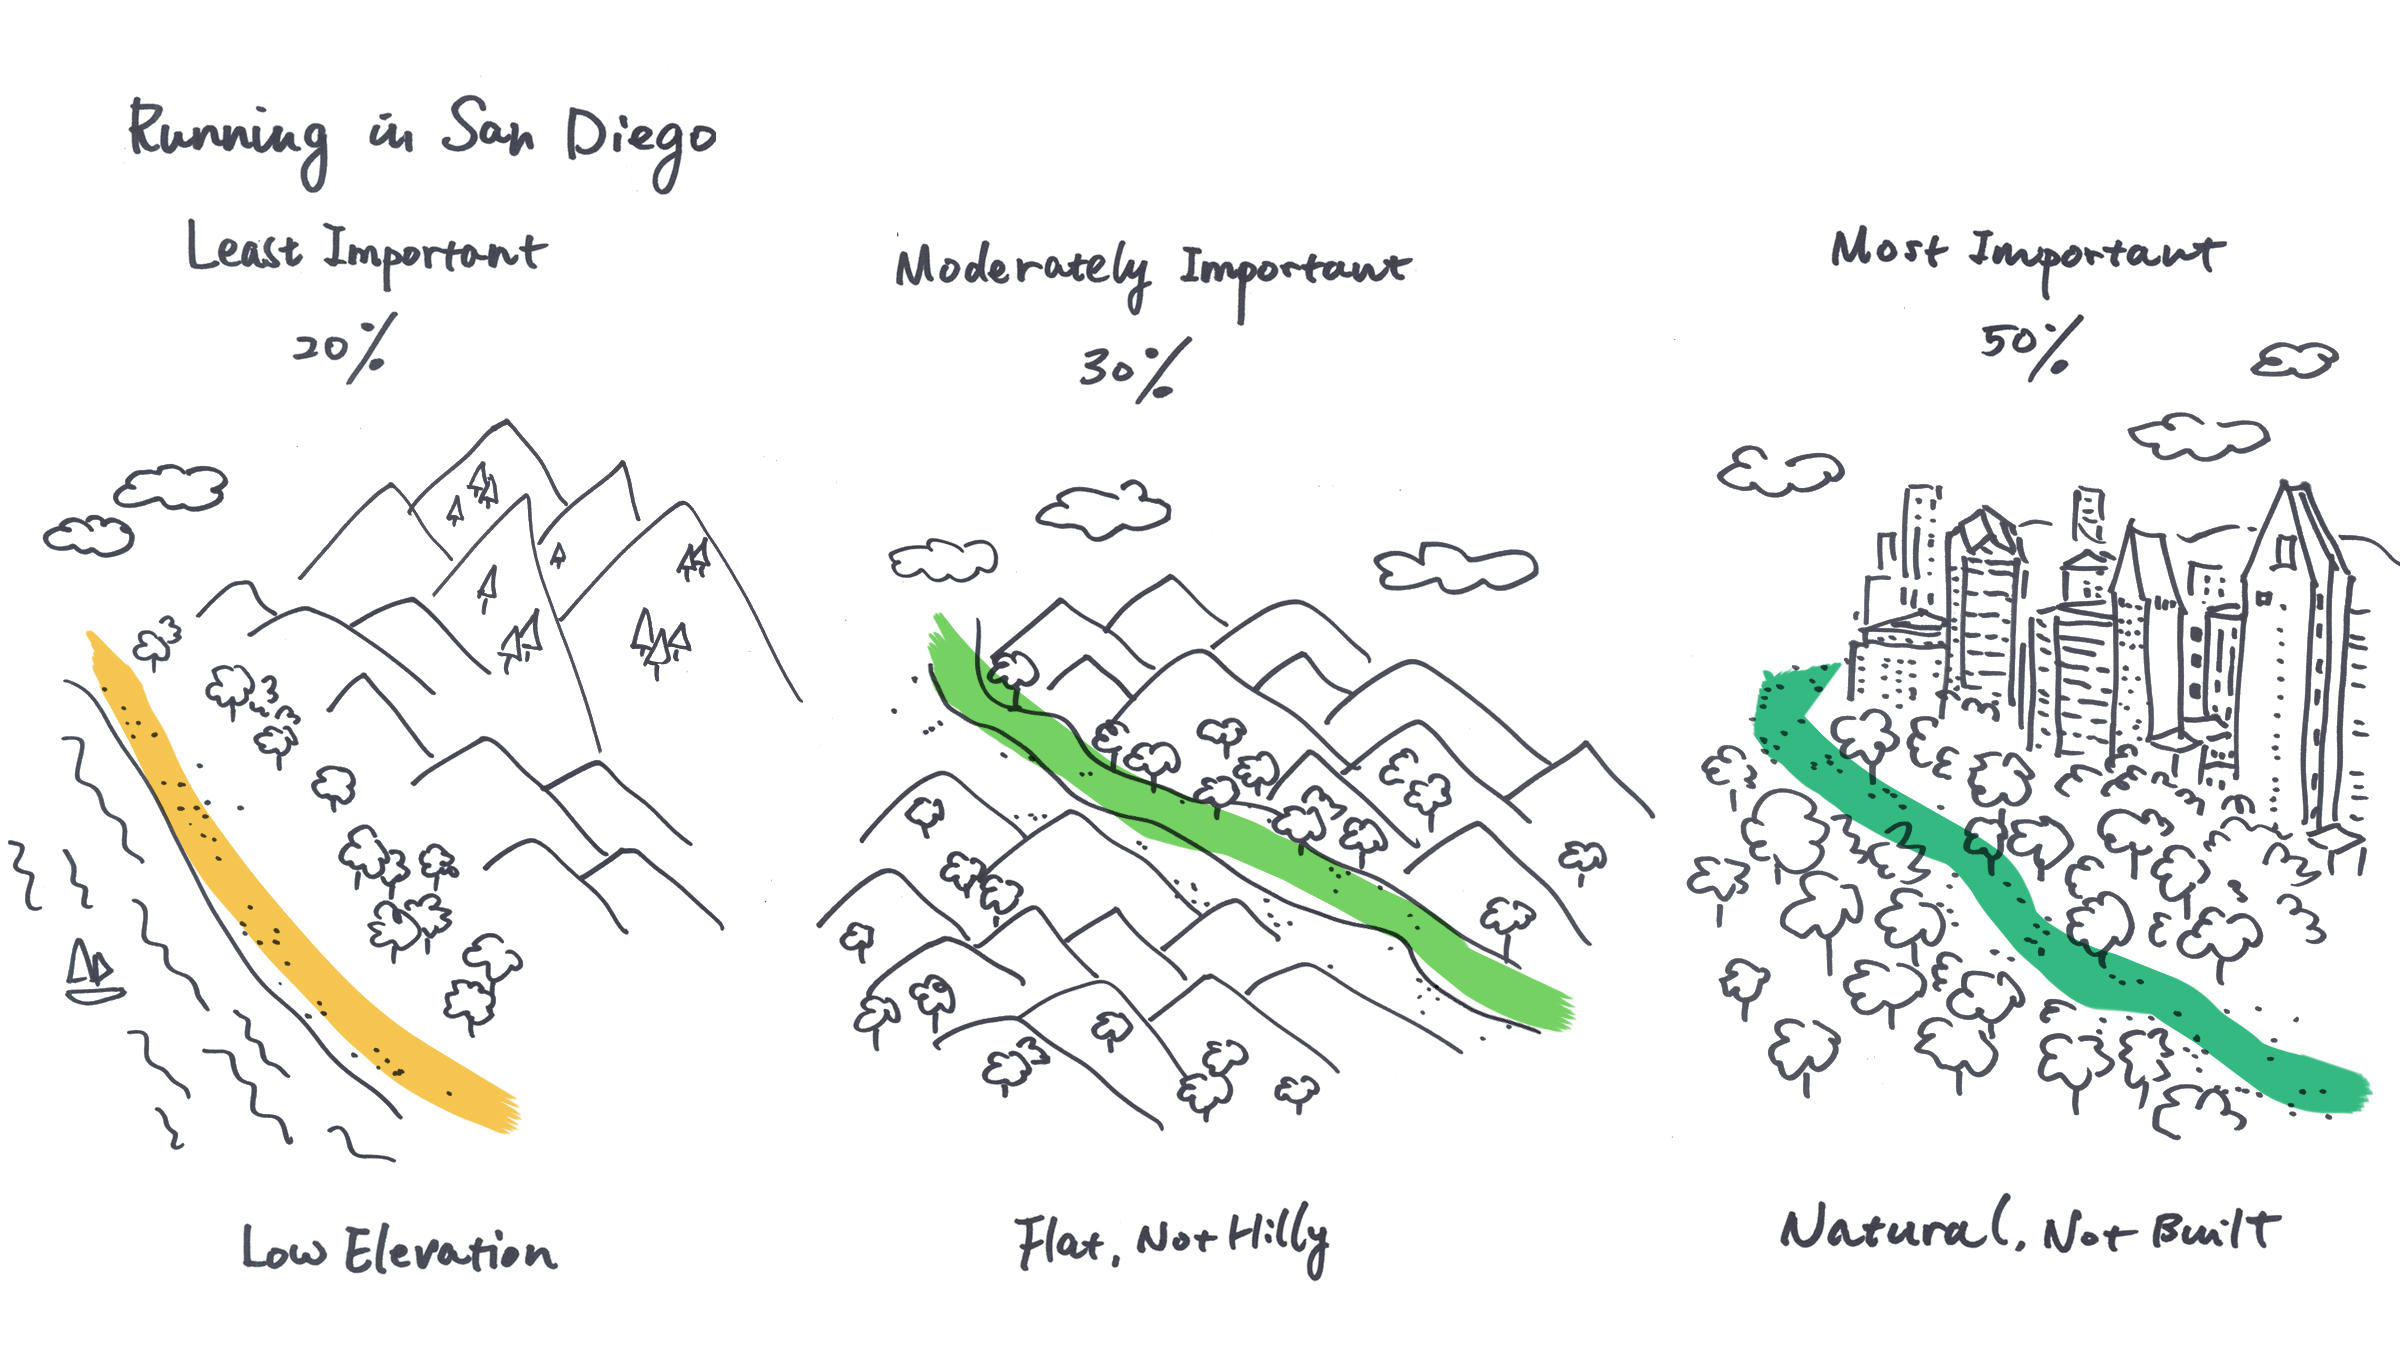
Function chain for weighted overlay analysis

In [48]:
# Digital elevation model for the US

item_dem = enterprise.content.search('elevation_270m')[0]
lyr_dem = item_dem.layers[0]
lyr_dem
Out[48]:

Human modified index
In [49]:
# Human Modified Index imagery layer
# This dataset is based on research on the degree of human modification to
# the landscape, on a scale of 0 - 1, where 0.0 indicates unmodified natural
# landscape and 1.0 indicates the landscape is completely modified by human activity.

item_hmi = enterprise.content.search('human_modification_index')[0]
lyr_hmi = item_hmi.layers[0]
lyr_hmi
Out[49]:

Interactive raster processing in Jupyter Notebook
In [52]:
clipped_elev = clip(lyr_dem, sd_geom)
clipped_elev
Out[52]:

Chaining raster functions
In [54]:
output_values = [1,2,3,4,5,6,7,8,9]

colormap(remap(slope(clipped_elev,
                     slope_type='DEGREE',
                     z_factor=1),
               input_ranges=[0,1, 1,2, 2,3, 3,5, 5,7, 7,9, 9,12, 12,15, 15,100],
               output_values=output_values),
         colormap=red_green)
Out[54]:

Prepare input layers
In [57]:
elevation = remap(lyr_dem,  # Elevation
                    [-90,250, 250,500, 500,750, 750,1000, 1000,1500, 1500,2000, 2000,2500, 2500,3000, 3000,5000],
                    output_values)
In [58]:
natural_areas = remap(lyr_hmi, # Human Modified Index
                     [0.0,0.1, 0.1,0.2, 0.2,0.3, 0.3,0.4, 0.4,0.5,0.5,0.6, 0.6,0.7, 0.7,0.8, 0.8,1.1],
                     output_values)
In [59]:
terrain = remap(slope(lyr_dem, slope_type='DEGREE', z_factor=1), # Slope
                     [0,1, 1,2, 2,3, 3,5, 5,7, 7,9, 9,12, 12,15, 15,100],
                     output_values)
Map algebra for Weighted Overlay Analysis
In [60]:
# Map algebra for the web GIS!
result = 0.2*elevation + 0.3*terrain + 0.5*natural_areas
In [61]:
run_raster = colormap(clip(result, sd_geom), colormap=red_green)
run_raster
Out[61]:

Visualize results using map widget
In [62]:
surface_map = gis.map('San Diego, CA', zoomlevel=12)
surface_map.add_layer(run_raster)
surface_map
Persist results as an imagery layer
In [ ]:
# Generate a persistent result at source resolution using Raster Analytics
# resultlyr = weighted_overlay.save('SanDiego_PlacesToRun')
In [68]:
resultlyr
Out[68]:

In [81]:
with open("CCM_CostRnR.rft.xml", "r", encoding='utf-8-sig') as rft:
    raster_fn = rft.read()
In [ ]:
from arcgis.raster.analytics import generate_raster

surface = generate_raster(raster_fn, output_name='CCM_Cost_Surface')
In [ ]:
enterprise_b.content.search('CCM_Cost_Surface')
In [73]:
surface
Out[73]:


In [77]:
from arcgis.geoprocessing import import_toolbox

ccmurl='https://maps.esri.com/apl3/rest/services/LCP/LCP/GPServer/LeastCostPath'
ccm = import_toolbox(ccmurl)
In [78]:
def find_path(m, pt):
    m.draw(pt, symbol=finish_symbol)
    paths = ccm.least_cost_path(destination=FeatureSet([Feature(pt)]),
                                origins=origins)
    m.draw(paths)
Finding least cost paths interactively
In [112]:
ccm_map = gis.map('San Vicente Reservoir', zoomlevel=10)
ccm_map.on_click(find_path)
ccm_map
In [113]:
ramona = geocode("Ramona, CA")[0]
poway = geocode("Poway, CA")[0]
barona = geocode("Barona Reservation, CA")[0]

ccm_map.draw(ramona, symbol=tank_symbol)
ccm_map.draw(poway, symbol=tank_symbol)
ccm_map.draw(barona, symbol=tank_symbol)

In [66]:
landsat
Out[66]:

In [67]:
preprocessed = stretch(ndvi(landsat), stretch_type='PercentClip', min_percent=30, max_percent=70, dra=True)
preprocessed
Out[67]:

In [68]:
def count_farms():
    from skimage import feature, color
    import numpy as np
    from scipy.signal import convolve2d
    import matplotlib.pyplot as plt
    import matplotlib.image as mpimg

    img = preprocessed.export_image(size=[1200, 450],
        export_format='jpeg', save_folder='c:\\xc', save_file='saudiarabia.jpg', f='image')

    img = mpimg.imread('c:\\xc\\saudiarabia.jpg')

    bw = img.mean(axis=2)
    fig=plt.figure(figsize = (15,15))
    ax=fig.add_subplot(1,1,1)

    blobs_dog = [(x[0],x[1],x[2]) for x in feature.blob_dog(-bw,
                                                            min_sigma=4,
                                                            max_sigma=8,
                                                            threshold=0.1,
                                                            overlap=0.6)]

    blobs_dog = set(blobs_dog)

    img_blobs = color.gray2rgb(img)
    for blob in blobs_dog:
        y, x, r = blob
        c = plt.Circle((x, y), r+1, color='red', linewidth=2, fill=False)
        ax.add_patch(c)
    plt.imshow(img_blobs)
    plt.title('Center Pivot Farms')

    plt.show()
    print('Number of center pivot farms detected: ' + str(len(blobs_dog)))
In [69]:
count_farms()

Number of center pivot farms detected: 1002
In [71]:
from IPython.display import Image
In [89]:
img = r'C:\xc\Presentations\GeoPython\Watson\insulators\150362.JPG'
Image(img, width="600")
Out[89]:

Using IBM Watson Image Classifier
In [117]:
from watson_developer_cloud import VisualRecognitionV3

visual_recognition = VisualRecognitionV3('2016-05-20', api_key='f135ee67e833d45e90e2304608e0376b5a148688')

def is_broken(filepath):
    with open(filepath, 'rb') as images_file:
        car_results = visual_recognition.classify(images_file=images_file,
                                                  threshold=0.1,
                                                  classifier_ids=['BrokenInsulators'])
        print(car_results)
        classes = car_results['images'][0]['classifiers'][0]['classes']
        for cls in classes:
            if cls['class'] == 'broken':
                if float(cls['score']) > 0.5:
                    return True

        return False
In [115]:
get_location(img)
Out[115]:
(-123.05857389997222, 44.698829929999995)
In [118]:
is_broken(img)
{'images': [{'image': '', 'classifiers': [{'name': 'BrokenInsulators', 'classifier_id': 'BrokenInsulators_1382670166', 'classes': [{'score': 0.567984, 'class': 'broken'}]}]}], 'images_processed': 1, 'custom_classes': 1}
Out[118]:
True
Integration workflow
In [79]:
locations = []
path = r'C:\xc\Presentations\GeoPython\Watson\insulators'

# find locations of broken insulators
for file in listdir(path):
    filepath = path + '\\' + file
    if is_broken(filepath):
        locations.append(get_location(filepath))

# import into ArcGIS as a layer
df = pd.DataFrame.from_records(locations)
df.columns = ['x', 'y']
broken_insulators = gis.content.import_data(df)
In [106]:
# get layer of transmission towers
towers = gis.content.search('BPA_TransmissionStructures', 'Feature Layer', outside_org=True)[0]

# find transmission towers near image locations
destinations = join_features(towers, broken_insulators,
                             "withindistance", 0.1, "Miles")

# plan and sequence routes for maintenance
routes = plan_routes(destinations, 2, 15,
                     start_time, start_location, stop_service_time=30)
Input field [OID] was not mapped to a field in the network analysis class "Orders".
Input field [OID] was not mapped to a field in the network analysis class "Depots".
In [109]:
powermap = show_map()
In [110]:
powermap.basemap = 'dark-gray'

powermap.add_layer(broken_insulators)
powermap.add_layer(routes['routes_layer'])
powermap.add_layer(routes['assigned_stops_layer'])
In [114]:
powermap.zoom = 9
Try it out!
install: conda install -c esri arcgis
github repo: https://github.com/esri/arcgis-python-api
website: https://developers.arcgis.com/python
We're hiring :)