In [1]:
from preamble import *
%matplotlib inline
5. Model Evaluation and Improvement
In [2]:
from sklearn.datasets import make_blobs
from sklearn.linear_model import LogisticRegression
from sklearn.model_selection import train_test_split

# create a synthetic dataset
X, y = make_blobs(random_state=0)
print("X.shape:", X.shape)
print("y.shape:", y.shape)

# split data and labels into a training and a test set
X_train, X_test, y_train, y_test = train_test_split(X, y, random_state=0)

# instantiate a model and fit it to the training set
logreg = LogisticRegression().fit(X_train, y_train)

# evaluate the model on the test set
print("Test set score: {:.2f}".format(logreg.score(X_test, y_test)))
X.shape: (100, 2)
y.shape: (100,)
Test set score: 0.88
5.1 Cross-Validation
- 교차 검증
- 데이터를 여러 번 반복해서 나누어 모델 학습
- K-Fold cross-vailidation
- Fold: 원본 데이터에 대한 부분 집합
- K로는 5나 10을 주로 사용
- 첫번째 모델은 첫번째 fold를 테스트 데이터로 사용하고 나머지를 훈련 데이터로 사용
- 두번째 모델은 두번째 fold를 테스트 데이터로 사용하고 나머지를 훈련 데이터로 사용
- 세번째 모델은...
In [3]:
import matplotlib
print(matplotlib.__version__)

mglearn.plots.plot_cross_validation()
2.1.2

5.1.1 Cross-Validation in scikit-learn
- scikit-learn의 교차 검증
- model_selection.cross_val_score(estimator, X, y=None, cv=None) 함수 사용
- estimator
- estimator object implementing ‘fit’
- The object to use to fit the data.
- X
- The data to fit.
- y
- The target variable to try to predict in the case of supervised learning.
- cv
- K-Fold의 K값 (기본 값: 3)
- estimator
- model_selection.cross_val_score(estimator, X, y=None, cv=None) 함수 사용
In [4]:
from sklearn.model_selection import cross_val_score
from sklearn.datasets import load_iris
from sklearn.linear_model import LogisticRegression

iris = load_iris()
print("iris.data.shape:", iris.data.shape)
print("iris.target.shape:", iris.target.shape)

logreg = LogisticRegression()

scores = cross_val_score(logreg, iris.data, iris.target)
print("Cross-validation scores: {}".format(scores))
iris.data.shape: (150, 4)
iris.target.shape: (150,)
Cross-validation scores: [0.961 0.922 0.958]
In [5]:
scores = cross_val_score(logreg, iris.data, iris.target, cv=5)
print("Cross-validation scores: {}".format(scores))
Cross-validation scores: [1. 0.967 0.933 0.9 1. ]
- 교차 검증의 정확도: 각 교차 검증 정확도의 평균값 사용
In [6]:
print("Average cross-validation score: {:.2f}".format(scores.mean()))
Average cross-validation score: 0.96
5.1.2 Benefits of Cross-Validation
- 기존 train_test_split 방법만 사용하는 경우
- 확보한 원본 데이터 중 일부의 데이터는 훈련 데이터로 활용하지 않으면서 모델을 구성함.
- cross_val_score 함수를 사용하는 경우
- 데이터를 고르게 사용하여 fit을 하고 score를 구하기 때문에 모델의 성능을 좀 더 정확히 측정할 수 있음
- 새로은 테스트 데이터의 예측 정확도에 대하여 최악과 최선의 경우를 짐작할 수 있음
- [주의] cross_val_score가 직접 모델을 구성하는 방법은 아님!
- 즉, 이 함수를 호출하면 내부적으로 K번 모델을 구성하지만, 그러한 모델들은 평가의 목적으로만 활용됨.
5.1.3 Stratified K-Fold cross-validation and other strategies
- 계층별 K-Fold 교차 검증
- 각 Fold안의 클래스 비율이 전체 원본 데이터셋에 있는 클래스 비율과 동일하도록 맞춤
- 즉, 원본 데이터셋에서 클래스 A가 90%, 클래스 B가 10% 비율이라면, 계층별 K-Fold 교차 검증에서 각 K개의 Fold안에는 클래스 A가 90%, 클래스 B가 10% 비율이 됨.
- scikit-learn의 cross_val_score 기본 설정
- 분류모델: StratifiedKFold를 사용하여 기본적으로 계층별 K-Fold 교차 검증 수행
- 회귀모델: 단순한 KFold를 사용하여 계층별이 아닌 기본 K-Fold 교차 검증 수행
- 대신 회귀모델에서는 KFold를 사용할 때 shuffle 매개변수를 True로 지정하여 폴드를 나누기 전에 무작위로 데이터를 섞는 작업 추천
In [7]:
from sklearn.datasets import load_iris
iris = load_iris()
print("Iris labels:\n{}".format(iris.target))
Iris labels:
[0 0 0 0 0 0 0 0 0 0 0 0 0 0 0 0 0 0 0 0 0 0 0 0 0 0 0 0 0 0 0 0 0 0 0 0 0
 0 0 0 0 0 0 0 0 0 0 0 0 0 1 1 1 1 1 1 1 1 1 1 1 1 1 1 1 1 1 1 1 1 1 1 1 1
 1 1 1 1 1 1 1 1 1 1 1 1 1 1 1 1 1 1 1 1 1 1 1 1 1 1 2 2 2 2 2 2 2 2 2 2 2
 2 2 2 2 2 2 2 2 2 2 2 2 2 2 2 2 2 2 2 2 2 2 2 2 2 2 2 2 2 2 2 2 2 2 2 2 2
 2 2]
In [8]:
mglearn.plots.plot_stratified_cross_validation()

More control over cross-validation
- 기본적으로...
- 분류: StratifiedKFold가 사용됨
- 회귀: KFold가 사용됨
- 하지만, 때때로 분류에 KFold가 사용되어야 할 필요도 있음
- 다른 사람이 이미 수행한 사항을 재현해야 할 때
- StratifiedKFold가 아닌 KFold를 생성하여 cross_val_score()의 cv 인자에 할당
In [9]:
from sklearn.model_selection import KFold
kfold = KFold(n_splits=5) #교차 검증 분할기의 역할 수행
In [10]:
print("Cross-validation scores:\n{}".format(cross_val_score(logreg, iris.data, iris.target, cv=kfold)))
Cross-validation scores:
[1.    0.933 0.433 0.967 0.433]
- 이런 경우 3-Fold를 사용하면 데이터 타겟 레이블 분포 특성상 성능이 매우 나쁠 수 있음
In [11]:
kfold = KFold(n_splits=3)
print("Cross-validation scores:\n{}".format(cross_val_score(logreg, iris.data, iris.target, cv=kfold)))
Cross-validation scores:
[0. 0. 0.]
- 해결책
- KFold를 만들 때 shuffle=True를 통해 데이터를 임의로 섞음.
- random_state=0을 주면 추후 그대로 재현이 가능
In [12]:
kfold = KFold(n_splits=3, shuffle=True, random_state=0)
print("Cross-validation scores:\n{}".format(cross_val_score(logreg, iris.data, iris.target, cv=kfold)))
Cross-validation scores:
[0.9  0.96 0.96]
Leave-one-out cross-validation (LOOCV)
- Fold 하나에 하나의 샘플이 들어 있는 Stratified k-Fold 교차 검증
- 즉, 각각의 반복에서 테스트 데이터에 하나의 샘플만 존재
- 데이터셋이 클 때 시간이 매우 오래 걸림
- 작은 데이터셋에 대해서는 일반적인 상황에 대한 거의 확실한 score 값을 얻을 수 있음.
In [13]:
from sklearn.model_selection import LeaveOneOut
loo = LeaveOneOut()
scores = cross_val_score(logreg, iris.data, iris.target, cv=loo)
print("Number of cv iterations: ", len(scores))
print("Mean accuracy: {:.2f}".format(scores.mean()))
Number of cv iterations:  150
Mean accuracy: 0.95
Shuffle-split cross-validation
임의 분할 교차 검증
- model_selection.SuffleSplit(n_splits=10, test_size='default') or model_selection.StratifiedSuffleSplit(n_splits=10, test_size='default')
- n_splits: 10
- 분할의 개수
- test_size 만큼의 테스트 셋트를 만들도록 분할
- test_size의 기본값: 0.1
- n_splits: 10
- 보통 test_size 값만 설정하며, 추가적으로 train_size 도 설정 가능
- 이런 경우 전체 데이터 집합 중 일부만 훈련과 테스트에 사용할 수 있음
- 대규모 데이터에 유용
- test_size, train_size
- 정수: 데이터 포인트의 개수
- 실수: 데이터 포인트 비율
- model_selection.SuffleSplit(n_splits=10, test_size='default') or model_selection.StratifiedSuffleSplit(n_splits=10, test_size='default')
아래 그림 예제
- 전체 데이터 셈플 개수: 10
- train_size = 5
- test_size = 2
- n_splits = 4
In [14]:
mglearn.plots.plot_shuffle_split()

In [15]:
from sklearn.model_selection import ShuffleSplit

shuffle_split = ShuffleSplit(n_splits=10, test_size=.5, train_size=.5)
scores = cross_val_score(logreg, iris.data, iris.target, cv=shuffle_split)

print("Cross-validation scores:\n{}".format(scores))
print("Mean accuracy: {:.2f}".format(scores.mean()))
Cross-validation scores:
[1.    0.973 0.96  0.933 0.867 0.88  0.893 0.96  0.933 0.96 ]
Mean accuracy: 0.94
In [16]:
from sklearn.model_selection import StratifiedShuffleSplit

shuffle_split = StratifiedShuffleSplit(n_splits=10, test_size=.5, train_size=.5)
scores = cross_val_score(logreg, iris.data, iris.target, cv=shuffle_split)

print("Cross-validation scores:\n{}".format(scores))
print("Mean accuracy: {:.2f}".format(scores.mean()))
Cross-validation scores:
[0.973 0.947 0.933 0.947 0.96  0.96  0.92  0.96  0.933 1.   ]
Mean accuracy: 0.95
Cross-validation with groups
- 임의의 그룹에 속한 데이터 전체를 훈련 집합 또는 테스트 집합에 넣을 때 사용
- 테스트 데이터가 때때로 완전히 새로운 데이터가 되어야 할 필요 있음
- model_selection.GroupKFold
- 그룹핑을 통하여 훈련 데이터 셋트와 테스트 데이터 셋트를 완벽히 분리하기 위해 사용
- group 배열
- 각 데이터 포인트 별로 그룹 index 지정 필요
- 배열 내에 index 지정을 통해 훈련 데이터와 테스트 데이터를 랜덤하게 구성할 때 분리되지 말아야 할 그룹을 지정
- 타깃 레이블과 혼동하면 안됨
- 더 나은 방법
- 이 방법대신 model_selection.train_test_split을 통해 처음 부터 테스트 데이터를 미리 분리하는 것이 더 좋음.
In [17]:
mglearn.plots.plot_group_kfold()

In [18]:
from sklearn.model_selection import GroupKFold

# create synthetic dataset
X, y = make_blobs(n_samples=12, random_state=0)

# assume the first three samples belong to the same group,
# then the next four, etc
groups = [0, 0, 0, 1, 1, 1, 1, 2, 2, 3, 3, 3]
scores = cross_val_score(logreg, X, y, groups, cv=GroupKFold(n_splits=3))
print("Cross-validation scores:\n{}".format(scores))
print("Mean accuracy: {:.2f}".format(scores.mean()))
Cross-validation scores:
[0.75  0.8   0.667]
Mean accuracy: 0.74
5.2 Grid Search
- 모델 매개변수 튜닝을 통한 일반화 성능 개선
- 가장 널리 사용되는 방법은 Grid Search (그리드 탐색)
- 관심있는 매개변수들을 대상으로 모든 조합을 시도함.
5.2.1 Simple Grid-Search
- SVC 모델에서 가장 중요한 매개변수는 gamma, C
- 그리드 탐색 범위 설정 예
- gamma: [0.001, 0.01, 0.1, 1, 10, 100]
- C: [0.001, 0.01, 0.1, 1, 10, 100]
- 총 6x6=36개의 조합에 대하여 반복적으로 새로운 모델 생성 및 평가
- 가장 좋은 성능을 보여주는 gamma와 C의 조합을 찾음
| C=0.001 | C=0.01 | C=0.1 | C=1 | C=10 | C=100 | |
| gamma=0.001 | SVC(C=0.001, gamma=0.001) | SVC(C=0.01, gamma=0.001) | SVC(C=0.1, gamma=0.001) | SVC(C=1, gamma=0.001) | SVC(C=10, gamma=0.001) | SVC(C=100, gamma=0.001) |
| gamma=0.01 | SVC(C=0.001, gamma=0.01) | SVC(C=0.01, gamma=0.01) | SVC(C=0.1, gamma=0.01) | SVC(C=1, gamma=0.01) | SVC(C=10, gamma=0.01) | SVC(C=100, gamma=0.01) |
| gamma=0.1 | SVC(C=0.001, gamma=0.1) | SVC(C=0.01, gamma=0.1) | SVC(C=0.1, gamma=0.1) | SVC(C=1, gamma=0.1) | SVC(C=10, gamma=0.1) | SVC(C=100, gamma=0.1) |
| gamma=1 | SVC(C=0.001, gamma=1) | SVC(C=0.01, gamma=1) | SVC(C=0.1, gamma=1) | SVC(C=1, gamma=1) | SVC(C=10, gamma=1) | SVC(C=100, gamma=1) |
| gamma=10 | SVC(C=0.001, gamma=10) | SVC(C=0.01, gamma=10) | SVC(C=0.1, gamma=10) | SVC(C=1, gamma=10) | SVC(C=10, gamma=10) | SVC(C=100, gamma=10) |
| gamma=100 | SVC(C=0.001, gamma=100) | SVC(C=0.01, gamma=100) | SVC(C=0.1, gamma=100) | SVC(C=1, gamma=100) | SVC(C=10, gamma=100) | SVC(C=100, gamma=100) |
In [19]:
# naive grid search implementation
from sklearn.svm import SVC

X_train, X_test, y_train, y_test = train_test_split(iris.data, iris.target, random_state=0)
print("Size of training set: {}   size of test set: {}".format(X_train.shape[0], X_test.shape[0]))

best_score = 0

for gamma in [0.001, 0.01, 0.1, 1, 10, 100]:
    for C in [0.001, 0.01, 0.1, 1, 10, 100]:
        # for each combination of parameters, train an SVC
        svm = SVC(gamma=gamma, C=C)
        svm.fit(X_train, y_train)
        # evaluate the SVC on the test set
        score = svm.score(X_test, y_test)
        # if we got a better score, store the score and parameters
        if score > best_score:
            best_score = score
            best_parameters = {'C': C, 'gamma': gamma}

print("Best score: {:.2f}".format(best_score))
print("Best parameters: {}".format(best_parameters))
Size of training set: 112   size of test set: 38
Best score: 0.97
Best parameters: {'C': 100, 'gamma': 0.001}
- 위 0.97의 정확도는 전혀 새로운 데이터에 대한 성능으로 이어지지 않을 수 있다.
- 즉, 위 예제에서 사용한 테스트 데이터는 모델 구성시에 사용을 해버렸기 때문에 이 모델이 얼마나 좋은지 평가하는 데 더 이상 사용할 수 없다.
5.2.2 The danger of overfitting the parameters and the validation set
- 검증 데이터 세트 (Valudation Set) 필요
- 모델 파라미터 튜닝 용도
- 모델을 구성할 때 훈련 데이터 세트와 검증 데이터 세트를 활용
In [20]:
mglearn.plots.plot_threefold_split()

In [21]:
from sklearn.svm import SVC
# split data into train+validation set and test set
X_trainval, X_test, y_trainval, y_test = train_test_split(iris.data, iris.target, random_state=0)

# split train+validation set into training and validation sets
X_train, X_valid, y_train, y_valid = train_test_split(X_trainval, y_trainval, random_state=1)

print("Size of training set: {}, size of validation set: {},size of test set: {}\n".format(
    X_train.shape[0],
    X_valid.shape[0],
    X_test.shape[0]))

best_score = 0

for gamma in [0.001, 0.01, 0.1, 1, 10, 100]:
    for C in [0.001, 0.01, 0.1, 1, 10, 100]:
        # for each combination of parameters train an SVC
        svm = SVC(gamma=gamma, C=C)
        svm.fit(X_train, y_train)
        # evaluate the SVC on the validation set
        score = svm.score(X_valid, y_valid)
        # if we got a better score, store the score and parameters
        if score > best_score:
            best_score = score
            best_parameters = {'C': C, 'gamma': gamma}

# rebuild a model on the combined training and validation set,
# and evaluate it on the test set
svm = SVC(**best_parameters)

#[NOTE] 훈련 데이터와 검증 데이터를 합쳐서 다시 모델을 구성함
svm.fit(X_trainval, y_trainval)

test_score = svm.score(X_test, y_test)
print("Best score on validation set: {:.2f}".format(best_score))
print("Best parameters: ", best_parameters)
print("Test set score with best parameters: {:.2f}".format(test_score))
Size of training set: 84, size of validation set: 28,size of test set: 38

Best score on validation set: 0.96
Best parameters:  {'C': 10, 'gamma': 0.001}
Test set score with best parameters: 0.92
- 위 예제를 통하여 전혀 새로운 테스트 데이터에 대하여, 생성 모델은 92%의 정확도로 분류한다고 볼 수 있음
5.2.3 Grid-search with cross-validation
- 그리드 탐색에서도 교차 검증 필요
- 위 두 예제에서 최고의 성능을 보여주는 파라미터가 변경된 점을 주의
- cross_val_score 사용
In [22]:
X_trainval, X_test, y_trainval, y_test = train_test_split(iris.data, iris.target, random_state=0)
X_train, X_valid, y_train, y_valid = train_test_split(X_trainval, y_trainval, random_state=1)

print("Size of training set: {}, size of validation set: {},size of test set: {}\n".format(
    X_train.shape[0],
    X_valid.shape[0],
    X_test.shape[0]))

# reference: manual_grid_search_cv
for gamma in [0.001, 0.01, 0.1, 1, 10, 100]:
    for C in [0.001, 0.01, 0.1, 1, 10, 100]:
        # for each combination of parameters,
        # train an SVC
        svm = SVC(gamma=gamma, C=C)
        # perform cross-validation
        scores = cross_val_score(svm, X_trainval, y_trainval, cv=5)
        # compute mean cross-validation accuracy
        score = np.mean(scores)
        # if we got a better score, store the score and parameters
        if score > best_score:
            best_score = score
            best_parameters = {'C': C, 'gamma': gamma}
# rebuild a model on the combined training and validation set
svm = SVC(**best_parameters)

#[NOTE] 훈련 데이터와 검증 데이터를 합쳐서 다시 모델을 구성함
svm.fit(X_trainval, y_trainval)

test_score = svm.score(X_test, y_test)
print("Best score on validation set: {:.2f}".format(best_score))
print("Best parameters: ", best_parameters)
print("Test set score with best parameters: {:.2f}".format(test_score))
Size of training set: 84, size of validation set: 28,size of test set: 38

Best score on validation set: 0.97
Best parameters:  {'C': 100, 'gamma': 0.01}
Test set score with best parameters: 0.97
- 위 예에서는 반복적인 모델 생성 작업이 6 * 6 * 5 = 180번 이루어짐
- 즉, 시간이 많이 소요됨에 주의
- 아래 그림은 교차 검증에 5-fold 사용
- 매개변수 그리드는 일부만 표시
- 교차 검증 5번의 평균이 가장 높은 매개변수를 빨간 동그라미로 표시
In [23]:
mglearn.plots.plot_cross_val_selection()
/Users/yhhan/anaconda3/lib/python3.6/site-packages/sklearn/utils/deprecation.py:122: FutureWarning: You are accessing a training score ('mean_train_score'), which will not be available by default any more in 0.21. If you need training scores, please set return_train_score=True
  warnings.warn(*warn_args, **warn_kwargs)
/Users/yhhan/anaconda3/lib/python3.6/site-packages/sklearn/utils/deprecation.py:122: FutureWarning: You are accessing a training score ('split0_train_score'), which will not be available by default any more in 0.21. If you need training scores, please set return_train_score=True
  warnings.warn(*warn_args, **warn_kwargs)
/Users/yhhan/anaconda3/lib/python3.6/site-packages/sklearn/utils/deprecation.py:122: FutureWarning: You are accessing a training score ('split1_train_score'), which will not be available by default any more in 0.21. If you need training scores, please set return_train_score=True
  warnings.warn(*warn_args, **warn_kwargs)
/Users/yhhan/anaconda3/lib/python3.6/site-packages/sklearn/utils/deprecation.py:122: FutureWarning: You are accessing a training score ('split2_train_score'), which will not be available by default any more in 0.21. If you need training scores, please set return_train_score=True
  warnings.warn(*warn_args, **warn_kwargs)
/Users/yhhan/anaconda3/lib/python3.6/site-packages/sklearn/utils/deprecation.py:122: FutureWarning: You are accessing a training score ('split3_train_score'), which will not be available by default any more in 0.21. If you need training scores, please set return_train_score=True
  warnings.warn(*warn_args, **warn_kwargs)
/Users/yhhan/anaconda3/lib/python3.6/site-packages/sklearn/utils/deprecation.py:122: FutureWarning: You are accessing a training score ('split4_train_score'), which will not be available by default any more in 0.21. If you need training scores, please set return_train_score=True
  warnings.warn(*warn_args, **warn_kwargs)
/Users/yhhan/anaconda3/lib/python3.6/site-packages/sklearn/utils/deprecation.py:122: FutureWarning: You are accessing a training score ('std_train_score'), which will not be available by default any more in 0.21. If you need training scores, please set return_train_score=True
  warnings.warn(*warn_args, **warn_kwargs)

- 그리드 서치와 교차 검증을 사용한 매개 변수 선택과 모델 평가의 전체 작업 흐름
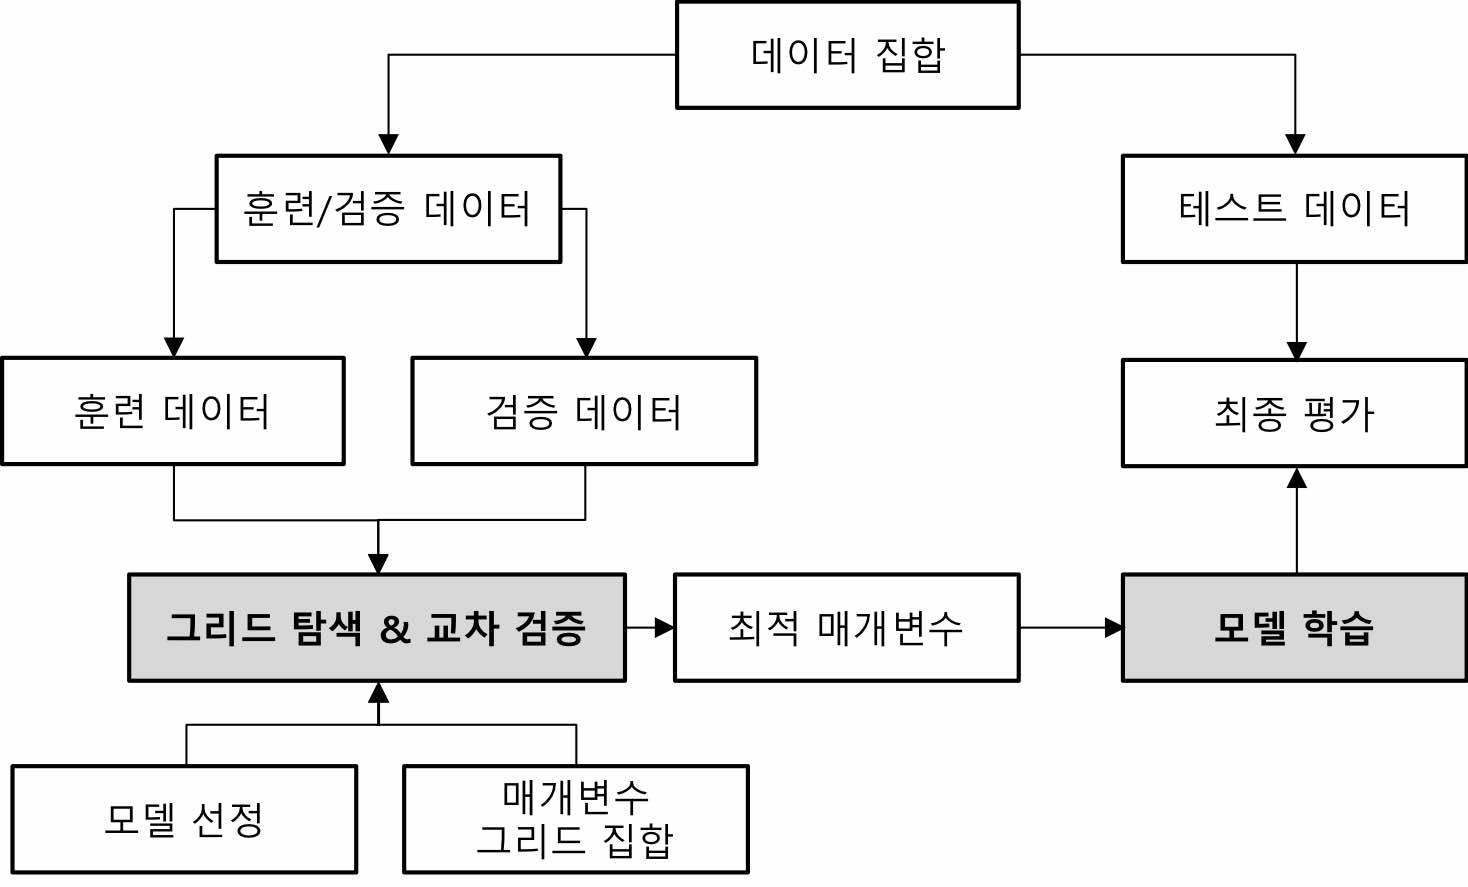
- model_selection.GridSearchCV
- 교차 검증을 사용하는 그리드 탐색을 통한 모델 파라미터 검색 기능 제공 객체
- 기본적으로 사용하는 교차 검증 분류기
- 분류에는 StratifiedKFold 사용함
- 회귀에는 KFold 사용함
- fit을 수행한 이후에는 가장 최적의 파라미터로 만들어진 모델을 구성하고 있음.
- 다른 estimator (or 모델)를 사용하여 만들어지는 estimator를 메타 추정기(meta-estimator)라고 함.
- GridSearchCV는 가장 널리 사용되는 메타 추정기
- scikit-learn에서는 MetaEstimatorMixin 클래스를 상속한 모델을 메타 추정기라고 부름
- 메타 추정기 예
- GridSearchCV
- RandomForest
- GradientBoosting
- RFE
- ...
- 우선 모델에 들어갈 각 매개변수 값을 사전(Dict)타입으로 구성
- 문자열 매개변수 이름을 모델(예:SVC)에 설정된 매개변수와 동일하게 맞춤
In [24]:
param_grid = {
    'C': [0.001, 0.01, 0.1, 1, 10, 100],
    'gamma': [0.001, 0.01, 0.1, 1, 10, 100]
}
print("Parameter grid:\n{}".format(param_grid))
Parameter grid:
{'C': [0.001, 0.01, 0.1, 1, 10, 100], 'gamma': [0.001, 0.01, 0.1, 1, 10, 100]}
- GridSearchCV 생성
- model_selection.GridSearchCV(estimator, param_grid, n_jobs=1, cv=None, verbose=0, return_train_score='True')
- estimator
- param_grid
- n_jobs
- Number of jobs to run in parallel
- default: 1
- -1 --> Using All threads
- cv
- None, to use the default 3-fold cross validation
- integer, to specify the number of folds in a (Stratified)KFold.
- fold의 개수를 cv=5와 같이 설정
- An object to be used as a cross-validation generator.
- An iterable yielding train, test splits.
- model_selection.GridSearchCV(estimator, param_grid, n_jobs=1, cv=None, verbose=0, return_train_score='True')
In [25]:
from sklearn.model_selection import GridSearchCV
from sklearn.svm import SVC

estimator = SVC()
grid_search = GridSearchCV(
    estimator = estimator,
    param_grid = param_grid,
    n_jobs = -1,
    cv = 5,
    return_train_score = True
)
- 훈련 데이터와 테스트 데이터 분리
In [26]:
X_train, X_test, y_train, y_test = train_test_split(iris.data, iris.target, random_state=0)
- 훈련 데이터만 GridSearchCV 객체에 넣어 fit을 함
- 이 때 훈련 데이터중 일부는 내부적으로 검증 데이터 (Validation Data)로 사용됨
- GridSearchCV는 생성시 모델을 내장하므로 fit, predict, score 등의 함수를 제공
- 모델에 따라서 predict_proba, decision_function을 제공하기도 함
In [27]:
grid_search.fit(X_train, y_train)
Out[27]:
GridSearchCV(cv=5, error_score='raise',
       estimator=SVC(C=1.0, cache_size=200, class_weight=None, coef0=0.0,
  decision_function_shape='ovr', degree=3, gamma='auto', kernel='rbf',
  max_iter=-1, probability=False, random_state=None, shrinking=True,
  tol=0.001, verbose=False),
       fit_params=None, iid=True, n_jobs=-1,
       param_grid={'C': [0.001, 0.01, 0.1, 1, 10, 100], 'gamma': [0.001, 0.01, 0.1, 1, 10, 100]},
       pre_dispatch='2*n_jobs', refit=True, return_train_score=True,
       scoring=None, verbose=0)
- 모델 구성시 사용하지 않은 완전히 새로운 데이터인 X_test와 y_test를 사용하여 모델 평가
In [28]:
print("Test set score: {:.2f}".format(grid_search.score(X_test, y_test)))
Test set score: 0.97
In [29]:
print("Best parameters: {}".format(grid_search.best_params_))
print("Best cross-validation score: {:.2f}".format(grid_search.best_score_))
Best parameters: {'C': 100, 'gamma': 0.01}
Best cross-validation score: 0.97
- 위 두 예에서 grid_search.score() 메소드와 grid_search.best_score_ 속성은 매우 큰 차이
- grid_search.score() 메소드
- 새로운 데이터인 테스트 데이터 셋을 통한 모델 평가 점수
- grid_search.best_score_ 속성
- 훈련 데이터에 대하여 수행한 교차 검증에서의 최고 점수
- grid_search.score() 메소드
In [30]:
print("Best estimator:\n{}".format(grid_search.best_estimator_))
Best estimator:
SVC(C=100, cache_size=200, class_weight=None, coef0=0.0,
  decision_function_shape='ovr', degree=3, gamma=0.01, kernel='rbf',
  max_iter=-1, probability=False, random_state=None, shrinking=True,
  tol=0.001, verbose=False)
[NOTE] 전형적인 교차 검증 그리드 서치를 통한 모델 구성 및 테스트 집합 성능 평가 코드
In [31]:
from sklearn.model_selection import GridSearchCV
from sklearn.svm import SVC

X_train, X_test, y_train, y_test = train_test_split(iris.data, iris.target, random_state=0)

estimator = SVC()

param_grid = {
    'C': [0.001, 0.01, 0.1, 1, 10, 100],
    'gamma': [0.001, 0.01, 0.1, 1, 10, 100]
}

grid_search = GridSearchCV(
    estimator = estimator,
    param_grid = param_grid,
    n_jobs = -1,
    cv = 5,
    return_train_score = True
)

grid_search.fit(X_train, y_train)

print("Test set score: {:.2f}".format(grid_search.score(X_test, y_test)))
Test set score: 0.97
Analyzing the result of cross-validation
- grid_search.cv_results_
- 그리드 탐색에 대한 교차 검증 결과 정보가 상세히 들어 있는 속성
In [32]:
import pandas as pd
# convert to Dataframe
results = pd.DataFrame(grid_search.cv_results_)
pd.options.display.float_format = '{:,.7f}'.format

print(results.columns)
# show the first 5 rows
# display(results.head(5))
display(results)
Index(['mean_fit_time', 'mean_score_time', 'mean_test_score',
       'mean_train_score', 'param_C', 'param_gamma', 'params',
       'rank_test_score', 'split0_test_score', 'split0_train_score',
       'split1_test_score', 'split1_train_score', 'split2_test_score',
       'split2_train_score', 'split3_test_score', 'split3_train_score',
       'split4_test_score', 'split4_train_score', 'std_fit_time',
       'std_score_time', 'std_test_score', 'std_train_score'],
      dtype='object')
| mean_fit_time | mean_score_time | mean_test_score | mean_train_score | ... | std_fit_time | std_score_time | std_test_score | std_train_score | |
|---|---|---|---|---|---|---|---|---|---|
| 0 | 0.0035735 | 0.0012889 | 0.3660714 | 0.3660787 | ... | 0.0010096 | 0.0004829 | 0.0113708 | 0.0028518 |
| 1 | 0.0013528 | 0.0004713 | 0.3660714 | 0.3660787 | ... | 0.0003804 | 0.0000942 | 0.0113708 | 0.0028518 |
| 2 | 0.0009893 | 0.0004484 | 0.3660714 | 0.3660787 | ... | 0.0002081 | 0.0001443 | 0.0113708 | 0.0028518 |
| 3 | 0.0014754 | 0.0005429 | 0.3660714 | 0.3660787 | ... | 0.0004951 | 0.0000276 | 0.0113708 | 0.0028518 |
| 4 | 0.0013918 | 0.0010472 | 0.3660714 | 0.3660787 | ... | 0.0004632 | 0.0009545 | 0.0113708 | 0.0028518 |
| 5 | 0.0045546 | 0.0012807 | 0.3660714 | 0.3660787 | ... | 0.0066814 | 0.0016633 | 0.0113708 | 0.0028518 |
| 6 | 0.0016893 | 0.0007505 | 0.3660714 | 0.3660787 | ... | 0.0013267 | 0.0006236 | 0.0113708 | 0.0028518 |
| 7 | 0.0013759 | 0.0005324 | 0.3660714 | 0.3660787 | ... | 0.0006139 | 0.0000450 | 0.0113708 | 0.0028518 |
| 8 | 0.0012942 | 0.0006999 | 0.3660714 | 0.3660787 | ... | 0.0001966 | 0.0002061 | 0.0113708 | 0.0028518 |
| 9 | 0.0011333 | 0.0012735 | 0.3660714 | 0.3660787 | ... | 0.0001514 | 0.0014780 | 0.0113708 | 0.0028518 |
| 10 | 0.0016042 | 0.0006387 | 0.3660714 | 0.3660787 | ... | 0.0005756 | 0.0001327 | 0.0113708 | 0.0028518 |
| 11 | 0.0014416 | 0.0022371 | 0.3660714 | 0.3660787 | ... | 0.0004339 | 0.0025022 | 0.0113708 | 0.0028518 |
| 12 | 0.0034446 | 0.0004577 | 0.3660714 | 0.3660787 | ... | 0.0047159 | 0.0000184 | 0.0113708 | 0.0028518 |
| 13 | 0.0015449 | 0.0004823 | 0.6964286 | 0.6964237 | ... | 0.0005018 | 0.0000942 | 0.0131963 | 0.0032580 |
| 14 | 0.0010179 | 0.0005842 | 0.9196429 | 0.9197442 | ... | 0.0001187 | 0.0000258 | 0.0440102 | 0.0212659 |
| 15 | 0.0011138 | 0.0004836 | 0.9553571 | 0.9598457 | ... | 0.0001235 | 0.0000593 | 0.0401043 | 0.0113043 |
| 16 | 0.0014143 | 0.0005417 | 0.3660714 | 0.3817097 | ... | 0.0005119 | 0.0001906 | 0.0113708 | 0.0213374 |
| 17 | 0.0020837 | 0.0004833 | 0.3660714 | 0.3660787 | ... | 0.0016379 | 0.0000902 | 0.0113708 | 0.0028518 |
| 18 | 0.0018477 | 0.0004734 | 0.6964286 | 0.6964237 | ... | 0.0016144 | 0.0000679 | 0.0131963 | 0.0032580 |
| 19 | 0.0009147 | 0.0004317 | 0.9285714 | 0.9353247 | ... | 0.0001314 | 0.0000665 | 0.0429827 | 0.0078884 |
| 20 | 0.0008145 | 0.0005105 | 0.9642857 | 0.9776501 | ... | 0.0001012 | 0.0001073 | 0.0340769 | 0.0100842 |
| 21 | 0.0009450 | 0.0004607 | 0.9464286 | 0.9843928 | ... | 0.0001512 | 0.0000481 | 0.0324799 | 0.0088664 |
| 22 | 0.0016514 | 0.0005848 | 0.9196429 | 1.0000000 | ... | 0.0002375 | 0.0001800 | 0.0647906 | 0.0000000 |
| 23 | 0.0013955 | 0.0004817 | 0.5089286 | 1.0000000 | ... | 0.0000500 | 0.0000798 | 0.0464350 | 0.0000000 |
| 24 | 0.0008643 | 0.0004160 | 0.9285714 | 0.9353247 | ... | 0.0000664 | 0.0000253 | 0.0429827 | 0.0078884 |
| 25 | 0.0006838 | 0.0004532 | 0.9642857 | 0.9776757 | ... | 0.0000423 | 0.0001550 | 0.0340769 | 0.0070319 |
| 26 | 0.0008232 | 0.0004055 | 0.9642857 | 0.9865662 | ... | 0.0002632 | 0.0000344 | 0.0177687 | 0.0083555 |
| 27 | 0.0007598 | 0.0004054 | 0.9375000 | 0.9865906 | ... | 0.0001178 | 0.0000655 | 0.0452528 | 0.0083624 |
| 28 | 0.0010057 | 0.0003399 | 0.9196429 | 1.0000000 | ... | 0.0001139 | 0.0000584 | 0.0647906 | 0.0000000 |
| 29 | 0.0010963 | 0.0004542 | 0.5625000 | 1.0000000 | ... | 0.0001579 | 0.0001312 | 0.0496678 | 0.0000000 |
| 30 | 0.0005068 | 0.0002547 | 0.9642857 | 0.9776757 | ... | 0.0000904 | 0.0000352 | 0.0340769 | 0.0070319 |
| 31 | 0.0005447 | 0.0002956 | 0.9732143 | 0.9843684 | ... | 0.0002228 | 0.0000414 | 0.0223995 | 0.0054851 |
| 32 | 0.0005828 | 0.0005119 | 0.9553571 | 0.9887884 | ... | 0.0001083 | 0.0003010 | 0.0495662 | 0.0099945 |
| 33 | 0.0005792 | 0.0002865 | 0.9464286 | 1.0000000 | ... | 0.0000584 | 0.0000391 | 0.0519227 | 0.0000000 |
| 34 | 0.0010027 | 0.0003521 | 0.9196429 | 1.0000000 | ... | 0.0001354 | 0.0000996 | 0.0647906 | 0.0000000 |
| 35 | 0.0010271 | 0.0003221 | 0.5625000 | 1.0000000 | ... | 0.0001011 | 0.0000409 | 0.0496678 | 0.0000000 |
36 rows × 22 columns
In [33]:
results2 = results[['rank_test_score', 'params', 'mean_test_score', 'std_test_score',
                    'mean_train_score', 'std_train_score']]
results2 = results2.sort_values('rank_test_score')
display(results2)
| rank_test_score | params | mean_test_score | std_test_score | mean_train_score | std_train_score | |
|---|---|---|---|---|---|---|
| 31 | 1 | {'C': 100, 'gamma': 0.01} | 0.9732143 | 0.0223995 | 0.9843684 | 0.0054851 |
| 20 | 2 | {'C': 1, 'gamma': 0.1} | 0.9642857 | 0.0340769 | 0.9776501 | 0.0100842 |
| 30 | 2 | {'C': 100, 'gamma': 0.001} | 0.9642857 | 0.0340769 | 0.9776757 | 0.0070319 |
| 26 | 2 | {'C': 10, 'gamma': 0.1} | 0.9642857 | 0.0177687 | 0.9865662 | 0.0083555 |
| 25 | 2 | {'C': 10, 'gamma': 0.01} | 0.9642857 | 0.0340769 | 0.9776757 | 0.0070319 |
| 32 | 6 | {'C': 100, 'gamma': 0.1} | 0.9553571 | 0.0495662 | 0.9887884 | 0.0099945 |
| 15 | 6 | {'C': 0.1, 'gamma': 1} | 0.9553571 | 0.0401043 | 0.9598457 | 0.0113043 |
| 33 | 8 | {'C': 100, 'gamma': 1} | 0.9464286 | 0.0519227 | 1.0000000 | 0.0000000 |
| 21 | 8 | {'C': 1, 'gamma': 1} | 0.9464286 | 0.0324799 | 0.9843928 | 0.0088664 |
| 27 | 10 | {'C': 10, 'gamma': 1} | 0.9375000 | 0.0452528 | 0.9865906 | 0.0083624 |
| 24 | 11 | {'C': 10, 'gamma': 0.001} | 0.9285714 | 0.0429827 | 0.9353247 | 0.0078884 |
| 19 | 11 | {'C': 1, 'gamma': 0.01} | 0.9285714 | 0.0429827 | 0.9353247 | 0.0078884 |
| 22 | 13 | {'C': 1, 'gamma': 10} | 0.9196429 | 0.0647906 | 1.0000000 | 0.0000000 |
| 14 | 13 | {'C': 0.1, 'gamma': 0.1} | 0.9196429 | 0.0440102 | 0.9197442 | 0.0212659 |
| 28 | 13 | {'C': 10, 'gamma': 10} | 0.9196429 | 0.0647906 | 1.0000000 | 0.0000000 |
| 34 | 13 | {'C': 100, 'gamma': 10} | 0.9196429 | 0.0647906 | 1.0000000 | 0.0000000 |
| 13 | 17 | {'C': 0.1, 'gamma': 0.01} | 0.6964286 | 0.0131963 | 0.6964237 | 0.0032580 |
| 18 | 17 | {'C': 1, 'gamma': 0.001} | 0.6964286 | 0.0131963 | 0.6964237 | 0.0032580 |
| 29 | 19 | {'C': 10, 'gamma': 100} | 0.5625000 | 0.0496678 | 1.0000000 | 0.0000000 |
| 35 | 19 | {'C': 100, 'gamma': 100} | 0.5625000 | 0.0496678 | 1.0000000 | 0.0000000 |
| 23 | 21 | {'C': 1, 'gamma': 100} | 0.5089286 | 0.0464350 | 1.0000000 | 0.0000000 |
| 0 | 22 | {'C': 0.001, 'gamma': 0.001} | 0.3660714 | 0.0113708 | 0.3660787 | 0.0028518 |
| 12 | 22 | {'C': 0.1, 'gamma': 0.001} | 0.3660714 | 0.0113708 | 0.3660787 | 0.0028518 |
| 11 | 22 | {'C': 0.01, 'gamma': 100} | 0.3660714 | 0.0113708 | 0.3660787 | 0.0028518 |
| 10 | 22 | {'C': 0.01, 'gamma': 10} | 0.3660714 | 0.0113708 | 0.3660787 | 0.0028518 |
| 9 | 22 | {'C': 0.01, 'gamma': 1} | 0.3660714 | 0.0113708 | 0.3660787 | 0.0028518 |
| 8 | 22 | {'C': 0.01, 'gamma': 0.1} | 0.3660714 | 0.0113708 | 0.3660787 | 0.0028518 |
| 7 | 22 | {'C': 0.01, 'gamma': 0.01} | 0.3660714 | 0.0113708 | 0.3660787 | 0.0028518 |
| 6 | 22 | {'C': 0.01, 'gamma': 0.001} | 0.3660714 | 0.0113708 | 0.3660787 | 0.0028518 |
| 5 | 22 | {'C': 0.001, 'gamma': 100} | 0.3660714 | 0.0113708 | 0.3660787 | 0.0028518 |
| 4 | 22 | {'C': 0.001, 'gamma': 10} | 0.3660714 | 0.0113708 | 0.3660787 | 0.0028518 |
| 3 | 22 | {'C': 0.001, 'gamma': 1} | 0.3660714 | 0.0113708 | 0.3660787 | 0.0028518 |
| 2 | 22 | {'C': 0.001, 'gamma': 0.1} | 0.3660714 | 0.0113708 | 0.3660787 | 0.0028518 |
| 1 | 22 | {'C': 0.001, 'gamma': 0.01} | 0.3660714 | 0.0113708 | 0.3660787 | 0.0028518 |
| 16 | 22 | {'C': 0.1, 'gamma': 10} | 0.3660714 | 0.0113708 | 0.3817097 | 0.0213374 |
| 17 | 22 | {'C': 0.1, 'gamma': 100} | 0.3660714 | 0.0113708 | 0.3660787 | 0.0028518 |
- heatmap을 사용한 mean_test_score를 각 매개변수별로 시각화
In [34]:
print([x for x in results.mean_test_score])
print()

print(results.mean_test_score.shape)

scores = np.array(results.mean_test_score).reshape(6, 6)

# plot the mean cross-validation scores
mglearn.tools.heatmap(
    scores,
    xlabel='gamma',
    xticklabels=param_grid['gamma'],
    ylabel='C',
    yticklabels=param_grid['C'],
    cmap="viridis"
)
[0.36607142857142855, 0.36607142857142855, 0.36607142857142855, 0.36607142857142855, 0.36607142857142855, 0.36607142857142855, 0.36607142857142855, 0.36607142857142855, 0.36607142857142855, 0.36607142857142855, 0.36607142857142855, 0.36607142857142855, 0.36607142857142855, 0.6964285714285714, 0.9196428571428571, 0.9553571428571429, 0.36607142857142855, 0.36607142857142855, 0.6964285714285714, 0.9285714285714286, 0.9642857142857143, 0.9464285714285714, 0.9196428571428571, 0.5089285714285714, 0.9285714285714286, 0.9642857142857143, 0.9642857142857143, 0.9375, 0.9196428571428571, 0.5625, 0.9642857142857143, 0.9732142857142857, 0.9553571428571429, 0.9464285714285714, 0.9196428571428571, 0.5625]

(36,)
Out[34]:
<matplotlib.collections.PolyCollection at 0x10f14edd8>

In [35]:
fig, axes = plt.subplots(1, 3, figsize=(20, 5))

param_grid_linear  = {'C': np.linspace(1, 2, 6),  'gamma':  np.linspace(1, 2, 6)}
param_grid_one_log = {'C': np.linspace(1, 2, 6),  'gamma':  np.logspace(-3, 2, 6)}
param_grid_range   = {'C': np.logspace(-3, 2, 6), 'gamma':  np.logspace(-7, -2, 6)}

for param_grid, ax in zip([param_grid_linear, param_grid_one_log, param_grid_range], axes):
    grid_search = GridSearchCV(SVC(), param_grid, n_jobs=-1, cv=5)
    grid_search.fit(X_train, y_train)
    scores = grid_search.cv_results_['mean_test_score'].reshape(6, 6)

    # plot the mean cross-validation scores
    scores_image = mglearn.tools.heatmap(
        scores, xlabel='gamma', ylabel='C', xticklabels=param_grid['gamma'],
        yticklabels=param_grid['C'], cmap="viridis", ax=ax)

plt.colorbar(scores_image, ax=axes.tolist())
Out[35]:
<matplotlib.colorbar.Colorbar at 0x10f188630>

첫번째 그래프
- 매개변수 C와 gamma의 스케일과 범위를 잘못 택하였음을 나타냄
- 처음에는 더 넓은 범위의 C와 gamma 스케일 및 범위를 택하고, 이후 정확도에 따라 매개변수를 바꾸어 선택할 필요있음
두번째 그래프
- 세로 띠 형태를 보이므로 gamma 매개변수만 정확도에 영향을 주고 있음을 나타냄
- 두 가지 케이스
- C 매개변수는 전혀 중요한 역할을 못할 수 있음
- C 매개변수의 스케일과 범위를 잘못 선택하였을 수 있음
세번째 그래프
- 그래프 왼쪽 아래에서는 변화가 없음
- 다시 매개변수 스케일과 범위를 선택하는 과정에서 현재 선택한 것 보다 더 높은 gamma 및 C 값을 선택할 필요성 있음
Grid search with asymmetric parameters
- SVC
- kernel='rbf' 일 때
- C 매개변수, gamma 매개변수 동시 사용
- kernel='linear' 일 때
- C 매개변수만 사용
- gamma 매개변수는 사용하지 않음
- kernel='rbf' 일 때
In [36]:
param_grid = [{'kernel': ['rbf'],
               'C': [0.001, 0.01, 0.1, 1, 10, 100],
               'gamma': [0.001, 0.01, 0.1, 1, 10, 100]},
              {'kernel': ['linear'],
               'C': [0.001, 0.01, 0.1, 1, 10, 100]}]
print("List of grids:\n{}".format(param_grid))
List of grids:
[{'kernel': ['rbf'], 'C': [0.001, 0.01, 0.1, 1, 10, 100], 'gamma': [0.001, 0.01, 0.1, 1, 10, 100]}, {'kernel': ['linear'], 'C': [0.001, 0.01, 0.1, 1, 10, 100]}]
In [37]:
grid_search = GridSearchCV(SVC(), param_grid, n_jobs=-1, cv=5, return_train_score=True)

grid_search.fit(X_train, y_train)

print("Best parameters: {}".format(grid_search.best_params_))
print("Best cross-validation score: {:.2f}".format(grid_search.best_score_))
Best parameters: {'C': 100, 'gamma': 0.01, 'kernel': 'rbf'}
Best cross-validation score: 0.97
In [38]:
results = pd.DataFrame(grid_search.cv_results_)

results2 = results[['rank_test_score', 'params', 'mean_test_score', 'std_test_score',
                    'mean_train_score', 'std_train_score']]
results2 = results2.sort_values('rank_test_score')
display(results2)
| rank_test_score | params | mean_test_score | std_test_score | mean_train_score | std_train_score | |
|---|---|---|---|---|---|---|
| 39 | 1 | {'C': 1, 'kernel': 'linear'} | 0.9732143 | 0.0223995 | 0.9843684 | 0.0054851 |
| 31 | 1 | {'C': 100, 'gamma': 0.01, 'kernel': 'rbf'} | 0.9732143 | 0.0223995 | 0.9843684 | 0.0054851 |
| 20 | 3 | {'C': 1, 'gamma': 0.1, 'kernel': 'rbf'} | 0.9642857 | 0.0340769 | 0.9776501 | 0.0100842 |
| 30 | 3 | {'C': 100, 'gamma': 0.001, 'kernel': 'rbf'} | 0.9642857 | 0.0340769 | 0.9776757 | 0.0070319 |
| 26 | 3 | {'C': 10, 'gamma': 0.1, 'kernel': 'rbf'} | 0.9642857 | 0.0177687 | 0.9865662 | 0.0083555 |
| 25 | 3 | {'C': 10, 'gamma': 0.01, 'kernel': 'rbf'} | 0.9642857 | 0.0340769 | 0.9776757 | 0.0070319 |
| 40 | 3 | {'C': 10, 'kernel': 'linear'} | 0.9642857 | 0.0338387 | 0.9888134 | 0.0070280 |
| 41 | 3 | {'C': 100, 'kernel': 'linear'} | 0.9642857 | 0.0338387 | 0.9932579 | 0.0055055 |
| 32 | 9 | {'C': 100, 'gamma': 0.1, 'kernel': 'rbf'} | 0.9553571 | 0.0495662 | 0.9887884 | 0.0099945 |
| 15 | 9 | {'C': 0.1, 'gamma': 1, 'kernel': 'rbf'} | 0.9553571 | 0.0401043 | 0.9598457 | 0.0113043 |
| 38 | 11 | {'C': 0.1, 'kernel': 'linear'} | 0.9464286 | 0.0332185 | 0.9665385 | 0.0121316 |
| 21 | 11 | {'C': 1, 'gamma': 1, 'kernel': 'rbf'} | 0.9464286 | 0.0324799 | 0.9843928 | 0.0088664 |
| 33 | 11 | {'C': 100, 'gamma': 1, 'kernel': 'rbf'} | 0.9464286 | 0.0519227 | 1.0000000 | 0.0000000 |
| 27 | 14 | {'C': 10, 'gamma': 1, 'kernel': 'rbf'} | 0.9375000 | 0.0452528 | 0.9865906 | 0.0083624 |
| 24 | 15 | {'C': 10, 'gamma': 0.001, 'kernel': 'rbf'} | 0.9285714 | 0.0429827 | 0.9353247 | 0.0078884 |
| 19 | 15 | {'C': 1, 'gamma': 0.01, 'kernel': 'rbf'} | 0.9285714 | 0.0429827 | 0.9353247 | 0.0078884 |
| 22 | 17 | {'C': 1, 'gamma': 10, 'kernel': 'rbf'} | 0.9196429 | 0.0647906 | 1.0000000 | 0.0000000 |
| 14 | 17 | {'C': 0.1, 'gamma': 0.1, 'kernel': 'rbf'} | 0.9196429 | 0.0440102 | 0.9197442 | 0.0212659 |
| 34 | 17 | {'C': 100, 'gamma': 10, 'kernel': 'rbf'} | 0.9196429 | 0.0647906 | 1.0000000 | 0.0000000 |
| 28 | 17 | {'C': 10, 'gamma': 10, 'kernel': 'rbf'} | 0.9196429 | 0.0647906 | 1.0000000 | 0.0000000 |
| 37 | 21 | {'C': 0.01, 'kernel': 'linear'} | 0.8482143 | 0.0547783 | 0.8550694 | 0.0503114 |
| 18 | 22 | {'C': 1, 'gamma': 0.001, 'kernel': 'rbf'} | 0.6964286 | 0.0131963 | 0.6964237 | 0.0032580 |
| 13 | 22 | {'C': 0.1, 'gamma': 0.01, 'kernel': 'rbf'} | 0.6964286 | 0.0131963 | 0.6964237 | 0.0032580 |
| 35 | 24 | {'C': 100, 'gamma': 100, 'kernel': 'rbf'} | 0.5625000 | 0.0496678 | 1.0000000 | 0.0000000 |
| 29 | 24 | {'C': 10, 'gamma': 100, 'kernel': 'rbf'} | 0.5625000 | 0.0496678 | 1.0000000 | 0.0000000 |
| 23 | 26 | {'C': 1, 'gamma': 100, 'kernel': 'rbf'} | 0.5089286 | 0.0464350 | 1.0000000 | 0.0000000 |
| 36 | 27 | {'C': 0.001, 'kernel': 'linear'} | 0.3660714 | 0.0113708 | 0.3660787 | 0.0028518 |
| 2 | 27 | {'C': 0.001, 'gamma': 0.1, 'kernel': 'rbf'} | 0.3660714 | 0.0113708 | 0.3660787 | 0.0028518 |
| 3 | 27 | {'C': 0.001, 'gamma': 1, 'kernel': 'rbf'} | 0.3660714 | 0.0113708 | 0.3660787 | 0.0028518 |
| 1 | 27 | {'C': 0.001, 'gamma': 0.01, 'kernel': 'rbf'} | 0.3660714 | 0.0113708 | 0.3660787 | 0.0028518 |
| 8 | 27 | {'C': 0.01, 'gamma': 0.1, 'kernel': 'rbf'} | 0.3660714 | 0.0113708 | 0.3660787 | 0.0028518 |
| 5 | 27 | {'C': 0.001, 'gamma': 100, 'kernel': 'rbf'} | 0.3660714 | 0.0113708 | 0.3660787 | 0.0028518 |
| 7 | 27 | {'C': 0.01, 'gamma': 0.01, 'kernel': 'rbf'} | 0.3660714 | 0.0113708 | 0.3660787 | 0.0028518 |
| 6 | 27 | {'C': 0.01, 'gamma': 0.001, 'kernel': 'rbf'} | 0.3660714 | 0.0113708 | 0.3660787 | 0.0028518 |
| 17 | 27 | {'C': 0.1, 'gamma': 100, 'kernel': 'rbf'} | 0.3660714 | 0.0113708 | 0.3660787 | 0.0028518 |
| 16 | 27 | {'C': 0.1, 'gamma': 10, 'kernel': 'rbf'} | 0.3660714 | 0.0113708 | 0.3817097 | 0.0213374 |
| 12 | 27 | {'C': 0.1, 'gamma': 0.001, 'kernel': 'rbf'} | 0.3660714 | 0.0113708 | 0.3660787 | 0.0028518 |
| 11 | 27 | {'C': 0.01, 'gamma': 100, 'kernel': 'rbf'} | 0.3660714 | 0.0113708 | 0.3660787 | 0.0028518 |
| 10 | 27 | {'C': 0.01, 'gamma': 10, 'kernel': 'rbf'} | 0.3660714 | 0.0113708 | 0.3660787 | 0.0028518 |
| 9 | 27 | {'C': 0.01, 'gamma': 1, 'kernel': 'rbf'} | 0.3660714 | 0.0113708 | 0.3660787 | 0.0028518 |
| 4 | 27 | {'C': 0.001, 'gamma': 10, 'kernel': 'rbf'} | 0.3660714 | 0.0113708 | 0.3660787 | 0.0028518 |
| 0 | 27 | {'C': 0.001, 'gamma': 0.001, 'kernel': 'rbf'} | 0.3660714 | 0.0113708 | 0.3660787 | 0.0028518 |
Using different cross-validation strategies with grid-search
- GridSearchCV의 인자인 cv에 스스로 정의한 다음과 같은 교차 검증 분할기 제공
- KFold(n_splits=5)
- StratifiedKFold(n_splits=5)
- ShuffleSplit(n_splits=5)
- StratifiedShuffleSplit(n_splits=5)
- n_splits=1을 사용하는 경우
- 훈련 데이터 세트와 검증 데이터 세트로의 분리를 한번 만 수행
- 데이터셋이 매우 크거나 모델 구축 시간이 오래 걸릴 때 사용하는 전략
In [39]:
from sklearn.model_selection import StratifiedShuffleSplit

shuffle_split = StratifiedShuffleSplit(test_size=.8, n_splits=1)
grid_search = GridSearchCV(SVC(), param_grid, cv=shuffle_split, return_train_score=True)

grid_search.fit(X_train, y_train)

print("Best parameters: {}".format(grid_search.best_params_))
print("Best cross-validation score: {:.2f}".format(grid_search.best_score_))
Best parameters: {'C': 10, 'gamma': 0.1, 'kernel': 'rbf'}
Best cross-validation score: 0.92
In [40]:
results = pd.DataFrame(grid_search.cv_results_)

results2 = results[['rank_test_score', 'params', 'mean_test_score', 'std_test_score',
                    'mean_train_score', 'std_train_score']]
results2 = results2.sort_values('rank_test_score')
display(results2)
| rank_test_score | params | mean_test_score | std_test_score | mean_train_score | std_train_score | |
|---|---|---|---|---|---|---|
| 41 | 1 | {'C': 100, 'kernel': 'linear'} | 0.9222222 | 0.0000000 | 1.0000000 | 0.0000000 |
| 39 | 1 | {'C': 1, 'kernel': 'linear'} | 0.9222222 | 0.0000000 | 1.0000000 | 0.0000000 |
| 32 | 1 | {'C': 100, 'gamma': 0.1, 'kernel': 'rbf'} | 0.9222222 | 0.0000000 | 1.0000000 | 0.0000000 |
| 31 | 1 | {'C': 100, 'gamma': 0.01, 'kernel': 'rbf'} | 0.9222222 | 0.0000000 | 1.0000000 | 0.0000000 |
| 26 | 1 | {'C': 10, 'gamma': 0.1, 'kernel': 'rbf'} | 0.9222222 | 0.0000000 | 1.0000000 | 0.0000000 |
| 40 | 1 | {'C': 10, 'kernel': 'linear'} | 0.9222222 | 0.0000000 | 1.0000000 | 0.0000000 |
| 38 | 7 | {'C': 0.1, 'kernel': 'linear'} | 0.9111111 | 0.0000000 | 1.0000000 | 0.0000000 |
| 33 | 8 | {'C': 100, 'gamma': 1, 'kernel': 'rbf'} | 0.9000000 | 0.0000000 | 1.0000000 | 0.0000000 |
| 30 | 8 | {'C': 100, 'gamma': 0.001, 'kernel': 'rbf'} | 0.9000000 | 0.0000000 | 1.0000000 | 0.0000000 |
| 27 | 8 | {'C': 10, 'gamma': 1, 'kernel': 'rbf'} | 0.9000000 | 0.0000000 | 1.0000000 | 0.0000000 |
| 25 | 8 | {'C': 10, 'gamma': 0.01, 'kernel': 'rbf'} | 0.9000000 | 0.0000000 | 1.0000000 | 0.0000000 |
| 20 | 12 | {'C': 1, 'gamma': 0.1, 'kernel': 'rbf'} | 0.8888889 | 0.0000000 | 1.0000000 | 0.0000000 |
| 21 | 13 | {'C': 1, 'gamma': 1, 'kernel': 'rbf'} | 0.8777778 | 0.0000000 | 1.0000000 | 0.0000000 |
| 28 | 14 | {'C': 10, 'gamma': 10, 'kernel': 'rbf'} | 0.7333333 | 0.0000000 | 1.0000000 | 0.0000000 |
| 22 | 14 | {'C': 1, 'gamma': 10, 'kernel': 'rbf'} | 0.7333333 | 0.0000000 | 1.0000000 | 0.0000000 |
| 34 | 14 | {'C': 100, 'gamma': 10, 'kernel': 'rbf'} | 0.7333333 | 0.0000000 | 1.0000000 | 0.0000000 |
| 14 | 17 | {'C': 0.1, 'gamma': 0.1, 'kernel': 'rbf'} | 0.7000000 | 0.0000000 | 0.6818182 | 0.0000000 |
| 37 | 17 | {'C': 0.01, 'kernel': 'linear'} | 0.7000000 | 0.0000000 | 0.6818182 | 0.0000000 |
| 19 | 17 | {'C': 1, 'gamma': 0.01, 'kernel': 'rbf'} | 0.7000000 | 0.0000000 | 0.6818182 | 0.0000000 |
| 24 | 17 | {'C': 10, 'gamma': 0.001, 'kernel': 'rbf'} | 0.7000000 | 0.0000000 | 0.6818182 | 0.0000000 |
| 15 | 21 | {'C': 0.1, 'gamma': 1, 'kernel': 'rbf'} | 0.5000000 | 0.0000000 | 0.5909091 | 0.0000000 |
| 35 | 22 | {'C': 100, 'gamma': 100, 'kernel': 'rbf'} | 0.4444444 | 0.0000000 | 1.0000000 | 0.0000000 |
| 29 | 22 | {'C': 10, 'gamma': 100, 'kernel': 'rbf'} | 0.4444444 | 0.0000000 | 1.0000000 | 0.0000000 |
| 23 | 24 | {'C': 1, 'gamma': 100, 'kernel': 'rbf'} | 0.4222222 | 0.0000000 | 1.0000000 | 0.0000000 |
| 4 | 25 | {'C': 0.001, 'gamma': 10, 'kernel': 'rbf'} | 0.3666667 | 0.0000000 | 0.3636364 | 0.0000000 |
| 3 | 25 | {'C': 0.001, 'gamma': 1, 'kernel': 'rbf'} | 0.3666667 | 0.0000000 | 0.3636364 | 0.0000000 |
| 12 | 25 | {'C': 0.1, 'gamma': 0.001, 'kernel': 'rbf'} | 0.3666667 | 0.0000000 | 0.3636364 | 0.0000000 |
| 2 | 25 | {'C': 0.001, 'gamma': 0.1, 'kernel': 'rbf'} | 0.3666667 | 0.0000000 | 0.3636364 | 0.0000000 |
| 1 | 25 | {'C': 0.001, 'gamma': 0.01, 'kernel': 'rbf'} | 0.3666667 | 0.0000000 | 0.3636364 | 0.0000000 |
| 36 | 25 | {'C': 0.001, 'kernel': 'linear'} | 0.3666667 | 0.0000000 | 0.3636364 | 0.0000000 |
| 5 | 25 | {'C': 0.001, 'gamma': 100, 'kernel': 'rbf'} | 0.3666667 | 0.0000000 | 0.3636364 | 0.0000000 |
| 8 | 25 | {'C': 0.01, 'gamma': 0.1, 'kernel': 'rbf'} | 0.3666667 | 0.0000000 | 0.3636364 | 0.0000000 |
| 7 | 25 | {'C': 0.01, 'gamma': 0.01, 'kernel': 'rbf'} | 0.3666667 | 0.0000000 | 0.3636364 | 0.0000000 |
| 11 | 25 | {'C': 0.01, 'gamma': 100, 'kernel': 'rbf'} | 0.3666667 | 0.0000000 | 0.3636364 | 0.0000000 |
| 9 | 25 | {'C': 0.01, 'gamma': 1, 'kernel': 'rbf'} | 0.3666667 | 0.0000000 | 0.3636364 | 0.0000000 |
| 10 | 25 | {'C': 0.01, 'gamma': 10, 'kernel': 'rbf'} | 0.3666667 | 0.0000000 | 0.3636364 | 0.0000000 |
| 18 | 25 | {'C': 1, 'gamma': 0.001, 'kernel': 'rbf'} | 0.3666667 | 0.0000000 | 0.3636364 | 0.0000000 |
| 17 | 25 | {'C': 0.1, 'gamma': 100, 'kernel': 'rbf'} | 0.3666667 | 0.0000000 | 0.3636364 | 0.0000000 |
| 16 | 25 | {'C': 0.1, 'gamma': 10, 'kernel': 'rbf'} | 0.3666667 | 0.0000000 | 0.3636364 | 0.0000000 |
| 13 | 25 | {'C': 0.1, 'gamma': 0.01, 'kernel': 'rbf'} | 0.3666667 | 0.0000000 | 0.3636364 | 0.0000000 |
| 6 | 25 | {'C': 0.01, 'gamma': 0.001, 'kernel': 'rbf'} | 0.3666667 | 0.0000000 | 0.3636364 | 0.0000000 |
| 0 | 25 | {'C': 0.001, 'gamma': 0.001, 'kernel': 'rbf'} | 0.3666667 | 0.0000000 | 0.3636364 | 0.0000000 |
Nested cross-validation
- 지금까지 살펴본 코드들의 단점
- 처음에 원본 데이터들을 훈련 데이터와 테스트 데이터로 한번만 나누고 있음.
- 원본 데이터를 훈련 데이터와 테스트 데이터로 나누는 시점도 교차 검증화 시킬 수 있음 --> 중첩 교차 검증
- 중첩 교차 검증
- outer_scores = []
- 1st Loop: 원본 데이터를 훈련(Training) 데이터와 테스트(Test) 데이터로 분리 및 순회
- best_params = {}
- best_score = -np.inf
- 2nd Loop: 매개변수 그리드를 순회
- 3rd Loop: 훈련 데이터를 다시 훈련(Training) 데이터와 검증(Validation) 데이터로 분리
- 3rd Loop의 결과 모델을 평가하여 best_params 및 best_score 조정
- best_params와 함께 모델 구성하여 평가결과를 outer_scores에 저장

- 위 중첩 교차 검증과정을 corss_val_score 및 GridSearchCV 조합으로 간단하게 완성
In [41]:
param_grid = {'C': [0.001, 0.01, 0.1, 1, 10, 100],
              'gamma': [0.001, 0.01, 0.1, 1, 10, 100]}

grid_search = GridSearchCV(SVC(), param_grid, cv=5)
scores = cross_val_score(grid_search, iris.data, iris.target, n_jobs=-1, cv=5)

print("Cross-validation scores: ", scores)
print("Mean cross-validation score: ", scores.mean())
Cross-validation scores:  [0.967 1.    0.967 0.967 1.   ]
Mean cross-validation score:  0.9800000000000001
- 위 코드 설명
- 매개 변수 조합: 6 * 6 = 36
- 바깥 루프: 5개 분할
- 안쪽 루프: 5개 분할
- 모델 생성 횟수: 36 * 5 * 5 = 900
In [42]:
def nested_cv(X, y, inner_cv, outer_cv, Classifier, parameter_grid):
    outer_scores = []
    outer_best_params = []

    # for each split of the data in the outer cross-validation
    # (split method returns indices of training and test part)
    for training_samples, test_samples in outer_cv.split(X, y):
        # find best parameter using inner cross-validation
        best_parms = {}
        best_score = -np.inf

        # iterate over parameters
        for parameters in parameter_grid:
            # accumulate score over inner splits
            cv_scores = []

            # iterate over inner cross-validation
            for inner_train, inner_test in inner_cv.split(X[training_samples], y[training_samples]):
                # build classifier given parameters and training data
                clf = Classifier(**parameters)
                clf.fit(X[inner_train], y[inner_train])
                # evaluate on inner test set
                score = clf.score(X[inner_test], y[inner_test])
                cv_scores.append(score)

                # compute mean score over inner folds
            mean_score = np.mean(cv_scores)
            if mean_score > best_score:
                # if better than so far, remember parameters
                best_score = mean_score
                best_params = parameters

        # build classifier on best parameters using outer training set
        clf = Classifier(**best_params)
        clf.fit(X[training_samples], y[training_samples])

        # evaluate
        outer_scores.append(clf.score(X[test_samples], y[test_samples]))
        outer_best_params.append(best_params)
    return np.array(outer_scores), outer_best_params
In [43]:
from sklearn.model_selection import ParameterGrid, StratifiedKFold

scores, params = nested_cv(
    iris.data,
    iris.target,
    StratifiedKFold(5),
    StratifiedKFold(5),
    SVC,
    ParameterGrid(param_grid)
)

print("Cross-validation scores: {}".format(scores))
print("Mean cross-validation score: ", scores.mean())
print("best params: {}".format(params))
Cross-validation scores: [0.967 1.    0.967 0.967 1.   ]
Mean cross-validation score:  0.9800000000000001
best params: [{'C': 100, 'gamma': 0.01}, {'C': 100, 'gamma': 0.01}, {'C': 100, 'gamma': 0.01}, {'C': 100, 'gamma': 0.01}, {'C': 100, 'gamma': 0.01}]
Parallelizing cross-validation and grid search
- 다중 CPU 코어 or 다중 GPU 코어 사용
- 사용가능한 프레임워크
- ipyparallel
- spark-sklearn
5.3. Evaluation Metrics and Scoring
- 기존의 Simple한 모델 평가 지표 (score)
- 분류 문제: 정확도 (Accuracy)
- 회귀 문제: $R^2$
- 하지만, 어플리케이션에 따라 위의 평가 지표가 적합하지 않을 수 있음.
5.3.1 Keep the End Goal in Mind (최종 목표를 기억하라)
- 어플리케이션의 고차원 목표인 비지니스 지표를 우선적으로 고려해야 함
- 비지니스 지표 예
- 교통사고율 낮춤
- 입원환자 수 낮춤
- 웹사이트 사용자 유입률 증대
- 소비자 소비률 증대
- 분석 모델 개발 초기 단계에 매개변수를 조정하기 위해 시험 삼아 모델을 실제 운영 시스템에 곧바로 적용하기란 위험부담이 크다.
- 비지니스 지표 예
- 비지니스 임팩트 (Business Impact)
- 어떤 머신러닝 어플리케이션에서 특정 알고리즘을 선택하여 나타난 결과
- 훈련 모델에 대한 비지니스 임팩트를 정확하게 예상할 수 있는 다양한 평가지표 도입 필요
- 이진 분류의 평가 지표
- 다중 분류의 평가 지표
- 회귀의 평가 지표
5.3.2 Metrics for Binary Classification
두 가지 분류 클래스
- 양성 클래스 (주 관심 클래스) --> Positive Class
- 음성 클래스 --> Negative Class
모델 적용 결과에 대한 분류
- True Positive (참 양성, TP)
- 모델에서 실제 양성 클래스를 정확하게 양성으로 평가한 것들
- False Negative (거짓 음성, FN)
- 모델에서 실제 양성 클래스를 잘못하여 음성으로 평가한 것들
- True Negative (참 음성, TN)
- 모델에서 실제 음성 클래스를 정확하게 음성으로 평가한 것들
- False Positive (거짓 양성, FP)
- 모델에서 실제 음성 클래스를 잘못하여 양성으로 평가한 것들
- True Positive (참 양성, TP)

Kinds of errors
암의 조기 발견 어플리케이션
- 테스트가 음성(-)이면 건강함을 뜻함
- 음성 클래스(Negative Class)
- 테스트가 양성(+)이면 암 진단이 되었음을 뜻함
- 양성 클래스(Positive Class)
- 잘못된 분류 케이스
- Case 1. 건강한 사람을 양성으로 잘못 분류한 경우
- 이 환자에게 비용 손실과 불편함을 초래함
- 즉, 잘못된 양성 예측
- 분류: *거짓 양성 (False Positive)*
- Case 2. 암에 걸린 사람을 음성으로 잘못 분류한 경우
- 제대로 된 검사나 치료를 제때에 못하게 하는 치명적인 오류
- 즉, 잘못된 음성 예측
- 분류: *거짓 음성 (False Negative)*
- Case 1. 건강한 사람을 양성으로 잘못 분류한 경우
- 테스트가 음성(-)이면 건강함을 뜻함
대부분의 경우 *거짓 음성이 거짓 양성*보다 더 치명적
거짓 음성 분류와 거짓 양성 분류 중 하나가 다른 것 보다 훨씬 많을 때 이 상황은 매우 중요한 상황으로 인식해야 함.
Imbalanced datasets
불균형 데이터셋(Imbalanced datasets)
- 예) 인터넷 광고 클릭 데이터에서 원본 데이터 샘플의 99%가 '클릭 아님'이고 1%만이 '클릭'인 데이터셋
- 현실에서 불균형 데이터는 매우 많음
- 위 예에서 머신러닝 모델을 만들지 않고서도 무조건 '클릭 아님'으로 예측하면 그 정확도가 99%가 됨.
따라서, '정확도'만으로 모델의 성능을 판별하는 것은 지양해야 함.
- digits 데이터셋에서 Target 데이터를 숫자 9이면 True, 그렇지 않으면 False로 변환하여 1:9의 불균형 데이터셋 생성
In [44]:
from sklearn.datasets import load_digits

digits = load_digits()
y = digits.target == 9

X_train, X_test, y_train, y_test = train_test_split(digits.data, y, random_state=0)
print(X_train.shape)
print(y_train.shape)
print(X_test.shape)
print(y_test.shape)
print(y_test[:10])
print()
print(len(np.where(y_test == True)[0]))
print(len(np.where(y_test == False)[0]))
(1347, 64)
(1347,)
(450, 64)
(450,)
[False False False False False False False  True False False]

47
403
- 정답 '9임'의 총 개수: 47 --> *양성 클래스*
- 정답 '9가 아님'의 총 개수: 403 --> *음성 클래스*
DummyClassifier
- strategy='stratified'
- 기본값
- 레이블 비율에 맞추어서 예측
- strategy='most_frequent'
- 가장 많은 레이블로 항상 예측
- strategy='stratified'
DummyRegressor
- strategy='mean'
- strategy='median'
- 아무런 학습을 하지 않고도 90% 정확도가 나올 수 있음
In [45]:
from sklearn.dummy import DummyClassifier
dummy_majority = DummyClassifier(strategy='most_frequent').fit(X_train, y_train)
pred_most_frequent = dummy_majority.predict(X_test)

print("Unique predicted labels: {}".format(np.unique(pred_most_frequent)))
print("Test score: {:.2f}".format(dummy_majority.score(X_test, y_test)))
Unique predicted labels: [False]
Test score: 0.90
- 정상적인 학습을 하더라도 92% 정확도가 나옴 --> 위의 결과와 그리 차이가 없음
In [46]:
from sklearn.tree import DecisionTreeClassifier
tree = DecisionTreeClassifier(max_depth=2).fit(X_train, y_train)
pred_tree = tree.predict(X_test)
print("Test score: {:.2f}".format(tree.score(X_test, y_test)))
Test score: 0.92
- 레이블 비율에 맞추어서 예측을 하는 Dummy 모델도 꽤 성능이 좋음.
In [47]:
from sklearn.linear_model import LogisticRegression

dummy = DummyClassifier().fit(X_train, y_train)
pred_dummy = dummy.predict(X_test)
print("Unique predicted labels: {}".format(np.unique(pred_dummy)))
print("dummy score: {:.2f}".format(dummy.score(X_test, y_test)))

logreg = LogisticRegression(C=0.1).fit(X_train, y_train)
pred_logreg = logreg.predict(X_test)
print("logreg score: {:.2f}".format(logreg.score(X_test, y_test)))
Unique predicted labels: [False  True]
dummy score: 0.82
logreg score: 0.98
- Dummy 분류기 조차 매우 좋은 예측 정확도를 산출하는 점에 유의
- 현실세계에서 많이 발생할 수 있는 불균형 데이터셋(Imbalanced datasets)과 함께 오로지 정확도만으로 모델의 성능을 지표화하는 것은 올바른 방법이 아님
Confusion matrices
- 오차 행렬(Confusion Matrix)
- 이진 분류 평가 결과를 나타낼 때 가장 널리 사용되는 방식
- 행(Row)
- 정답 클래스
- 열(Colume)
- 예측 클래스
In [48]:
from sklearn.metrics import confusion_matrix

print(len(np.where(y_test == True)[0]))
print(len(np.where(y_test == False)[0]))

confusion = confusion_matrix(y_test, pred_logreg)
print("Confusion matrix:\n{}".format(confusion))
47
403
Confusion matrix:
[[401   2]
 [  8  39]]
[*음성* 정답] - 정답 '9가 아님'의 총 개수: 403
- [*음성* 예측] - 예측 '9가 아님'의 총 개수: 401 --> *True Negative (TN)*
- [*양성* 예측] - 예측 '9임'의 총 개수: 2 --> *False Positive (FP, 거짓 양성)* --> 잘못된 양성 분류
[*양성* 정답] - 정답 '9임'의 총 개수: 47
- [*음성* 예측] - 예측 '9가 아님'의 총 개수: 8 --> *False Negative (FN, 거짓 음성)* --> 잘못된 음성 분류
- [*양성* 예측] - 예측 '9임'의 총 개수: 39 --> *True Positive (TP)*
In [49]:
mglearn.plots.plot_confusion_matrix_illustration()

In [50]:
mglearn.plots.plot_binary_confusion_matrix()

In [51]:
print("Most frequent class:")
print(confusion_matrix(y_test, pred_most_frequent))

print("\nDummy model:")
print(confusion_matrix(y_test, pred_dummy))

print("\nDecision tree:")
print(confusion_matrix(y_test, pred_tree))

print("\nLogistic Regression")
print(confusion_matrix(y_test, pred_logreg))
Most frequent class:
[[403   0]
 [ 47   0]]

Dummy model:
[[361  42]
 [ 41   6]]

Decision tree:
[[390  13]
 [ 24  23]]

Logistic Regression
[[401   2]
 [  8  39]]
Accuracy (정확도)
\begin{equation} \text{Accuracy} = \frac{\text{TP} + \text{TN}}{\text{TP} + \text{TN} + \text{FP} + \text{FN}} \end{equation}- 전체 샘플 수 중에서 정확히 예측한 것(TP 와 TN)의 비율
- scikit-learn 에서 score 함수가 반환하는 값
Precision (정밀도)
\begin{equation} \text{Precision} = \frac{\text{TP}}{\text{TP} + \text{FP}} \end{equation}- 양성(Positive)로 예측한 것(TP와 FP)들 중 진짜 양성인 것(TP)의 비율
- 거짓 양성(FP)의 수를 줄이는 것을 목표로 할 때 사용하는 지표
- 신약의 효과 검증 등 임상 시험에 많이 사용
- 거짓 음성(FN)의 수가 늘어나는 것에 대해 정밀도 수치는 영향받지 않음
- 양성 예측도 (PPV)라고도 불리움
Recall (재현율)
\begin{equation} \text{Recall} = \frac{\text{TP}}{\text{TP} + \text{FN}} \end{equation}- 진짜 양성인 것(FN과 TP)들 중 올바르게 양성으로 예측된 것(TP)의 비율
- 거짓 음성(FN)의 수를 줄이는 것을 목표로 할 때 사용하는 지표
- 암 진단
- 거짓 양성(FP)의 수가 늘어나는 것에 대해 재현율 수치는 영향받지 않음*
- 즉, 건강한 사람이 일부 암 진단을 받더라도 암에 걸린 사람을 빠짐없이 찾는 것이 더 중요
- 민감도(Sensitivity), 적중률(Hit Rate), 진짜 양성 비율 (TPR)라고도 불리움
f-score (f-점수)
- $P$: Precision
- $R$: Recall
- 정밀도와 재현율은 상충 관계
- 모든 샘플을 양성 클래스로만 예측한 경우
- FP와 TP만 존재
- 재현율: 1, 정밀도는 상대적으로 낮아짐
- 하나의 샘플만 (올바르게) 양성 클래스로 예측하고 나머지 샘플을 음성 클래스로만 예측한 경우
- TN과 FN만 존재
- 정밀도: 1, 재현율은 상대적으로 낮아짐
- f-score
- 정밀도와 재현율의 조화 평균
- 정밀도와 재현울을 동시에 고려한 수치이므로 불균한 이진 분류문제의 정확도(Accuracy)보다 더 나은 지표
- f1-score
- f-score 공식에서 $\alpha=0.5$
- f-measure (f-측정)이라고도 함
[Note] 주가 변동 이진 분류 예측
- 특성 데이터
- 일봉의 종가 기반
- N개 종목의 과거 M일치의 종가 데이터
- 1개 샘플의 특성 데이터 크기 N * M
- 하루씩 Shift하면서 새로운 샘플 생성
- 타겟 데이터
- 특정 종목의 M+1일의 종가 데이터
- 직전 M일자 종가보다 M+1일자 종가가 올랐다면 1, 그렇지 않으면 0
- 두 가지 분류 클래스
- 1: 양성 (Positive) 클래스
- 0: 음성 (Negative) 클래스
- 성능 평가 측정
- Accuracy는 당연히 높아야 함.
- Precision과 Recall은 상충관계이므로 둘 중 하나를 택하여 더 집중적으로 높여야 한다면 어떤것을 높여야 하나?
- Precision 관점
- 거짓 양성(FP)을 줄이는 것을 목적
- 즉, 주가가 올라간다고 예측을 했는 데, 실제로는 하락을 한 경우를 줄이고자 함.
- 재화의 상실
- Recall 관점
- 거짓 음성(FN)을 줄이는 것을 목적
- 즉, 주가가 하락한다고 예측을 했는 데, 실제로는 상승을 한 경우를 줄이고자 함.
- 기회의 상실
- Precision 관점
In [52]:
from sklearn.metrics import f1_score
print("f1 score most frequent: {:.2f}".format(f1_score(y_test, pred_most_frequent)))
print("f1 score dummy: {:.2f}".format(f1_score(y_test, pred_dummy)))
print("f1 score tree: {:.2f}".format(f1_score(y_test, pred_tree)))
print("f1 score logistic regression: {:.2f}".format(f1_score(y_test, pred_logreg)))
f1 score most frequent: 0.00
f1 score dummy: 0.13
f1 score tree: 0.55
f1 score logistic regression: 0.89
/Users/yhhan/anaconda3/lib/python3.6/site-packages/sklearn/metrics/classification.py:1135: UndefinedMetricWarning: F-score is ill-defined and being set to 0.0 due to no predicted samples.
  'precision', 'predicted', average, warn_for)
- f1 score most frequent 모델의 f1 점수는 TP가 0이므로, 재현율과 정밀도가 모두 0
- 그러므로 f1 점수 공식에서 분모가 0
- 위 Warning 메시지의 원인
- f1-점수로 비교해본 가장 좋은 모델
- Logistic Regression
- sklearn.metrics.classification_report
- 각 클래스마다 교대로 양성임을 가정
- 상위 두 개의 출력 라인
- 해당 클래스가 양성일 때 다음 4개의 값을 출력
- 정밀도(precision)
- 재현율(recall)
- f1-점수(f1-score)
- 해당 클래스에 실제로 속한 샘플 개수(support)
- 정답 데이터인 y_test에 대한 각 클래스별 샘플 개수
- 해당 클래스가 양성일 때 다음 4개의 값을 출력
In [53]:
from sklearn.metrics import classification_report
print(classification_report(y_test, pred_most_frequent, target_names=["not nine", "nine"]))
             precision    recall  f1-score   support

   not nine       0.90      1.00      0.94       403
       nine       0.00      0.00      0.00        47

avg / total       0.80      0.90      0.85       450
/Users/yhhan/anaconda3/lib/python3.6/site-packages/sklearn/metrics/classification.py:1135: UndefinedMetricWarning: Precision and F-score are ill-defined and being set to 0.0 in labels with no predicted samples.
  'precision', 'predicted', average, warn_for)
In [54]:
print(classification_report(y_test, pred_dummy, target_names=["not nine", "nine"]))
             precision    recall  f1-score   support

   not nine       0.90      0.90      0.90       403
       nine       0.12      0.13      0.13        47

avg / total       0.82      0.82      0.82       450
In [55]:
print(classification_report(y_test, pred_logreg, target_names=["not nine", "nine"]))
             precision    recall  f1-score   support

   not nine       0.98      1.00      0.99       403
       nine       0.95      0.83      0.89        47

avg / total       0.98      0.98      0.98       450
Taking uncertainty into account
- 모델 예측의 확신도를 가늠하기 위한 함수
- decicion_function
- 임계값: 0
- decision_fuction의 임계값이 0일 때 클래스 분류
- decision_function() <= 0 --> 클래스 0 (음성 클래스)로 분류
- decision_function() > 0 --> 클래스 1 (양성 클래스)로 분류
- predict_proba
- 임계값: 0.5
- decicion_function
In [56]:
from mglearn.datasets import make_blobs

X, y = make_blobs(
    n_samples=(400, 50),  # 음성 클래스: 400개, 양성 클래스: 50개
    centers=2,
    cluster_std=[7.0, 2],
    random_state=22
)

X_train, X_test, y_train, y_test = train_test_split(X, y, random_state=0)
print(X_train.shape)
print(y_train.shape)
print()
print(X_test.shape)
print(y_test.shape)

svc = SVC(gamma=.05).fit(X_train, y_train)
(337, 2)
(337,)

(113, 2)
(113,)
In [57]:
mglearn.plots.plot_decision_threshold()

- 위 상위 두 개의 그림에서 검은색 동그라미
- decision_fuction의 임계점이 0일 때와 -0.8일 때의 경계 위치
- 이 동그라미 내부는 양성 클래스(decision_function() > 0)로 분류, 바깥쪽은 음성 클래스로 분류
In [58]:
print(classification_report(y_test, svc.predict(X_test)))
             precision    recall  f1-score   support

          0       0.97      0.89      0.93       104
          1       0.35      0.67      0.46         9

avg / total       0.92      0.88      0.89       113
- 양성 클래스 1에 대해 정밀도(0.35)가 매우 낮음, 재현율(0.67)도 낮음.
- 음성 클래스 0에 대한 샘플 수가 많아서 생긴 결과임 --> 데이터 불균형
- 이제 클래스 1의 재현율(recall)을 높이는 것이 중요하다고 가정.
- 즉, 거짓 양성(FP)의 수가 늘어나도 중요하지 않음.
- 진짜 양성(TP)을 늘리고 거짓 음성(FN)을 줄이려고 함.
- decision_function의 임계값을 낮추면 클래스 1로 분류되는 경우가 더 많아짐
In [59]:
y_pred_lower_threshold = svc.decision_function(X_test) > -.8
print(y_pred_lower_threshold.shape)
(113,)
In [60]:
print(classification_report(y_test, y_pred_lower_threshold))
             precision    recall  f1-score   support

          0       1.00      0.82      0.90       104
          1       0.32      1.00      0.49         9

avg / total       0.95      0.83      0.87       113
- 클래스 1의 재현율이 1.00 --> 즉, 거짓 음성은 전혀 없음
- 반면에 정밀도는 다소 낮아짐
- decision_function 값의 임계점을 고르는 일반적인 방법을 제시하기는 어려움
Precision-Recall curves (정밀도-재현율 곡선)
- 분류 임계값 조정 작업
- 정밀도와 재현율의 상충 관계 조정하는 일과 동일
- 임계값 조정은 비지니스 목표에 의존적
- 비지니스 목표: 어떤 클래스에 대해 목표로 하는 재현율 또는 정밀도 값을 얻어냄
- 예를 들어 양성 클래스에 대하여 90% 재현율 산출이 비지니스 목표가 될 수 있음
- *운영 포인트 (Operating Point)* 지정
- 예: 90% 재현율 산출
- 분류 모델이 목표로 하는 성능지표를 지정하는 작업
- 비지니스 목표와 연관이 깊음
- 많은 경우 운영 포인트를 정확하게 지정하는 것은 어려움
- 이런 경우 임계값을 폭넓게 변경해 가며 정밀도와 재현율을 산출하며 그 장단점을 살펴보는 작업 필요
- 이를 위해 *정밀도-재현율 곡선*을 사용
- sklearn.metrics.precision_recall_curve
- 가능한 모든 임계값에 대한 정밀도와 재현율 값을 리스트로 반환
In [61]:
from sklearn.metrics import precision_recall_curve

precision, recall, thresholds = precision_recall_curve(y_test, svc.decision_function(X_test))

print("precision: {}\n".format(precision))
print("recall: {}\n".format(recall))
print("thresholds: {}\n".format(thresholds))

close_zero = np.argmin(np.abs(thresholds))
print(close_zero)
print(thresholds[close_zero])
precision: [0.321 0.296 0.308 0.32  0.333 0.348 0.364 0.381 0.4   0.368 0.333 0.353
 0.375 0.4   0.429 0.385 0.417 0.455 0.4   0.444 0.5   0.571 0.667 0.6
 0.5   0.667 0.5   1.    1.   ]

recall: [1.    0.889 0.889 0.889 0.889 0.889 0.889 0.889 0.889 0.778 0.667 0.667
 0.667 0.667 0.667 0.556 0.556 0.556 0.444 0.444 0.444 0.444 0.444 0.333
 0.222 0.222 0.111 0.111 0.   ]

thresholds: [-0.751 -0.587 -0.487 -0.444 -0.404 -0.29  -0.242 -0.193 -0.179 -0.166
 -0.16   0.086  0.146  0.192  0.37   0.52   0.523  0.532  0.632  0.744
  0.872  0.88   0.884  0.978  1.     1.07   1.084  1.251]

11
0.08620483947417501
In [62]:
# create a similar dataset as before, but with more samples
# to get a smoother curve
X, y = make_blobs(
    n_samples=(4000, 500),
    centers=2,
    cluster_std=[7.0, 2],
    random_state=22
)

X_train, X_test, y_train, y_test = train_test_split(X, y, random_state=0)

svc = SVC(gamma=.05).fit(X_train, y_train)

precision, recall, thresholds = precision_recall_curve(y_test, svc.decision_function(X_test))

# find threshold closest to zero
close_zero = np.argmin(np.abs(thresholds))
plt.plot(
    precision[close_zero],
    recall[close_zero],
    'o',
    markersize=10,
    label="threshold zero",
    fillstyle="none",
    c='k',
    mew=2)

plt.plot(precision, recall, label="precision recall curve")
plt.xlabel("Precision")
plt.ylabel("Recall")
plt.legend(loc="best")
Out[62]:
<matplotlib.legend.Legend at 0x1c14894f98>

- 위그림의 파란색 곡선은 decision_function의 가능한 모든 임계값에 대응되는 Precision과 Recall 값을 나타냄
- 검은색 원은 decision_function의 기본 임계값인 0의 지점을 나타냄
- 이 지점은 predict 메소드를 호출할 때 사용되는 임계 지점 값
- 위 정밀도-재현율 곡선은 오른쪽 위로 갈 수록 좋은 분류기
- 오른쪽 위 --> 정밀도와 재현율이 모두 높은 곳
- 위 그래프에서 알 수 있는 것
- 0.9 정도의 높은 Recall을 유지하면서도 0.5 정도의 Precision을 얻을 수 있음
- 0.5보다 더 높은 Precision을 얻어내기 위해서는 Recall을 많이 손해 봐야 함
- RandomForestClassifier는 decision_function은 제공하지 않고 predict_proba만 제공
- rf.predict_proba(X_test)[:, 1]
- 양성 클래스(클래스 1)의 확신 정도값을 가지고 오는 코드
- 기본 임계값: 0.5
- rf.predict_proba(X_test)[:, 1]
In [63]:
from sklearn.ensemble import RandomForestClassifier

rf = RandomForestClassifier(n_estimators=100, random_state=0, max_features=2)
rf.fit(X_train, y_train)

# RandomForestClassifier has predict_proba, but not decision_function
precision_rf, recall_rf, thresholds_rf = precision_recall_curve(y_test, rf.predict_proba(X_test)[:, 1])

plt.plot(precision, recall, label="svc")

plt.plot(
    precision[close_zero],
    recall[close_zero],
    'o',
    markersize=10,
    label="threshold zero svc",
    fillstyle="none",
    c='k',
    mew=2)

plt.plot(precision_rf, recall_rf, label="rf")

close_default_rf = np.argmin(np.abs(thresholds_rf - 0.5))

plt.plot(
    precision_rf[close_default_rf],
    recall_rf[close_default_rf],
    '^',
    markersize=10,
    label="threshold 0.5 rf",
    fillstyle="none",
    c='k',
    mew=2)

plt.xlabel("Precision")
plt.ylabel("Recall")
plt.legend(loc="best")
Out[63]:
<matplotlib.legend.Legend at 0x1c182e6be0>

- 높은 Precision 또는 높은 Recall을 얻기 위해서는 RandomForestClassifier가 더 좋은 모델
- Precision 과 Recall 두 개의 값을 적절히 동시에 높은 값을 얻기 위해서는 SVC가 더 좋은 모델
- f1-score만으로는 이런 세세한 부분을 비교할 수 없음
- f1-score는 정밀도-재현율 곡선의 한 지점인 기본 임계값에 대한 점수임
In [64]:
from sklearn.metrics import f1_score

print("f1_score of random forest: {:.3f}".format(f1_score(y_test, rf.predict(X_test))))
print("f1_score of svc: {:.3f}".format(f1_score(y_test, svc.predict(X_test))))
f1_score of random forest: 0.610
f1_score of svc: 0.656
- 어느 모델이 좋은지 보다 정확하게 비교하려면...
- 특정 임계값이나 운영 포인트에 국한하지 않고 전체 곡선에 대한 정보를 요약해야 함
- *Average Precision (평균 정밀도)*
- 정밀도-재현율 곡선의 아랫부분 면적을 계산한 값
- 항상 0(가장 나쁨)에서 1(가장 좋음)사이의 값을 지님
- sklearn.metrics.average_precision_score
In [65]:
from sklearn.metrics import average_precision_score

ap_rf = average_precision_score(y_test, rf.predict_proba(X_test)[:, 1])
ap_svc = average_precision_score(y_test, svc.decision_function(X_test))

print("Average precision of random forest: {:.3f}".format(ap_rf))
print("Average precision of svc: {:.3f}".format(ap_svc))
Average precision of random forest: 0.660
Average precision of svc: 0.666
- 평균 정밀도 측면에서 RandomForestClassifier와 SVC가 큰 차이 없음
Receiver Operating Characteristics (ROC) and AUC
- 진짜 양성 비율 (TPR): 전체 양성 샘플(TP와 FN)중에서 진짜 양성(TP)로 올바로 분류된 비율 = 재현율
- 거짓 양성 비율 (FPR): 전체 음성 샘플(FP와 TN) 중에서 거짓 양성(FP)로 잘못 분류된 비율 \begin{equation} \text{FPR} = \frac{\text{FP}}{\text{FP} + \text{TN}} \end{equation}
- TPR과 FPR의 해석 - TPR과 FPR은 서로 반비례적인 관계에 있다. 암환자를 진단할 때, 성급한 의사는 아주 조금의 징후만 보여도 암인 것 같다고 할 것이다. 이 경우 TPR은 1에 가까워질 것이다. 그러나 FPR은 반대로 매우 낮아져버린다. (정상인 사람도 다 암이라고 하니까)
- 반대로 돌팔이 의사라서 암환자를 알아내지 못한다면, 모든 환자에 대해 암이 아니라고 할 것이다. 이 경우 TPR은 매우 낮아져 0에 가까워 질 것이다. 그러나 반대로 FPR은 급격히 높아져 1에 가까워질 것이다.(암환자라는 진단 자체를 안하므로, 암환자라고 잘못 진단 하는 경우가 없음)
- 출처: http://newsight.tistory.com/53 [New Sight]
- ROC 곡선
- ROC curve is created by plotting the true positive rate (TPR) against the false positive rate (FPR) at various threshold settings.
- '수신기 운영 특성 (Receiver Operating Characteristics)'이라는 이름은 신호 탐지 이론에서 비롯
- 이름 그 자체의 의미는 무시하고 'TPR-FPR 곡선'으로 이해하는 것이 좋음
In [66]:
from sklearn.metrics import roc_curve
fpr, tpr, thresholds = roc_curve(y_test, svc.decision_function(X_test))

plt.plot(fpr, tpr, label="ROC Curve")
plt.xlabel("FPR")
plt.ylabel("TPR (recall)")

# find threshold closest to zero
close_zero = np.argmin(np.abs(thresholds))
plt.plot(fpr[close_zero], tpr[close_zero], 'o', markersize=10, label="threshold zero", fillstyle="none", c='k', mew=2)
plt.legend(loc=4)
Out[66]:
<matplotlib.legend.Legend at 0x1c14847550>

- ROC 곡선 해석
- ROC 곡선은 왼쪽 상단에 가까울 수록 이상적임.
- 즉, FPR은 낮게 유지하면서 TPR(재현율)은 높은 뷴류기가 좋음.
- 위 그림에서 기본 임계값 0에 대한 FPR과 TPR값보다는 FPR을 조금 더 늘려주면(0.1 정도) TPR을 상당히 높일 수 있음(0.9 정도)
- 이러한 FPR=0.1 & TPR=0.9을 산출할 수 있는 임계값이 적절한 운영 포인트가 될 수 있음
- ROC 곡선은 왼쪽 상단에 가까울 수록 이상적임.
In [67]:
fpr_rf, tpr_rf, thresholds_rf = roc_curve(y_test, rf.predict_proba(X_test)[:, 1])

plt.plot(fpr, tpr, label="ROC Curve SVC")
plt.plot(fpr_rf, tpr_rf, label="ROC Curve RF")

plt.xlabel("FPR")
plt.ylabel("TPR (recall)")
plt.plot(fpr[close_zero], tpr[close_zero], 'o', markersize=10, label="threshold zero SVC", fillstyle="none", c='k', mew=2)

close_default_rf = np.argmin(np.abs(thresholds_rf - 0.5))
plt.plot(fpr_rf[close_default_rf], tpr[close_default_rf], '^', markersize=10, label="threshold 0.5 RF", fillstyle="none", c='k', mew=2)

plt.legend(loc=4)
Out[67]:
<matplotlib.legend.Legend at 0x1c183caf98>

- 두 개의 ROC 곡선 해석
- RandomForest 모델이 SVC 보다 좀 더 왼쪽 상단으로 ROC 곡선이 위치하는 듯 함
- 어떤 ROC 곡선이 더 좋은지 알아보기 ROC 곡선아래의 면적을 하나의 값으로 요약할 수 있음
- AUC (Area Under the (ROC) Curve)
- 0(최악) ~ 1(최선)
- 수집한 데이터가 불균현한 데이터 집합이라면 정확도보다 AUC가 더 의미있는 지표
- sklearn.metrics.roc_auc_score
- AUC (Area Under the (ROC) Curve)
In [68]:
from sklearn.metrics import roc_auc_score

rf_auc = roc_auc_score(y_test, rf.predict_proba(X_test)[:, 1])
svc_auc = roc_auc_score(y_test, svc.decision_function(X_test))

print("AUC for Random Forest: {:.3f}".format(rf_auc))
print("AUC for SVC: {:.3f}".format(svc_auc))
AUC for Random Forest: 0.937
AUC for SVC: 0.916
- AUC 측면에서 RandomForest 모델이 SVC 보다 좀 더 좋다고 볼 수 있음
In [69]:
y = digits.target == 9

X_train, X_test, y_train, y_test = train_test_split(digits.data, y, random_state=0)

plt.figure()

for gamma in [1, 0.05, 0.01]:
    svc = SVC(gamma=gamma).fit(X_train, y_train)

    accuracy = svc.score(X_test, y_test)
    auc = roc_auc_score(y_test, svc.decision_function(X_test))
    fpr, tpr, _ = roc_curve(y_test , svc.decision_function(X_test))

    print("gamma = {:.2f}  accuracy = {:.2f}  AUC = {:.2f}".format(gamma, accuracy, auc))
    plt.plot(fpr, tpr, label="gamma={:.3f}".format(gamma))

plt.xlabel("FPR")
plt.ylabel("TPR")
plt.xlim(-0.01, 1)
plt.ylim(0, 1.02)
plt.legend(loc="best")
gamma = 1.00  accuracy = 0.90  AUC = 0.50
gamma = 0.05  accuracy = 0.90  AUC = 1.00
gamma = 0.01  accuracy = 0.90  AUC = 1.00
Out[69]:
<matplotlib.legend.Legend at 0x1c14868be0>

Multi-class classification
- 다중클래스 분류문제에서 불균형 데이터에 대해서 Accuracy(정확도) 지표는 좋은 지표가 되지 못함.
- 훈련 샘플 비율
- A 클래스: 85%
- B 클래스: 10%
- C 클래스: 5%
- 실제 새로운 데이터도 위와 같은 비율로 출현한다고 하면 아무런 학습이 안된 모델 (Dummy Model)도 85% 정확도를 산출할 수 있음.
- 훈련 샘플 비율
In [78]:
from sklearn.metrics import accuracy_score

X_train, X_test, y_train, y_test = train_test_split(digits.data, digits.target, random_state=0)

lr = LogisticRegression().fit(X_train, y_train)
pred = lr.predict(X_test)

print("Shape of Test data: {}".format(y_test.shape))
print("Accuracy: {:.3f}".format(accuracy_score(y_test, pred)))
print()
print("Confusion matrix:\n{}".format(confusion_matrix(y_test, pred)))
Shape of Test data: (450,)
Accuracy: 0.953

Confusion matrix:
[[37  0  0  0  0  0  0  0  0  0]
 [ 0 39  0  0  0  0  2  0  2  0]
 [ 0  0 41  3  0  0  0  0  0  0]
 [ 0  0  1 43  0  0  0  0  0  1]
 [ 0  0  0  0 38  0  0  0  0  0]
 [ 0  1  0  0  0 47  0  0  0  0]
 [ 0  0  0  0  0  0 52  0  0  0]
 [ 0  1  0  1  1  0  0 45  0  0]
 [ 0  3  1  0  0  0  0  0 43  1]
 [ 0  0  0  1  0  1  0  0  1 44]]
- 다중 클래스 예측 결과에 대한 confusion matrix
- 행: 정답 레이블
- 열: 예측 레이블
- 위 confusion matrix에서 레이블 0에 대한 해석
$ \begin{bmatrix} TN & FP \\ FN & TP \end{bmatrix} = \begin{bmatrix} 413 & 0 \\ 0 & 37 \end{bmatrix} $
- 클래스 0에 대해서는 거짓 음성(FN)이 없음
- 첫번째 행(예측 레이블 행)에서 다른 항목들이 모두 0
- 클래스 0에 대해서는 거짓 양성(FP)이 없음
- 첫번째 열(정답 레이블 열)에서 다른 항목들이 모두 0
- Accuracy = 1.0
- Precision = 1.0
- Recall = 1.0
- F1-score = 1.0
- 위 confusion matrix에서 레이블 1에 대한 해석 $ \begin{bmatrix} TN & FP \\ FN & TP \end{bmatrix} = \begin{bmatrix} 402 & 5 \\ 4 & 39 \end{bmatrix} $ - 클래스 1에 대해서는 거짓 음성(FN)이 4건 - 클래스 1에 대해서는 거짓 양성(FP)이 5건 - Accuracy = (402+39)/450 = 0.98 - Precision = 39/(39+5) = 0.89 - Recall = 39/(4+39) = 0.91 - F1-score = 2 x 0.89 x 0.91 / (0.89 + 0.91) = 0.90
- 위 confusion matrix에서 레이블 7에 대한 해석 $
= \begin{bmatrix} 402 & 0 \\ 3 & 45 \end{bmatrix} $
- 클래스 7에 대해서는 거짓 음성(FN)이 3건
- 클래스 7에 대해서는 거짓 양성(FP)이 0건
- Accuracy = (402+45)/450 = 0.99
- Precision = 45/45 = 1.0
- Recall = 45/(3+45) = 0.94
- F1-score = 2 x 1.0 x 0.94 / (1.0 + 0.94) = 0.97
In [71]:
scores_image = mglearn.tools.heatmap(
    confusion_matrix(y_test, pred), xlabel='Predicted label',
    ylabel='True label', xticklabels=digits.target_names,
    yticklabels=digits.target_names, cmap=plt.cm.gray_r, fmt="%d")

plt.title("Confusion matrix")
plt.gca().invert_yaxis()

In [72]:
print(classification_report(y_test, pred))
             precision    recall  f1-score   support

          0       1.00      1.00      1.00        37
          1       0.89      0.91      0.90        43
          2       0.95      0.93      0.94        44
          3       0.90      0.96      0.92        45
          4       0.97      1.00      0.99        38
          5       0.98      0.98      0.98        48
          6       0.96      1.00      0.98        52
          7       1.00      0.94      0.97        48
          8       0.93      0.90      0.91        48
          9       0.96      0.94      0.95        47

avg / total       0.95      0.95      0.95       450
- 관심있는 클래스를 양성, 그 외의 모든 클래스는 음성으로 두고 precision, recall, f1-score 계산
- [NOTE] 다중 분류에서 불균형 데이터셋을 위해 가장 많이 사용되는 지표는 f1-score
- 클래스별로 f1-score를 산출한 이후, 전체 클래스에 대한 평균 f1-score 산출 전략 (다중 클래스일 때 반드시 아래 세 개의 항목 중 하나를 average 파라미터 값으로 제시해야 함)
- macro 평균
- 클래스별 f1-score에 가중치를 고려하지 않음
- weighted 평균 (보통은 이것을 선택)
- 클래스별 테스트 데이터 샘플 수로 가중치를 두어 f1-score 계산 (classification_report에 노출되는 값)
- micro 평균
- 모든 클래스별로 FP, FN, TP의 총 수를 헤아린 다음 산출
- macro 평균
In [73]:
print("Macro average f1 score: {:.3f}".format(f1_score(y_test, pred, average="macro")))

print("Weighted average f1 score: {:.3f}".format(f1_score(y_test, pred, average="weighted")))

print("Micro average f1 score: {:.3f}".format(f1_score(y_test, pred, average="micro")))
Macro average f1 score: 0.954
Weighted average f1 score: 0.953
Micro average f1 score: 0.953
Regression metrics
- Explained variance score

- $\hat{y}$: the estimated target output
- $y$: the corresponding (correct) target output
- $Var$: Variance
- Mean absolute error

- $\hat{y}_i$: the predicted value of the $i$-th sample
- $y_i$: the corresponding (correct) target output
- $n_{samples}$: the number of target samples
- Mean squared error

- $\hat{y}_i$: the predicted value of the $i$-th sample
- $y_i$: the corresponding (correct) target output
- $n_{samples}$: the number of target samples
- Mean squared logarithmic error

- This metric is best to use when targets having exponential growth, such as population counts, average sales of a commodity over a span of years etc.
- $\hat{y}_i$: the predicted value of the $i$-th sample
- $y_i$: the corresponding (correct) target output
- $n_{samples}$: the number of target samples
- Median absolute error

- It is particularly interesting because it is robust to outliers.
- The loss is calculated by taking the median of all absolute differences between the target and the prediction.
- $\hat{y}_i$: the predicted value of the $i$-th sample
- $y_i$: the corresponding (correct) target output
- $R^2$ score (the coefficient of determination)

- where

- It provides a measure of how well future samples are likely to be predicted by the model.
- $\hat{y}_i$: the predicted value of the $i$-th sample
- $y_i$: the corresponding (correct) target output
In [103]:
from sklearn.metrics import explained_variance_score
from sklearn.metrics import mean_absolute_error
from sklearn.metrics import mean_squared_error
from sklearn.metrics import mean_squared_log_error
from sklearn.metrics import median_absolute_error
from sklearn.metrics import r2_score

y_test = [3, -0.5, 2, 7]
y_pred = [2.5, 0.0, 2, 8]

print("explained_variance_score:", explained_variance_score(y_test, y_pred))
print("mean_absolute_error:", mean_absolute_error(y_test, y_pred))
print("mean_squared_error:", mean_squared_error(y_test, y_pred))
print("mean_squared_log_error:", mean_squared_log_error(y_test, y_pred))
print("median_absolute_error:", median_absolute_error(y_test, y_pred))
print("r2_score:", r2_score(y_test, y_pred))
explained_variance_score: 0.9571734475374732
mean_absolute_error: 0.5
mean_squared_error: 0.375
mean_squared_log_error: 0.12803912255571967
median_absolute_error: 0.5
r2_score: 0.9486081370449679
- [NOTE]: 전형적인 교차검증을 활용한 Regression 모델 구성 및 성능 측정
In [124]:
import warnings
warnings.filterwarnings('ignore')
from sklearn.ensemble import GradientBoostingRegressor

X, y = mglearn.datasets.make_wave(n_samples=200)
print("X shape: {}".format(X.shape))
print("y shape: {}".format(y.shape))

X_train, X_test, y_train, y_test = train_test_split(X, y, random_state=42)
print("X_train shape: {}".format(X_train.shape))
print("X_test shape: {}".format(X_test.shape))

print()

param_grid = {
    'learning_rate': [0.001, 0.01, 0.1, 1, 10, 100],
    'alpha': [0.1, 0.3, 0.5, 0.7, 0.9]
}

estimator = GradientBoostingRegressor()

grid_search = GridSearchCV(
    estimator = estimator,
    param_grid = param_grid,
    n_jobs = -1,
    cv = 5,
    return_train_score = True
)

grid_search.fit(X_train, y_train)
print("Best cross-validation accuracy: {:.2f}".format(grid_search.best_score_))
print("Best parameters:\n{}".format(grid_search.best_params_))
print("Best estimator:\n{}".format(grid_search.best_estimator_))

print("Test set score: {:.2f}".format(grid_search.score(X_test, y_test)))

y_pred = gbr.predict(X_test)

print()

# Possible scoring
print("explained_variance_score:", explained_variance_score(y_test, y_pred))
print("mean_absolute_error:", mean_absolute_error(y_test, y_pred))
print("mean_squared_error:", mean_squared_error(y_test, y_pred))
#print("mean_squared_log_error:", mean_squared_log_error(y_test, y_pred))
print("median_absolute_error:", median_absolute_error(y_test, y_pred))
print("r2_score:", r2_score(y_test, y_pred))
X shape: (200, 1)
y shape: (200,)
X_train shape: (150, 1)
X_test shape: (50, 1)

Best cross-validation accuracy: 0.67
Best parameters:
{'alpha': 0.1, 'learning_rate': 0.1}
Best estimator:
GradientBoostingRegressor(alpha=0.1, criterion='friedman_mse', init=None,
             learning_rate=0.1, loss='ls', max_depth=3, max_features=None,
             max_leaf_nodes=None, min_impurity_decrease=0.0,
             min_impurity_split=None, min_samples_leaf=1,
             min_samples_split=2, min_weight_fraction_leaf=0.0,
             n_estimators=100, presort='auto', random_state=None,
             subsample=1.0, verbose=0, warm_start=False)
Test set score: 0.62

explained_variance_score: 0.6333933570920071
mean_absolute_error: 0.4410440244803421
mean_squared_error: 0.2945365131871811
median_absolute_error: 0.37617245551529926
r2_score: 0.6195689836183305
Using evaluation metrics in model selection
- 이진 분류
In [118]:
# default scoring for classification is accuracy
scores = cross_val_score(SVC(), digits.data, digits.target == 9)
print("Default scoring: {}".format(scores))

# providing scoring="accuracy" doesn't change the results
scores2 = cross_val_score(SVC(), digits.data, digits.target == 9, scoring="accuracy")
print("Explicit accuracy scoring: {}".format(scores2))

print()

# 곡선의 면적을 활용한 성능 측정 (Recommended)
roc_auc = cross_val_score(SVC(), digits.data, digits.target == 9, scoring="roc_auc")
print("ROC_AUC scoring: {}".format(roc_auc))

average_precision = cross_val_score(SVC(), digits.data, digits.target == 9, scoring="average_precision")
print("Average Precision scoring: {}".format(average_precision))

print()

# 다양한 성능 측정 (Not Recommended)
precision = cross_val_score(SVC(), digits.data, digits.target == 9, scoring="precision_weighted")
print("Precision scoring: {}".format(precision))

recall = cross_val_score(SVC(), digits.data, digits.target == 9, scoring="recall_weighted")
print("Precision scoring: {}".format(recall))

f1_score = cross_val_score(SVC(), digits.data, digits.target == 9, scoring="f1_weighted")
print("F1_score scoring: {}".format(f1_score))
Default scoring: [0.9 0.9 0.9]
Explicit accuracy scoring: [0.9 0.9 0.9]

ROC_AUC scoring: [0.994 0.99  0.996]
Average Precision scoring: [0.96  0.953 0.978]

Precision scoring: [0.81 0.81 0.81]
Precision scoring: [0.9 0.9 0.9]
F1_score scoring: [0.852 0.852 0.852]
- 다중 분류
In [119]:
scores = cross_val_score(SVC(), digits.data, digits.target, scoring="accuracy")
print("Explicit accuracy scoring: {}".format(scores))

f1_weighted = cross_val_score(SVC(), digits.data, digits.target, scoring="f1_weighted")
print("F1_weighted scoring: {}".format(f1_weighted))
Explicit accuracy scoring: [0.394 0.411 0.46 ]
F1_weighted scoring: [0.439 0.463 0.524]
- GridSearchCV에 다양한 scoring 적용
In [120]:
X_train, X_test, y_train, y_test = train_test_split(digits.data, digits.target == 9, random_state=0)

# we provide a somewhat bad grid to illustrate the point:
param_grid = {'gamma': [0.0001, 0.01, 0.1, 1, 10]}

# using the default scoring of accuracy:
grid = GridSearchCV(SVC(), param_grid=param_grid)
grid.fit(X_train, y_train)
print("Grid-Search with accuracy")
print("Best parameters:", grid.best_params_)
print("Best cross-validation score (accuracy)): {:.3f}".format(grid.best_score_))
print("Test set AUC: {:.3f}".format(roc_auc_score(y_test, grid.decision_function(X_test))))
print("Test set accuracy: {:.3f}".format(grid.score(X_test, y_test)))

print()

# using AUC scoring instead:
grid = GridSearchCV(SVC(), param_grid=param_grid, scoring="roc_auc")
grid.fit(X_train, y_train)
print("Grid-Search with AUC")
print("Best parameters:", grid.best_params_)
print("Best cross-validation score (AUC): {:.3f}".format(grid.best_score_))
print("Test set AUC: {:.3f}".format(roc_auc_score(y_test, grid.decision_function(X_test))))
print("Test set accuracy: {:.3f}".format(grid.score(X_test, y_test)))
Grid-Search with accuracy
Best parameters: {'gamma': 0.0001}
Best cross-validation score (accuracy)): 0.970
Test set AUC: 0.992
Test set accuracy: 0.973

Grid-Search with AUC
Best parameters: {'gamma': 0.01}
Best cross-validation score (AUC): 0.997
Test set AUC: 1.000
Test set accuracy: 1.000
In [121]:
from sklearn.metrics.scorer import SCORERS
print("Available scorers:\n{}".format(sorted(SCORERS.keys())))
Available scorers:
['accuracy', 'adjusted_mutual_info_score', 'adjusted_rand_score', 'average_precision', 'completeness_score', 'explained_variance', 'f1', 'f1_macro', 'f1_micro', 'f1_samples', 'f1_weighted', 'fowlkes_mallows_score', 'homogeneity_score', 'log_loss', 'mean_absolute_error', 'mean_squared_error', 'median_absolute_error', 'mutual_info_score', 'neg_log_loss', 'neg_mean_absolute_error', 'neg_mean_squared_error', 'neg_mean_squared_log_error', 'neg_median_absolute_error', 'normalized_mutual_info_score', 'precision', 'precision_macro', 'precision_micro', 'precision_samples', 'precision_weighted', 'r2', 'recall', 'recall_macro', 'recall_micro', 'recall_samples', 'recall_weighted', 'roc_auc', 'v_measure_score']